Báo cáo hóa học: " Research Article Analysis and Design of Timing Recovery Schemes for DMT Systems over Indoor Power-Line Channels" pdf
Bạn đang xem bản rút gọn của tài liệu. Xem và tải ngay bản đầy đủ của tài liệu tại đây (2.19 MB, 11 trang )
Hindawi Publishing Corporation
EURASIP Journal on Advances in Signal Processing
Volume 2007, Article ID 48931, 11 pages
doi:10.1155/2007/48931
Research Article
Analysis and Design of Timing Recovery Schemes for
DMT Systems over Indoor Power-Line Channels
Jos
´
e Antonio Cort
´
es, Luis D
´
ıez, Eduardo Martos-Naya, Francisco Javier Ca
˜
nete, and
Jos
´
eTom
´
as Entrambasaguas
Departamento de Ingenier
´
ıa de Comunicaciones, Escuela T
´
ecnica Superior de Ingenier
´
ıa de Telecomunicaci
´
on,
Universidad de M
´
alaga, 29071 M
´
alaga, Spain
Received 31 October 2006; Accepted 23 March 2007
Recommended by Mois
´
es Vidal Ribeiro
Discrete multitone (DMT) modulation is a suitable technique to cope with main impairments of broadband indoor power-line
channels: spectral selectivity and cyclic time variations. Due to the high-density constellations employed to achieve the required
bit-rates, synchronization issues became an important concern in these scenarios. This paper analyzes the performance of a con-
ventional DMT timing recovery scheme designed for linear time-invariant (LTI) channels when employed over indoor power lines.
The influence of the channel cyclic short-term variations and the sampling jitter on the system performance is assessed. Bit-rate
degradation due to timing errors is evaluated in a set of measured channels. It is shown that this synchronization mechanism limits
the system performance in many residential channels. Two improvements are proposed to avoid this end: a new phase error esti-
mator that takes into account the short-term changes in the channel response, and the introduction of notch filters in the timing
recovery loop. Simulations confirm that the new scheme eliminates the bit-rate loss in most situations.
Copyright © 2007 Jos
´
e Antonio Cort
´
es et al. This is an open access article distributed under the Creative Commons Attribution
License, which permits unrestricted use, distribution, and reproduction in any medium, provided the original work is properly
cited.
1. INTRODUCTION
The increasing demand for home networking capabilities,
along with the recent provisioning of triple-pay services (in-
ternet, video, and telephony) by digital subscriber line oper-
ators, has generated considerable interest in high-speed in-
door power-line communications. Applications range from
audio/video distribution and traditional local area network-
ing to the connection of computers and entertainment
equipment to the network access gateway. The study pre-
sented in this paper concentrates on this scenario. However,
it may be also useful for outdoor power-line applications be-
cause, since the user modem is located in an indoor network,
it also experiences the characteristics of the indoor channels.
The available bandwidth for broadband indoor power-
line communications (PLC) extends up to 30 MHz [1].
Channels are frequency- and time-selective, with signifi-
cant differences between the locations of a specific site. The
frequency response introduces remarkably amplitude and
phase distortion, with deep notches that appear in a priori
unknown positions, and the noise is strongly colored [2, 3].
Time variations have a twofold origin: long-term changes
caused by the connection and disconnection of elect rical de-
vices, with a time frame in the order of minutes or hours
[3]; and short-term changes due to the dependence of the
electrical devices impedance and emitted noise on the in-
stantaneous mains voltage. The latter causes the channel fre-
quency response to exhibit cyclic short-term variations and
the noise to present cyclostationary components, both syn-
chronous with the mains [4].
DMT is an appropriate solution to cope with the afore-
mentioned impairments. The division of the available band-
width into smaller subbands allows to comply with electro-
magnetic compatibility (EMC) regulations and to exploit the
spectral resources even when they are sparse. Similarly, time-
varying channels can be fully exploited by adapting the con-
stellation transmitted in each carrier to the instantaneous
channel conditions.
Synchronization becomes an important concern when
large spectral efficiencies are needed. Timing errors cause at-
tenuation and phase rotation of the symbols, intercarrier in-
terference (ICI) and, if not properly corrected, may result in a
severe drift of the symbol timing. Nowadays, the most com-
mon procedure to accomplish synchronization is by means
of a fixed frequency sampling and a digital phase-locked loop
(PLL) [5, 6]. This system performs two main tasks: t iming
2 EURASIP Journal on Advances in Signal Processing
recovery and timing correction. The former estimates the
phase error of the received symbols and, by means of a feed-
back loop, computes the correction to be applied by the lat-
ter. When dense constellations are to be employed, the timing
correction is carried out with an interpolator filter [5, 7].
Synchronization issues in scenarios with high signal-to-
noise ratio (SNR) carriers have been extensively studied in
digital subscriber loop (DSL) applications [5–7]. However, it
has been shown that when the same strategies are employed
in power-line channels, their performance can be seriously
degraded [8]. This inferior performance has a twofold origin:
the short-term variations of the channel response and the jit-
ter of the sampling process [8]. Uncompensated cyclic short-
term variations of the channel, with harmonics of 50 Hz–
60 Hz (depending on the mains signal frequency), mislead
the estimation of the sampling error. The periodical bias in
the phase error estimates can be reduced by narrowing the
loop bandwidth, but this also reduces the loop’s capacity to
track the sampling jitter [8]. The effect of random period in-
stabilities has been extensively studied in the downconver-
sion of orthogonal frequency-division multiplexing (OFDM)
signals [9]. In the analog-to-digital conversion, its influence
has been always neglected due to the relatively narrowband
signals involved (as in asymmetric DSL). However, when
sampling broadband signals, the relative magnitude of the
jitter with respect to the sampling period increases and its
effects cannot be neglected [8, 10].
In this paper, a new timing recovery scheme for indoor
PLC is proposed. To this end, the shortcomings of the con-
ventional strategies designed for DMT systems that operate
in LTI channels are firstly revisited [8]. This analysis sug-
gests two direct improvements: to design a phase error es-
timator that takes into account the magnitude of the cyclic
short-term changes in the channel response, and to modify
the loop response so that higher attenuation is provided to
the harmonics of the cyclic channel variations. Performance
gains and computational complexity of both alternatives are
presented and discussed.
The rest of the paper is organized as follows. In Section 2,
models employed for the channel, the timing jitter, and the
DMT receiver are described. Bit-rates obtained with the con-
ventional synchronization scheme in indoor power-line sce-
narios are given in Section 3. The proposed phase estima-
tor and loop filter are defined in Section 4.Performanceim-
provement and computational load increment of the new
scheme are also assessed in this section. Finally, main con-
clusions drawn from the presented results are summarized
in Section 5.
2. SYSTEM MODEL
2.1. Channel model
Provided that the working state of the electrical devices re-
mains unaltered, the channel can be modeled as a linear pe-
riodically time-variant (LPTV) system plus a cyclostation-
ary Gaussian noise term (neglec ting asynchronous impulse
noise). Fortunately, the delay spread of these channels is
(a)
(b)
−70
−60
−50
−40
−30
−20
−10
20 log |H(t, f )|(dB)
0
6.66
13.32
19.98
26.64
33.3
39.96
H( f )
pp
(degrees)
1 5 10 15 20
Frequency (MHz)
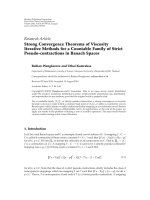
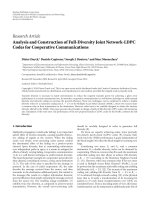
Figure 1: (a) Superimposed values of the amplitude channel
response along the mains cycle. (b) Peak excursion of the channel
phase response along the mains cycle.
much smaller than their coherence time, that is, the chan-
nels are underspread, and a slow-variation approach can be
assumed [4].
Simulations presented in this paper have been carried out
over a set of 24 channels measured in the frequency band
from 1 MHz to 20 MHz in two indoor scenarios: 12 in an
apartment of about 80 m
2
and 12 in a detached house of
about 300 m
2
. A statistical characterization of the frequency
responses and the noise instantaneous power spectral densi-
ties (IPSD) can be found in [4]. The effect of a bandpass cou-
pling circuit that serves as an antialiasing filter and protects
the receiver from the mains signal is included in all cases.
Throughout this work, averaged performance values com-
puted using the overall set of channels are always preceded
by qualitative results obtained in one of them. A represen-
tative apartment channel has been selected to this end. In
Figure 1(a), the modulus of the frequency response, H(t, f ),
along the mains cycle has been superimposed (left axis).
Figure 1(b) shows information about phase changes of the
frequency response. However, this time only the peak excur-
sion of the phase along a cycle time, defined as
H( f )
pp
= max
t
H(t, f )
−
min
t
H(t, f )
,(1)
where t
∈ [0, T
0
)andT
0
= 20 milliseconds, has been depict-
ed (right axis).
As observed, there are no significant amplitude changes,
and discarding the 4 dB that occur in the vicinity of the
notch, the maximum variation is about 2.5 dB around
1 MHz. On the contrary, remarkable phase changes occur
in the 1 MHz to 3 MHz band and in the neighborhood of
5 MHz and 9 MHz.
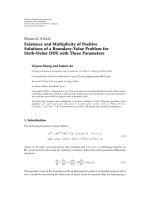
Noise in this channel is shown in Figure 2, where the val-
ues of the IPSD, S
U
(t, f ), measured along a mains cycle have
been depicted. It is worth noting that differences exceeding
20 dB do occur between 2 MHz and 3 MHz and about 15 dB
around 5 MHz.
Jos
´
e Antonio Cort
´
es et al. 3
−110
−100
−90
−80
S
U
(t, f )(dBm/kHz)
20
15
10
5
1
Frequency (MHz)
0
5
10
15
20
Time (ms)
Figure 2: Cyclostationary noise instantaneous PSD in the example
channel.
2.2. Analog-to-digital conversion model
The sampling instants of an analog-to-digital conversion
process experience two types of deviation from their nom-
inal values. The first is a systematic effect due to the fre-
quency inaccuracy of the clock that drives the analog-to-
digital converter (ADC). The influence of this phenomenon
in the performance of DMT systems has been widely studied
[5–7], and will not be considered in this work unless oth-
erwise stated. The second is a random deviation with two
components: one due to the fluctuations of the ADC sam-
pling clock period, the so-called oscillator jitter, and another
due to the uncertainty in the sampling instant introduced by
the sample-and-hold (S&H) circuit of the ADC, the so-called
aperture jitter [11].
The signal generated by an actual sinusoidal oscillator
without amplitude instabilities has the form
s(t)
= A cos
2πf
S
t + φ
o
(t)
,(2)
where φ
o
(t) is the phase noise that models the random fluc-
tuations caused by the noise sources of the circuit that gen-
erates the oscillation [12]. Due to the phase noise, the signif-
icant instants of the signal, for example, zero crossings, ex-
perience a time deviation from their nominal values. This is
the so-called timing jitter or simply jitter, τ
o
(t), whose rela-
tion with the phase noise can be generally approximated by
τ
o
(t) ≈−φ
o
(t)/2πf
S
.
Random period instabilities can be characterized in the
frequency domain by means of the phase noise spectrum,
S
φ
o
( f )[12]. For distant frequencies from the carrier, this
magnitude is related with the so-called single-sideband (SSB)
phase noise spectrum
L( f )
= 10 log
10
S
s
( f )
A
2
≈
10 log
10
S
φ
o
( f )
2
(dBc/Hz),
(3)
−150
−125
−100
−75
−50
−25
0
10 log
10
[S
φ
( f )]
1 10 100 1000 10
4
10
5
Frequency (Hz)
σ
o
= 5ps
σ
o
= 10 ps
σ
o
= 20 ps
σ
A
= 5ps
Figure 3: Oscillator and aperture phase noise spectra.
where S
s
( f ) is the PSD of the signal in (2) and dBc/Hz stands
for dB below the carrier power in a 1 Hz bandwidth. L( f )
is a very popular magnitude because it can be measured in a
quite simple way with a spectrum analyzer. In the time do-
main, the most employed magnitude is the integrated jitter,
σ
o
,computedas
σ
2
o
=
1
2πf
S
2
f
H
f
L
S
φ
o
( f )df ,(4)
where f
L
is usually fixed to 10 Hz and f
H
to 20 MHz.
Phase noise is accurately characterized by means of a
power-law model [12, 13]. It approximates S
φ
o
( f ) by a piece-
wise linear function whose slopes are in the range from
−40 dB/decade to 0 dB/decade with 10 dB/decade steps. Jitter
values employed in this work have been generated by filtering
a Gaussian white noise with a cascade of first- and second-
order transfer functions that approximate the different slopes
of the phase noise spectrum. Figure 3 shows the curves cor-
responding to three 100 MHz state-of-the-art oscillators with
integrated jitter values of 20 picoseconds, 10 picoseconds and
5 picosecond. This model is sometimes simplified, for exam-
ple, when modeling the phase noise of the oscillators em-
ployed in the downconversion of OFDM signals, and only
the −20 dB/decade slope is considered [9]. This leads to a
Lorentzian shape for L( f ) and to an analytically tractable
problem [14]. However, it produces excessively optimistic re-
sults when used to model the timing jitter of the ADC driving
clock.
Even if an ideal oscillator could be used, actual sam-
pling instant would fluctuate due to the aperture jitter, τ
A
(t).
The usual method to model these random instabilities is by
means of the aperture phase noise PSD, which is assumed to
4 EURASIP Journal on Advances in Signal Processing
x(t)
u(t)
h(t, t
− u)
+
Power-line channel
ADC
t
= nT
s
+ τ
o
[n]
Interpolator 2
r[n]
CP
+
2N-DFT
FEQ
Long-
term
FEQ
Short-
term
FEQ
Detector
NCO
Loop
filter
Phase
detector
Adaptive
channel
estimator
−→
Y
−→
Y
−→
X
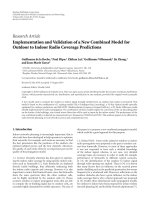
Figure 4: Simplified scheme of the DMT receiver.
have a Lorentzian shape [11]
S
φ
A
( f ) = 2π
σ
2
A
f
2
S
f
2
S
/4+ f
2
,(5)
where σ
2
A
is the aperture jitter RMS value. Figure 3 de-
picts the aperture phase noise PSD of a state-of-the-art 12-
bit, 100 MHz sampling frequency analog-to-digital converter
with 5 picosecond of RMS aperture jitter. As seen, in the fre-
quency band of interest, it is essentially flat.
Provided that the circuit has a well-designed layout, both
types of instabilities can be assumed to be independent.
Hence, their corresponding PSDs can be summed to obtain
the overall jitter, which from now on will be referred to as
ADC jitter.
2.3. DMT receiver model
The simplified block diagram of an N carrier DMT re-
ceiver with an all-digital synchronization scheme is shown in
Figure 4. The incoming signal is oversampled with an unsyn-
chronized clock. Timing error correction is carried out in the
time domain by means of an interpolator. The oversampling
is performed to reduce the typical performance degradation
experienced by interpolator filters in the vicinity of half the
Nyquist frequency. By designing interpolator filters accord-
ing to the technique described in [7], it can be ensured that
signal distortion is essentially due to the timing recovery er-
rors.
As observed, the frequency equalizer (FEQ) that follows
the discrete fourier transform (DFT) is performed in two
stages. The reason is that according to the statistics of the
Doppler spread bandw idth shown in [4], the taps of a one-
stage FEQ should be adapted at a r ate comparable to that of
the synchronization system. This may cause interaction be-
tween both adaptive systems and their eventual divergence
[15].Hence,along-termFEQ(LFEQ) is firstly used to com-
pensate for the long-term changes in the channel response.
Since these changes occur at a rate much slower than the
symbol rate, the information needed for timing recovery is
taken from the output of this stage. Afterwards, a short-
term FEQ (SFEQ) follows the short-term variations of the
channel response with respec t to its long-term value. Since
channels considered in this work do not present long-term
changes, the LFEQ compensates for the time-average chan-
nel response over the mains cycle.
The timing recovery scheme follows the conventional
digital phase-locked loop (PLL) struc ture: an estimator of the
phase errors due to the uncorrected timing errors, a loop fil-
ter, and a numerically controlled oscillator (NCO).
3. CONVENTIONAL TIMING RECOVERY SCHEME
In a first instance, this section describes the conventional
timing recovery mechanism employed in DMT systems that
operate in LTI channels. To this end, the expressions of the
most common phase estimator and loop filter employed in
time-invariant channels are firstly presented. Afterwards, the
effect of the cyclic changes in the channel over the outputs
of the phase estimator and the loop filter is identified and
the performance of the overall timing recovery scheme is as-
sessed.
3.1. Description
The timing error in the signal r[n] (see Figure 4)variesfrom
sample to sample due to the uncorrected jitter and frequency
offset. Assuming an LTI channel a nd following a similar ap-
proach to the one in [6, 7], it can be shown that in the absence
of ISI, the expression of the mth input symbol to the receiver
DFT can be expressed as
1
r
m
[n] =
N
k=−(N−1)
H
k
X
m,k
e
j(π/N)k(n+τ
m
[n])
+ u
m
[n], (6)
where 0
≤ n ≤ 2N − 1, X
m,k
denotes the mth complex value
transmitted in carrier k, H
k
is the channel frequency response
1
For simplicity, the effect of the cyclic prefix is not considered because it
does not change the essence of the analysis.
Jos
´
e Antonio Cort
´
es et al. 5
for carrier k, τ
m
[n] is the uncorrected sampling error for the
nth sample of the mth symbol, and u
m
[n] is the channel noise
term.
The kth output of the DFT of r
m
[n] can then be expressed
as
R
m,k
=
1
2N
2N−1
n=0
r
m
[n]e
−j(π/N)kn
=
1
2N
2N−1
n=0
N
z=−(N−1)
H
z
X
m,z
e
j(π/N)(z−k)n
e
j(π/N)zτ
m
[n]
+
1
2N
2N−1
n=0
u
m
[n]e
−j(π/N)kn
=
1
2N
H
k
X
m,k
2N
−1
n=0
e
j(π/N)kτ
m
[n]
+
1
2N
N
z=−(N−1)
z/
=k
2N
−1
n=0
H
z
X
m,z
e
j(π/N)(z−k)n
e
j(π/N)zτ
m
[n]
+ U
m,k
,
(7)
and the kth output of the conventional one-tap FEQ, Y
m,k
,is
given by
Y
m,k
=
1
2N
X
m,k
2N
−1
n=0
e
j(π/N)kτ
m
[n]
+
1
2N
FEQ
k
N
z=−(N−1)
z/
=k
2N
−1
n=0
H
z
X
m,z
e
j(π/N)(z−k)n
e
j(π/N)zτ
m
[n]
+ U
m,k
FEQ
k
,
(8)
where FEQ
k
= H
−1
k
is the kth tap of a zero-forcing FEQ. The
first term in (8) is the desired symbol, which is attenuated
and phase shifted, the second term represents the ICI. Pro-
vided that the timing error variation along a DMT symbol is
small, the attenuation of the desired symbol and the ICI term
can be neglec ted. Hence, Y
m,k
can be approximated by
Y
m,k
≈ X
m,k
e
j(π/N)kθ
m
+ U
m,k
FEQ
k
,(9)
where θ
m
is the phase error caused by the timing errors which
occurred during the mth symbol,
θ
m
≈
1
2N
2N−1
n=0
τ
m
[n]. (10)
To verify the validity of the approximation in (9), the signal-
to-distortion ratio (SDR) at the detector input, defined as
SDR
k
=
E
X
m,k
2
E
X
m,k
− Y
m,k
2
, (11)
has been computed using the expression for Y
m,k
given in
(8) and the one in (9). For simplicity, a DMT system with
30
40
50
60
70
80
90
SDR (dB)
0 100 200 300 400 500
Carrier index (k)
Exact
Approximated
Figure 5: SDR values computed by taking into account the ICI and
the desired symbol attenuation (exact) or only the phase shift ( ap-
proximated).
512 carriers working in a noiseless flat channel and impaired
by an uncorrected sampling offset of 10 ppm is considered.
Results are depicted in Figure 5. As seen, the phase shift is
the dominating term in nearly all carriers. The difference be-
tween both curves is lower than 1.2 dB except for the low car-
riers region. However, it should be taken into account that
most of the carriers in this latter zone cannot be used be-
cause they fall within the reject band of the coupling circuit
used to protect the receiver from the mains. Moreover, all the
carriers in which the differencebetweenbothcurvesishigher
than 2 dB experience SDR values higher than 60 dB. Hence,
the channel noise, and not the ICI, will be the limiting term
in these carriers.
The phase detector can estimate θ
m
based on the de-
cided symbols (decision-directed) or using one or more pre-
defined carriers designated as pilots. Pilot-based schemes do
not seem to be appropriate for indoor power-line environ-
ments due to their larger variance and to the unknown po-
sition of the channel frequency response notches. Hence, the
former approach has been selected in this work. The maxi-
mum likelihood (ML) is probably the most widely employed
estimator for this purpose. Assuming correct decisions and
Gaussian noise, its expression can be approximated by [5]
θ
m
≈
N
π
k∈K
Im
Y
m,k
X
∗
m,k
k
FEQ
k
2
σ
2
U
k
k∈K
k
2
SNR
k
, (12)
where Im[
·] denotes the imaginary part,
X
∗
m,k
is the complex
conjugate of the detector output, SNR
k
is the signal-to-noise
ratio experienced by carrier k, K is the set of car rier indexes
utilized in the estimation, and σ
2
U
k
is the noise power in the
band of carrier k.
6 EURASIP Journal on Advances in Signal Processing
The output of the phase detector is fed to a loop filter,
whose transfer function
L(z)
= α +
β
1 − z
−1
(13)
is selected so that a second-order-type II PLL results [15].
The output of this filter is supplied to the NCO, which com-
putes the timing adjustment to be applied to each sample of
the next received sy mbol.
In order to analyze the performance of the ML estimator
calculated according to (12) in an LPTV channel with cyclo-
stationary noise, it is convenient to express the symbol index,
m in terms of the channel and noise IPSD p eriod. Denoting
L
= T
0
/T
DMT
,whereT
DMT
is the DMT symbol period and T
0
is the mains period, m = cL + , where 0 ≤ ≤ L −1andc is
the cycle index. Assuming that the slow-variation approach
holds [4], the output of the LFEQ at the frequency of carrier
k during the th interval of the cth cycle Y
c
,k
can be expressed
as
Y
c
,k
≈ X
c
,k
H
,k
e
jH
,k
e
j(π/N)kθ
c
LFEQ
k
+ U
c
,k
LFEQ
k
, (14)
where H
,k
denotes the frequency response of the channel at
the frequency of carrier k during the th symbol and U
c
,k
is the noise value in carrier k at the output of the th DFT
performed in the cth cycle.
Since the LFEQ only compensates for the time-averaged
value of the frequency response, LFEQ
k
=H
,k
−1
,where
· denotes averaging over the variable , the output of the
phase detector in (7) would be misled by the cyclic changes
of the channel.
3.2. Performance
This subsection analyzes the performance of the above syn-
chronization scheme when employed over the 24 measured
channels. Qualitative results over the example channel shown
in Figures 1 and 2 are firstly presented. Throughout the
work, the following system parameters apply unless other-
wise stated. A DMT with 512 carriers distributed in the fre-
quency band up to 25 MHz is employed. However, only car-
riers with indexes 22
≤ k ≤ 409, that is, in the band from
approximately 1 MHz to 20 MHz, are finally used. The sam-
pling frequency is fixed to 1/T
s
= 100 MHz. The cyclic prefix
length cp has been fixed to 226 samples a t 1/(2T
s
), which en-
sures that the power of ISI and ICI due to the spectral distor-
tion of the channel will be much lower than the channel noise
level. This cyclic prefix length also makes T
0
/T
DMT
an inte-
ger value, which simplifies the subsequent analysis. An ideal
equalization is accomplished, that is, the LFEQ and SFEQ are
provided with the actual frequency response values. The bit-
loading process is performed with the objective of maximiz-
ing the bit-rate subject to an instantaneous bit error prob-
ability of P
e
= 10
−5
and a transmitter PSD constraint of
−20 dBm/kHz. BPSK and square QAM constellations with
a maximum of 16 bits/symbol are employed. A system mar-
gin of 6 dB is employed. The loop filter is configured for the
overall PLL response to be cr itically dumped.
18
19
20
21
22
23
24
×10
−6
Loop filter output
500 1000 1500 2000 2500 3000
Symbol index
Figure 6: Loop filter output in the channel of Figures 1 and 2 for a
frequency error of 20 ppm.
Figure 6 shows the loop filter output when the only non-
ideal effect introduced by the ADC is a frequency offset of
20 ppm. The equivalent noise bandwidth of the loop is set to
510 Hz. As seen, periodical components caused by the LPTV
nature of the channel are manifest at the filter output. They
can be diminished by reducing the loop bandwidth. How-
ever, this leads to longer convergence times and, therefore, to
a reduction in the capacity of the loop to follow timing fluc-
tuations like the ones shown in Figure 3.
To illustrate the reduced tracking capacity of narrowband
loops, Figure 7 depicts the loop output for a 3 Hz sinusoidal
input jitter. An LTI channel has been used. As shown, there
are no significant amplitude differences for the three consid-
ered bandwidths. Moreover, for 10 Hz and 30 Hz, the out-
put amplitude is even greater than for 125 Hz due to the un-
avoidable peaking that appears in the frequency response of
a critically dumped second-order-type II PLL [15]. On the
other hand, it is worth noting the remarkably delay incre-
ment that occurs for 10 Hz. When the loop bandwidth is
large, the group delay is high in frequencies, where the S
φ
o
( f )
of an actual jitter is very small. As the loop bandwidth is re-
duced, the delay becomes larger in the low frequency region,
where the jitter has its most significant components.
Performance of the timing recovery procedure is char-
acterized in terms of the SDR at the detector input and the
achievable bit-rate. For small timing errors, the SDR expe-
rienced by carrier k in the th interval of each cycle can be
expressed as
SDR
,k
=
E
X
c
,k
2
E
X
c
,k
− X
c
,k
e
j(π/N)kθ
c
2
=
1
E
1 − e
j(π/N)kθ
c
2
.
(15)
Estimated values of the SDR experienced by the last used car-
rier (k
= 409) in the example channel as a function of the
Jos
´
e Antonio Cort
´
es et al. 7
−3
−2
−1
0
1
2
3
×10
−7
Loop filter output
0.51 1.522.53
×10
4
Symbol index
BW
= 125 Hz
BW
= 30 Hz
BW
= 10 Hz
Figure 7: Loop filter output for a 3 Hz sinusoidal input jitter in an
LTI channel.
35
40
45
50
55
60
Averaged SDR (dB)
0 25 50 75 100 125 150 175 200 225 250
BW (Hz)
σ
o
= 5ps
σ
o
= 10 ps
σ
o
= 20 ps
No jitter
LPTV channel
20 ps jitter
LTI channel
Figure 8: SDR in the last used carrier in different situations.
loop bandwidth have been obtained by means of simulations.
Results obtained with the ADC jitters depicted in Figure 3
are shown in Figure 8. Although curves are labelled accord-
ing to the oscillator integrated jitter values, a 5 picosecond
aperture jitter is also included in all cases. No frequency offset
exists. Two additional curves have been depicted to hig hlight
the individual effect of the channel cyclic variations and the
ADC jitter in the system performance. One of them shows
the SDR values obtained when the 20 picosecond oscillator is
employed in an LTI channel obtained by means of a time av-
eraging of the LPTV one displayed in Figure 1. T he other de-
80
100
120
140
160
180
Bit rate (Mbit/s)
0 25 50 75 100 125 150 175 200 225 250
BW (Hz)
σ
o
= 5ps
σ
o
= 10 ps
σ
o
= 20 ps
Adaptive
Fixed
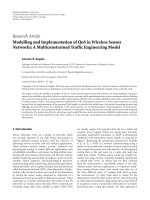
Figure 9: Bit-rates estimated from SNDR values and a lookup table.
picts the SDR values obtained when the time-variant channel
shown in Figures 1 and 2 is employed but no jitter is intro-
duced in the ADC process.
Curves in Figure 8 illustrate a clear tradeoff in the selec-
tion of the loop bandwidth. For larger loop bandwidths, the
SDR is low because phase error estimates are strongly misled
by the cyclic short-term variations of the frequency response
(the cyclostationar y noise has much less influence). As the
loop bandwidth is reduced, the SDR increases because chan-
nel time variations are attenuated. This process continues
until the loop is not able to follow the ADC jitter. From this
point on, distortion caused by this phenomenon becomes the
dominating term and the SDR degrades very fast.
The ultimate system performance parameter is the
achievable bit-rate. However, its exact computation under
the considered circumstances is a difficult task. Moreover,
values calculated in this way may not reflect the bit-rate at-
tained by an actual system. A practical procedure to deter-
mine the bit load of each carrier in a real receiver would esti-
mate the signal-to-noise-and-distortion ratio (SNDR). Ac-
cording to the usual assumption of an additive Gaussian
noise and distortion, the most appropriate constellation for
each carrier is obtained by means of a predefined lookup ta-
ble. Figure 9 depicts the bit-rate values obtained with this
procedure in the example channel. Two different modulation
strategies have been considered: fixed and adaptive. In the
fixed one, the same constellation is employed in each carrier
throughout the mains period, while in the adaptive one it is
adjusted according to the instantaneous conditions to make
the most of the periodically varying behavior of the channel.
It can be observed that differences between the bit-rates
shown in Figure 9 experience a considerably increment when
the loop bandwidth is enlarged. For instance, when the
5 picosecond case is considered, the bit-rate gain obtained
with the adaptive system for a 19 Hz bandwidth is about 16%
8 EURASIP Journal on Advances in Signal Processing
greater than the one provided by a fixed scheme. When a
160 Hz bandwidth is employed, this gain goes up to about
45%. The reason is that the wider the loop bandwidth is, the
larger the magnitude of the channel time variations at the
output of the phase detector is, and consequently the greater
the dispersion in SDR values is. Figure 9 also shows the great
sensitivity of the bit-rate with respect to the bandwidth, es-
pecially in the jitter-limited region. Thus, a small bandwidth
reduction over the optimum values for the 5 picosecond case
may reduce the performance of both the adaptive and the
nonadaptive systems, to nearly the ones of the 20 picosecond
case. Hence, the investment in a better oscillator is not always
productive.
So far, qualitative effects of the jitter and short-time vari-
ations in the timing recovery mechanism have been pre-
sented. Statistical values of the performance degradation
computed over the 24 channels referred to in Section 2.1
are now given. To this end, the bit-rate loss experienced in
both scenarios with each oscillator and modulation strategy
is computed. Bit-rates obtained in each channel under per-
fect synchronization conditions are taken as reference for the
comparison. The bandwidth employed in all the channels
is fixed for each modulation strategy and oscillator. These
bandwidths values are computed by averaging the optimum
bandwidths of all the channels in the selected configuration.
Results are shown in Table 1. As seen, considerable perfor-
mance degradation occurs in the apartment channels, espe-
cially when the constellation remains fixed throughout the
mains cycle. Bit-rate losses are smaller in the detached house
due to the inherently worse characteristics of these channels,
which are established over longer and more branched links
than in the apartment.
Exact values of the performance degradation depend on
the set of available constellations, the objective bit error
probability, and the system margin [8]. However, the only
way to reduce the remarkable bit-rate losses experienced in
the apartment channels is to modify the timing recover y
scheme.
4. PROPOSED TIMING RECOVERY SCHEME
The conventional synchronization scheme admits two direct
improvements when used in indoor power-line scenarios.
Firstly, the phase detector can be matched to the particulari-
ties of the problem. This can be accomplished by taking into
account the magnitude of the channel time variations before
combining the estimates of the phase error obtained in the
different carriers. Secondly, the loop filter can be modified to
achieve higher attenuation at the harmonics of the mains fre-
quency. This could be done by means of a higher-order loop.
However, due to the periodical nature of the estimation bias,
the introduction of n otch filters is a more suitable solution.
4.1. Proposed phase error estimator
Since the probability density function of the channel short-
term variations is not precisely known, a weighted least-
squares (LS) estimator is proposed. Let us denote by φ
c
,k
the
Table 1: Average bit-rate loss (%) in each scenario when the opti-
mum loop bandwidth (on average) is employed in all the channels.
Scenario σ
o
= 20 ps σ
o
= 10 ps σ
o
= 5ps
Apartment (adaptive) 13.9 10.9 8.4
Apartment (fixed)
22.9 20.4 17.5
Detached house (adaptive)
3.2 2.1 1.3
Detached house (fixed)
6.6 5.3 4.2
phase error measured in carrier k during the th symbol of
the cth cycle, computed according to
φ
c
,k
= tan
−1
Im
Y
c
,k
X
c
∗
,k
Re
Y
c
,k
X
c
∗
,k
=
π
N
kθ
c
+
H
,k
+ ϕ
c
,k
, (16)
where
X
c
,k
is the th decided symbol of the cth cycle in carrier
k, Y
c
,k
is the output value of the LFEQ given in (14), ϕ
c
,k
is the
phase noise due to the additive channel noise U
c
,k
,andwhose
power can be approximated by σ
2
ϕ
,k
≈ 1/(2SNR
,k
), provided
that SNR
,k
1[16].
H
,k
is the difference between the
channel phase and the LFEQ phase experienced by the th
received symbol in carrier k.
TheweightedLSestimatorofθ
c
is selected according to
θ
c
= arg min
θ
c
k∈K
φ
c
,k
− (π/N)k
θ
c
2
H
2
,k
+ σ
2
ϕ
,k
=
N
π
k∈K
kφ
c
,k
/
H
2
,k
+ σ
2
ϕ
,k
k∈K
k
2
/
H
2
,k
+ σ
2
ϕ
,k
.
(17)
The selection of the carriers to be employed in the phase es-
timation is a difficult task, as the mean-squared error (MSE)
in (18)reveals
MSE
c
= E
θ
c
− θ
c
2
=
(N/π)
2
k∈K
(k
2
/
H
2
,k
+ σ
2
ϕ
,k
2
×
k∈K
k
H
,k
H
2
,k
+ σ
2
ϕ
,k
2
+
k∈K
k
2
σ
2
ϕ
,k
H
2
,k
+ σ
2
ϕ
,k
+2θ
c
k∈K
k
H
,k
H
2
,k
+ σ
2
ϕ
,k
×
k∈K
k
2
H
2
,k
+ σ
2
ϕ
,k
.
(18)
The influence of the channel phase variations and the noise
in ( 18) is evident. However, the first and second terms in
the square bracket also highlight the impor t ance of the car-
rier index, since a given channel variation is more harmful in
carriers with higher indexes. Similarly, the third term shows
that the estimation error depends on the magnitude to be es-
timated, θ
c
, which, in turns is also determined by the loop
response.
The computation of (17) involves two main difficulties.
Firstly, it requires K + 1 divisions, or alternatively the stor-
age of the L
· K values of (
H
2
,k
+ σ
2
ϕ
,k
)
−1
. This excessively
Jos
´
e Antonio Cort
´
es et al. 9
34
36
38
40
42
44
46
48
50
52
SDR (dB)
0 25 50 75 100 125 150 175 200 225 250
BW (Hz)
LS estimator
Modified LS
Conv entional
Figure 10: SDR values of the proposed and conventional phase er-
ror estimators.
high complexity can be reduced by replacing the instanta-
neous values of
H
2
,k
+ σ
2
ϕ
,k
by their time-averaged values.
Secondly, these time-averaged values are stil l unknown and
must be estimated. In this work, an exponential averaging of
φ
c
,k
is employed to perform the estimation. The resulting LS
estimator will b e referred to as modified LS from now on.
Figure 10 compares the SDR values experienced by the last
carrier in the example channel when using the LS estimator
in (17) and the modified LS. The conventional estimator in
(12) is included as a reference. A 20 picosecond oscillator jit-
ter is used in all cases. As expected, there are no SDR differ-
ences in the region in which distortion is limited by the jitter.
On the contrary, the proposed estimators provide consider-
able gains in the region where the channel variations limit the
performance. In addition, it is worth noting that the SDR be-
comes less sensitive to the loop bandwidth. The steady-state
computational load of the modified LS estimator is equal to
that of the conventional one and, as shown in Figure 10,it
performs less than 2 dB worse than the LS in a quite wide re-
gion. Therefore, it has been selected for the subsequent anal-
ysis.
4.2. Proposed loop filter
The modified LS estimator has considerably reduced the
magnitude of the channel variations in the phase detector
output. Additional attenuations can be introduced before
supplying the interpolator with the timing adjustment val-
ues. Two equivalent methods can b e employed to achieve
this objective. The first one is to estimate the most impor-
tant harmonics of phase error signal, for example, by means
of the Goertzel algorithm, and to cancel them before enter-
ing the NCO. The second one is to eliminate these harmonics
by placing notch filters in the loop. Both strategies offer equal
35
40
45
50
55
60
SDR (dB)
0 10 20 30 40 50 60 70 80 90 100 110 120 130
BW (Hz)
M
= 3
M
= 2
M
= 1
M
= 0
Figure 11: SDR obtained with the modified LS estimator for several
numbers of notch filters.
performance, but due to the easier stability analysis, the latter
one has been selected.
The modified loop filter is given by
L(z)
=
α +
β
1 − z
−1
M
i=1
H
i
(z), (19)
where H
i
(z) are the transfer functions of notch filters ob-
tained by applying the bilinear transform to the continuous-
time second-order prototypes
H
i
(s) =
s
2
+ ω
2
z,i
s
2
+2ξ
i
ω
0,i
s + ω
2
0,i
, (20)
with ω
z,i
= 100πi. Up to three notch filters (M = 3) are em-
ployed in this study. Filter parameters have been heuristically
selected to minimize the unavoidable resonance that appears
in the passband and to achieve narrowband notches. As a re-
sult, ξ
i
is fixed to 0.1 in all filters and ω
0,i
= ω
z,i
k(α), where
k(α)
=
⎧
⎪
⎪
⎨
⎪
⎪
⎩
1, 0 <α≤ 4 · 10
−3
,
√
1.1, 4 · 10
−3
<α≤ 6 · 10
−3
,
√
1.2, 6 · 10
−3
<α≤ 10
−2
.
(21)
The introduction of the notch filters considerably reduces
the stability range of the overall loop filter. By means of the
Nichols chart [12] of the overall loop frequency response, it
has been determined that for M
= 3, the loop is stable only
for 0 <α<21.5
·10
−3
.However,forα>10
−2
(BW > 130 Hz)
the enormous growing experienced by the resonances in the
passband invalidates the resulting frequency response.
Performance obtained with the modified loop is firstly
assessed in terms of the SDR. Figure 11 depicts the SDR val-
ues experienced by the last car rier in the example channel for
10 EURASIP Journal on Advances in Signal Processing
different values of M and a 20 picosecond oscillator jitter. The
conventional loop, M
= 0, has been included as a reference.
As observed, gains obtained by using just one notch filter are
rather small, while considerable improvement is obtained for
M
= 2. This is due to the 100 Hz periodicity exhibited by the
example channel. It is worth noting that the introduction of
the notch filters eases the selection of the loop bandwidth,
since the SDR is monotonically increasing for M
≥ 2inthe
selected range. Althoug h not shown in Figure 11, small gains
are obtained for M>3, specially in the apartment channel,
in which more than 90% of the system carriers experience
less than 150 Hz of Doppler spread [4].
Bit-rates corresponding to M
= 3 and different oscillator
jitters are shown in Figure 12.Valueshavebeencomputedus-
ing the SNDR and a lookup table. The new timing recovery
scheme provides remarkable gains with respect to the con-
ventional one (see Figure 9). The maximum bit-rate values
obtained with the new s ystem are, at least, 13% higher than
those obtained with the latter. This gain goes up to 24.5%
when the oscillator jitter is 20 picoseconds and a fixed modu-
lation strategy is employed. In addition, the bandwidth selec-
tion problem is now easier, since performance is less sensitive
to this parameter.
Statistical values of the bit-rate loss computed over the 24
measured channels are now given. The procedure employed
for the calculation is analogous to the one employed with the
conventional timing recovery scheme. Results are shown in
Tab le 2. As observed, performance degr adation is consider-
ably reduced in the apartment channels, especially when an
adaptive modulation strategy is used, and is practically elimi-
nated in the detached house ones. These significant improve-
ments are particularly interesting when the reduced incre-
ment in the computational load is taken into account. Thus,
the steady-state complexity of the modified LS estimator is
equivalent to that of the conventional one, and the six-order
filtering of the modified loop is performed only at symbol
rate.
5. CONCLUSIONS
In this paper, the performance of a conventional DMT timing
recovery scheme designed for LTI channels has been assessed
when employed over indoor power lines.
The two main causes that limit the performance of the
conventional strategy have been identified. One is the peri-
odical bias introduced by the channel time variations in the
phase error estimates. The other is the timing jitter intro-
duced in the analog-to-digital conversion process. The lat-
ter, which is neglected in most studies, has revealed to be of
particular importance in this case. It has been shown that
optimal parameterization of the conventional scheme results
from the tradeoff between attenuation of the cyclic bias and
tracking capacity of the loop. Simulations carried out in a set
of measured channels have demonstrated that this synchro-
nization scheme limits the system bit-rate in many residential
channels.
Twomodificationshavebeenproposedtoovercome
these shortcomings. The first is a new phase error estimator
that takes into account the magnitude of the cyclic changes
140
150
160
170
180
190
200
210
Bit rate (Mbit/s)
0 10 20 30 40 50 60 70 80 90 100 110 120 130
BW (Hz)
σ
o
= 5ps
σ
o
= 10 ps
σ
o
= 20 ps
Adaptive
Fixed
Figure 12: Bit-rate values obtained with the modified LS estimator
and M
= 3.
Table 2: Average bit-rate loss (%) in each scenario w ith the modi-
fied LS estimator and M
= 3 when using the optimum loop band-
width (on average).
Scenario σ
o
= 20 ps σ
o
= 10 ps σ
o
= 5ps
Apartment (adaptive) 1.9 1.1 0.6
Apartment (fixed)
4.6 3.7 3.6
Detached house (adaptive)
0.1 0.1 < 0.05
Detached house (fixed)
0.1 0.1 < 0.05
in the channel response. The second is the int roduction of
notch filters in the loop. This allows to reduce the periodi-
cal errors in the timing correction signal while retaining the
loop ability to follow the jitter. Simulations confirm that per-
formance degradation caused by the proposed scheme is neg-
ligible in most situations.
ACKNOWLEDGMENT
This work has been supported in part by the Spanish Min-
istry of Educaci
´
on y Ciencia under CICYT Project no.
TIC2003-06842.
REFERENCES
[1] TS 101 867 V1.1.1, “Powerline Telecommunications (PLT);
Coexistence of Access and In-House Powerline Systems,” ETSI
2000.
[2] H. Philipps, “Performance measurements of power-line chan-
nels at high frequencies,” in Proceedings of International Sym-
posium on Power-Line Communications and Its Applications
(ISPLCA ’98), pp. 229–237, Tokyo, Japan, March 1998.
[3]F.J.Ca
˜
nete,J.A.Cort
´
es, L. D
´
ıez, and J. T. Entrambasaguas,
“Modeling and evaluation of the indoor power line transmis-
sion medium,” IEEE Communications Magazine,vol.41,no.4,
pp. 41–47, 2003.
Jos
´
e Antonio Cort
´
es et al. 11
[4] F.J.Ca
˜
nete, J. A. Cort
´
es,L.D
´
ıez, and J. T. Entrambasaguas,
“Analysis of the cyclic short-term variation of indoor power
line channels,” IEEE Journal on Selected Areas in Communica-
tions, vol. 24, no. 7, pp. 1327–1338, 2006.
[5] T. Pollet and M. Peeters, “Synchronization with DMT mod-
ulation,” IEEE Communications Magazine,vol.37,no.4,pp.
80–86, 1999.
[6] T.N.ZogakisandJ.M.Cioffi,“Theeffect of timing jitter on
the performance of a discrete multitone system,” IEEE Trans-
actions on Communications, vol. 44, no. 7, pp. 799–808, 1996.
[7] E. Martos, J. L
´
opez,L.D
´
ıez, M. C. Aguayo, and J. T. Entram-
basaguas, “Optimized interpolator filters for timing error cor-
rection in DMT systems for xDSL applications,” IEEE Journal
on Selected Areas in Communications, vol. 19, no. 12, pp. 2477–
2485, 2001.
[8] J. A. Cort
´
es,L.D
´
ıez,E.Martos,F.J.Ca
˜
nete, and J. T. En-
trambasaguas, “Analysis of timing recovery schemes for DMT
systems over indoor power-line channels,” in Proceedings of
the 49th Annual IEEE Global Telecommunications Conference
(GLOBECOM ’06), San Francisco, Calif, USA, November-
December 2006.
[9] T. Pollet, M. Van Bladel, and M. Moeneclaey, “BER sensitivity
of OFDM systems to carrier frequency offset and Wiener phase
noise,” IEEE Transactions on Communications, vol. 43, no. 2–4,
pp. 191–193, 1995.
[10] R. H. Walden, “Analog-to-digital converter survey and analy-
sis,” IEEE Journal on Selected Areas in Communications, vol. 17,
no. 4, pp. 539–550, 1999.
[11] H. Kopmann, “A generalised parametric error model of ultra-
wideband analogue-to-digital conversion,” in Proceedings of
the3rdKarlsruheWorkshoponSoftwareRadios, pp. 101–110,
Karlsruhe, Germany, March 2004.
[12] F. M. Gardner, Phaselock Techniques, John Wiley & Sons, New
York, NY, USA, 3rd edition, 2005.
[13] IEEE 1139-1999, “Standard Definitions of Physical Quantities
for Fundamental Frequency and Time Metrology-Random In-
stabilities,” IEEE 1999.
[14] A. Demir, A. Mehrotra, and J. Roychowdhury, “Phase noise
in oscillators: a unifying theory and numerical methods for
characterization,” IEEE Transactions on Circuits and Systems I:
Fundamental Theory and Applications, vol. 47, no. 5, pp. 655–
674, 2000.
[15] E. A. Lee and D. G. Messerschmitt, Digital Communication,
Kluwer Academic Publishers, Norwell, Mass, USA, 2nd edi-
tion, 1994.
[16] J. G. Proakis and M. Salehi, Communication Systems Engineer-
ing, Prentice-Hall, Upper Saddle River, NJ, USA, 1994.
Jos
´
e Antonio Cort
´
es received the M.S.
degree in telecommunication engineering
from the University of M
´
alaga (Spain) in
1998. In 1998, he received a fellowship
from the R&D Department of Alcatel Citesa
(M
´
alaga). In 1999, he worked for Alcatel
Espa
˜
na R&D department (Madrid). At the
same year, he joined the Communication
Engineering Department of the University
of M
´
alaga, where he is currently working to-
wards the Ph.D. degree. From 2000 to 2002, he collaborated with
the Nokia System Competence Team in M
´
alaga. His research inter-
ests include digital signal processing for communications, mainly
focusing on synchronization and transmission techniques for high-
speed power-line communications.
Luis D
´
ıez received the M.S. and Ph.D. de-
grees from the Polytechnic University of
Madrid, Spain, in 1989 and 1995, respec-
tively, both in telecommunications engi-
neering. In 1984, he joined Fujitsu-Espa
˜
na
R&D Center, where he worked in the de-
velopment of modems. From 1987 to 1997,
he was with the Department of Signals, Sys-
tems and Radiocommunication, Polytech-
nic University of Madrid. Since 1997, he has
been with the Communication Engineering Department, Univer-
sity of M
´
alaga. His research interests include digital communica-
tion, a field in which he has worked for many years. His experience
includes most of its applications, that is, voice band, DSL and cable
modems, satellite, mobile, and power-line communications, and so
forth, as well as technical aspects, that is, synchronization, adaptive
signal processing, modulation, coding, and multiple access.
Eduardo Martos received the M.S. and
Ph.D. degrees in telecommunication engi-
neering in 1996 and 2005, respectively, from
the University of M
´
alaga (Spain). In 1997
he joined the Communication Engineer-
ing Department, at University of M
´
alaga,
where he is currently an Associate Professor.
His research activity includes digital signal
processing for communications, primarily
synchronization and channel estimation for
PLC and xDSL systems, and performance analysis of wireless
MIMO systems.
Francisco Javier Ca
˜
nete received the M.S.
and Ph.D. degrees in telecommunication
engineering in 1996 and 2004, respectively,
from the University of M
´
alaga (Spain). In
1996, he worked for the Instrument and
Control Department at the Empresa Na-
cional de Ingenier
´
ıa y Tecnolog
´
ıa (INITEC)
in the design of power plants. In 1997, He
worked for Alcatel Espa
˜
na R&D department
in the desig n of wireless local loop systems.
Since 1998, he has worked for the Communication Engineering
Department, University of M
´
alaga. From 2000 to 2001, he also col-
laborated with the Nokia System Competence Team in M
´
alaga. His
research activity is focused on digital signal processing for digital
communications and his interests include channel modeling and
transmission techniques for wireless systems and power-line com-
munication systems.
Jos
´
eTom
´
as Entrambasaguas received the
M.S. and Ph.D. deg rees in 1975 and 1990,
respectively, both from the Polytechnic Uni-
versity of Madrid, Spain. From 1975 to
1978, he worked at the Polytechnic Univer-
sity of Madrid. In 1978, he joined Fujitsu-
Espa
˜
na R&D Center, where he worked in
the development of packet switching sys-
tems for data networks (in collaboration
with Telef
´
onica de Espa
˜
na), data transmis-
sion systems, and computer local area networks. In 1993, he joined
the University of M
´
alaga at the Communication Engineering De-
partment, where his current interests include digital signal process-
ing techniques applied to digital communication and methodolo-
gies for efficient and integrated development of complex commu-
nications systems.