Báo cáo hóa học: " Research Article Better Flow Estimation from Color Images ¨ Hui Ji1 and Cornelia Fermuller2" docx
Bạn đang xem bản rút gọn của tài liệu. Xem và tải ngay bản đầy đủ của tài liệu tại đây (1.53 MB, 9 trang )
Hindawi Publishing Corporation
EURASIP Journal on Advances in Signal Processing
Volume 2007, Article ID 53912, 9 pages
doi:10.1155/2007/53912
Research Article
Better Flow Estimation from Color Images
Hui Ji
1
and Cornelia Ferm
¨
uller
2
1
Department of Mathematics, National University of Singapore, Singapore 117543
2
Computer Vision Laboratory, Institute for Advanced Computer Studies, University of Maryland, College Park, MD 20742-3275, USA
Received 1 October 2006; Accepted 20 March 2007
Recommended by Nicola Mastronardi
One of the difficulties in estimating optical flow is bias. Correcting the bias using the classical techniques is very difficult. The
reason is that knowledge of the error statistics is required, which usually cannot be obtained because of lack of data. In this pa-
per, we present an approach which utilizes color information. Color images do not provide more geometric information than
monochromatic images to the estimation of optic flow. They do, however, contain additional statistical information. By utilizing
the technique of instrumental variables, bias from multiple noise sources can be robustly corrected without computing the param-
eters of the noise distribution. Experiments on synthesized and real data demonstrate the efficiency of the algorithm.
Copyright © 2007 H. Ji and C. Ferm
¨
uller. This is an open access article distributed under the Creative Commons Attribution
License, which permits unrestricted use, distribution, and reproduction in any medium, provided the original work is properly
cited.
1. INTRODUCTION
Optical flow estimation is a heavily studied problem in com-
puter vision. It is well known that the problem is difficult
because of the discontinuities in the scene. However, even at
the locations of smooth scene patches, the flow cannot be es-
timated very accurately because of statistical difficulties.
In this paper, we consider gradient-based approaches to
optical flow estimation. The estimation is based on the basic
constraint of constant brightness at an image point over a
small time interval. This can be expressed as follows [1]:
I
x
u
x
+ I
y
u
y
+ I
t
= 0, (1)
where I
x
, I
y
, I
t
denote the spatial and temporal derivatives
of the image intensity function I,and
u
= (u
x
, u
y
)denotes
the velocity vector at an image point. This equation, known
as the brightness consistency constraint, only gives one com-
ponent of the optical flow vector
u
= (u
x
, u
y
). To obtain the
second component, further assumptions on the optical flow
need to be imposed. Common nonparametric constraints
are obtained by assuming that the flow field is smooth lo-
cally (see [2] for a comprehensive survey). Other approaches
assume a parametric model for the optical flow. Regard-
less of the strategy adopted, one usually arrives at an over-
determined linear equation system of the form
A
x
=
b,(2)
where
x denotes the parameter vector char acterizing the op-
tical flow, and A and
b are the measurements. For example,
for the model of constant flow in a spatial neighborhood, as-
suming we combine n image brightness constraint equations,
A becomes the n
× 2matrix(I
x
i
, I
y
i
),
b is the n-dimensional
vector (
−I
t
i
), and
x is just the two-dimensional optical flow
u
= (u
x
, u
y
). If the model assumes the flow to be a polyno-
mial function in the image coordinates, then the flow com-
ponents u
x
and u
y
are linear with respect to some k × 1pa-
rameter vector
x. In other words,
u
x
=
f
i
t
x,
u
y
=
g
i
t
x,
(3)
where
f
i
,
g
i
are k × 1 vectors of image coordinates. For ex-
ample, if the scene patch in view is a plane, the flow model
amounts to
f
i
=
x
i
, y
i
, −1, 0, 0, 0, x
2
i
, x
i
y
i
t
,
g
i
=
0, 0, 0, x
i
, y
i
, −1, x
i
y
i
, y
2
i
t
.
(4)
A is composed of the spatial image gradients and image
coordinates,
b still encodes the temporal derivatives, and
x
are the coefficients of the polynomial.
The most common approach to estimating the parame-
ter vector
x is by means of least squares (LS) regression. How-
ever, LS implicitly makes the assumption that the explanatory
2 EURASIP Journal on Advances in Signal Processing
variables, that is the elements of A in (1), are measured with-
out errors. This is not true, because the spatial derivatives I
x
,
I
y
are always noisy. Thus, we are dealing with what is called
the errors-in-variables (EIV ) noise model in Statistics. LS es-
timation on this model can be shown to be inconsistent, and
the bias leads to underestimation.
The bias in the LS estimation of optical flow has been
observed before (see [3, 4]), and alternative estimators have
been proposed. In particular, total least squares estimation
(TLS) has received significant attention. A straightforward
approach of TLS is problematic, as TLS assumes the noise
components in the spatial and temporal derivatives to be
pixel-wise independent. References [3, 5] a ddressed the cor-
relation of the image derivatives between pixels using a
maximum-likelihood (MLE) estimator. Reference [6]devel-
oped the so-called heteroscedastic errors-in-variable (HEIV)
estimator. In essence, both approaches are modifications of
TLS estimation to account for the underlying noise pro-
cesses with pixel-wise dependence and nonhomogeneous co-
variance. The tradeoff for dealing with these dependences is
higher complexity and less stability in the resulting proce-
dures. Further m ore, the corresponding objective functions
are nonlinear and nonconvex, which makes the minimiza-
tion a difficult task.
Most studies of optical flow utilize gray-scale image se-
quences, but color image sequences have been used as well
(see [7, 8]). A common approach to utilizing the color is
to incorporate more constraints into the optical flow com-
putation. Essentially, one color sequence provides three im-
age sequences. Another approach is to substitute the bright-
ness consistency constraint by a color consistency constraint
to obtain equations with higher accuracy. However, previous
studies did not consider noise in the color images, or extract-
ing statistical information from color.
Three color channels do not contain more information
than one mono-chromatic channel from a geometric point of
view. They do, however, contain statistical information. Here
we use this color information to correct for the bias in opti-
cal fl ow. The approach is based on the so-called instrumen-
tal variable (IV) estimator, which has several advantages over
other estimators. Most important, it does not require an esti-
mation of the error, and it can handle multiple heteroscedas-
tic noise terms. Furthermore, its computational complexity
is comparable to LS.
After giving a brief introduction to the EIV model and
LS and TLS regression in Section 2, we discuss the sources
of noise in Section 3. Then in Section 4 we present our IV
method on color image sequences. Section 5 compares the
performance of our IV method against LS and TLS estima-
tion, and Section 6 concludes the paper.
2. THE ERROR MODEL AND COMMON ESTIMATORS
The problem of estimating optical flow from the brightness
consistency constraints amounts to finding the “best” so-
lution to an over-determined equation system of the form
A
x
=
b. The observations A and
b are always corrupted by
errors, and in addition there is system error. We are dealing
with what is called the errors-in-variable (EIV) model in sta-
tistical regression, which is defined as follows [9].
Definition 1 (error-in-variables model).
b
= A
x
+
,with
b
∈ R
n
, A
∈ R
n×k
,
b
=
b
+
δ
b
,
A
= A
+ δ
A
.
(5)
x
are the true but unknown parameters. A = (A
i, j
)and
b
= (b
i
) are observations of the true but unknown values
A
and
b
. δ
A
= (δ
A
i,j
)and
δ
b
= (δ
b
j
) are the measurement
errors and
= (
i
) is the system error, also called equation
error or modeling error. This is the error due to the model
assumptions.
In the following discussion, we consider δ
A
i,j
, δ
b
i
,and
i
to be independent and identically distributed random vari-
ables with zero mean and variances σ
2
A
, σ
2
b
,andσ
2
,respec-
tively.
The most popular choice to solving the system is by
means of least squares (LS) estimation which is defined as
x
LS
=
A
t
A
−1
A
t
b
. (6)
However, it is well known that the LS estimator
x
LS
is gener-
ally biased [10]. Consider the simple case where al l elements
in δ
A
and
δ
b
are independent and identically distributed ran-
dom variables with zero mean and variance σ
2
. Then we have
lim
n→∞
E
x
LS
−
x
=−σ
2
lim
n→∞
1
n
A
t
A
−1
x
,(7)
which implies that
x
LS
is asymptotically biased. Large vari-
ance in δ
A
, an ill-conditioned A,oran
x which is oriented
close to the eigenvector of the smallest singular value of A
all could increase the bias and push the LS solution
x
LS
away
from the real solution. Generally, it leads to an underestima-
tion of the parameters.
The so-called corrected least squares (CLS) estimator
theoretically could correct the bias. Assume σ, the variance
of the error, to be known a priori. Then the CLS estimator
for
x,whichisdefinedas
x
CLS
=
A
t
A − nσ
2
I
−1
A
t
b
,(8)
gives asymptotically unbiased estimation. This estimator is
also known as correction for attenuation in Statistics. The
problem is that accurate estimation of the variance of the
error is a challenging task. Since the scale of the error vari-
ance is difficult to obtain in practice, this estimator is not
very popular in computer vision.
Since the exact error variance is hard to obtain, the so-
called total least squares (TLS) or orthogonal least squares
H. Ji and C. Ferm
¨
uller 3
estimator, which only requires the estimation of the ratio η =
(σ
2
b
+ σ
2
)/(σ
2
A
), became popular. It can be formulated as the
following nonlinear minimization:
x
TLS
= arg
x
min M(
x, η) = arg
x
min
i
1
n
A
i
x
− b
i
2
x
2
+ η
.
(9)
The vector (η
−1/2
x
TLS
; −1) is the singular vector correspond-
ing to the smallest singular value of the SVD of the ma-
trix [A, η
−1/2
b]. If the errors δ
A
,
δ
b
are independent and
identically distributed, or if we can obtain the ratio η
=
(σ
2
b
+ σ
2
)/σ
2
A
, then TLS estimation is asymptotically unbi-
ased. However, the main problem for TLS is system error,
that is
. One may simply merge the equation error
i
with
the measurement error b
i
into a new error variable, as it is
done in least squares estimation. But this affects the estima-
tion. System error is due to the fact that our model is only
some approximation of the underlying real model. We can
have multiple tests to obtain the measurement error, like re-
measuring or resampling; but unless we know the exact pa-
rameters of the model, we cannot obtain the system error. If
the equation error is simply omitted, the estimation becomes
an overestimation (see [11]). Thus, unless the system er ror is
small and accurate estimation of the ratio of variances can be
obtained accurately, TLS will not be unbiased.
Another problem with TLS for computer vision applica-
tions is that often the noise is heteroscedastic [6]. In other
words, the noise is independent for each variable, but cor-
related for the measurements. Although we still could apply
TLS (assuming we normalize for the different variances in
the noise), the corresponding objective function is nonlin-
ear and nonconvex. As shown in [12], the long valley in the
objective function surface around the minimum point often
causes a problem in the convergence. If, however, the error
is mismodeled, the performance of TLS can decrease very
much.
3. NOISE
Now let us investigate a realistic error model for our flow
equation
A
x
=
b. (10)
This equation is based on two assumptions:
(1) intensity consistency: the intensity of a point in the im-
age is constant over some time interval,
(2) motion consistency: the motion follows some model.
For example, the flow is approximated by a polynomial
function in the image coordinates, or the flow varies
smoothly in space.
The errors, thus, can be categorized into
(1) modeling error: the intensity is not constant or the mo-
tion model fails to fit the real motion,
(2) measurement noise: this is mainly sensor noise and
noise due to poor discrete approximation of the image
derivatives I
x
, I
y
,andI
t
.
We argue that we need to take both kinds of error into ac-
count. Modeling errors always occur. They are associated
with the scene and its geometrical properties. Modeling er-
rors become large at specularities and at the boundaries be-
tween two different regions, or if the model does not apply.
These errors have much less randomness than the measure-
ment noise. The measurement noise generally can be treated
as random variables. Most studies only consider measure-
ment noise, and only the one due to sensors (see [6, 12]).
Butwewanttodealwithallthesourcesofnoise.Ingen-
eral we are f acing a combination of multiple heteroscedastic
noises. We could attempt to use a sophisticated noise model.
But it appears too complicated to estimate the variances of
the different noise components, wh ich is necessary to apply
CLS or TLS regression. Fortunately, we do not need to. In the
next section we will introduce a parameter regression called
the instrumental variables method (IV), which has been used
extensively in economics.
4. COLOR IMAGES AND IV REGRESSION
4.1. IV regression
As regression model we have the EIV model as defined in
Definition 1,withA
∈ R
n×k
,
b ∈ R
n
,and
x
∈ R
k
.
Definition 2 (instrumental variables method). Consider a
random sample matrix W of n
× j elements, called the instru-
ments or instrumental variables of A, which has the following
properties:
(1) E(W
t
(δ
A
x +
δ
b
)) = 0.
(2) E((W
t
W)
−1
W
t
A
) is a nonsingular matrix.
Then the instrumental variable estimator for the k dimen-
sional vector
x,definedas
x
=
⎧
⎪
⎪
⎪
⎨
⎪
⎪
⎪
⎩
W
t
A
−1
W
t
b if j
= k,
A
t
W
W
t
W
−1
W
t
A
−1
A
t
W
W
t
W
−1
W
t
b if j
≥ k
(11)
is an asymptotically unbiased estimator for
x
.Thevariance
of the estimated
x can be estimated as
V(
x)
=
1
n − k
A
t
A
−1
n
i=1
b
i
− A
t
i
x
2
,
with
A = W
W
t
W
−1
W
t
A,
(12)
when j
= k.
Let us explain this model. Intuitively, two things are re-
quired for a set of measurements W to be instrumental vari-
ables to the original measurements. The first one is that
the instrumental variables are not correlated with the noise
terms in the estimation model. The second one is that the in-
strumental variables and the explanatory variables are not in-
dependent, and thus the correlation matrix has full rank, and
that W has full column rank. Then instead of premultiplying,
4 EURASIP Journal on Advances in Signal Processing
as in LS, (2)withA
t
to derive at A
t
A
x = A
t
b, we premultiply
with W
t
to solve an equation system of the form
W
t
A
x
= W
t
b. (13)
This is easy if the number of variables in A and W is the same.
For example, if A and W result from two ways of estimat-
ing A
. But the number of variables could also be different.
In this case, most often the IV method is implemented as a
two-stage regression. In the first stage A and
b are regressed
on the instrumental variables. Requirement 2 guarantees that
the instrumental variables are related to A and
b. In the sec-
ond stage the regression of interest is estimated as usual, ex-
cept that now each covariate is replaced with its approxima-
tion estimated in the first stage. Requirement 1 guarantees
that the noise in this stage does not make the estimation bi-
ased. More clearly, rewrite the regression as a new regression
model:
b
= W
π
1
,
A
= WΠ
2
.
(14)
Then the first regression yields
π
1
=
W
t
W
−1
W
t
b,
Π
2
=
W
t
W
−1
W
t
A.
(15)
The relation between
π
1
and Π
2
is
π
1
= Π
2
β. Then the least
squares estimator in the second stage gives
x
=
Π
t
2
Π
2
−1
Π
t
2
π
1
. (16)
Mathematically this estimator is identical to a single stage es-
timator when the number of instruments is the same as the
number of covariates (i.e., j
= k), leading to the formulation
of (11).
The technique of instrumental variables is highly robust
to improper error modeling. It can be used even if the in-
strumental variables are not completely independent of the
measurement errors. The worst that can happen is that A and
W have the exact same measurement error, in which case the
method reduces to LS estimation. To summarize, the advan-
tages of IV regression over other techniques are the following.
(1) It does not require assumptions about the distribution
of the noise.
(2) It can handle multiple heteroscedastic noise terms.
In comparison, other methods need to derive specific
complicated minimization procedures for the specific
problem.
(3) The minimization is simple and noniterative with a
computational complexity which is comparable to LS.
Next we show how to construct appropriate instrumental
variables for the estimation of the optic flow parameters.
4.2. Color images
Here we consider an RGB color model. Other color models
are similar. The RGB model decomposes colors into their red,
green, and blue components (R,G,B). Thus, from the bright-
ness consistency constraint we can obtain three linear equa-
tion systems:
A
R
x
=
b
R
,
A
G
x
=
b
G
,
A
B
x
=
b
B
.
(17)
Why should the A
R
, A
G
, A
B
be appropriate instrumen-
tal variables to each other? For a natural scene, the correla-
tion between the image gradients of the three color images
is very high. Therefore the second requirement for instru-
mental variables is satisfied in most cases. And what about
the first requirement, that is, the independence of the noise
terms? It is quite reasonable to assume that the sensor noise
components are independent if the sequence is taken by a
true color camera. The approximation errors in the image
gradients will not be completely independent, since there is
a similarity in the structure of the color intensity functions.
We found in our experiments, that for scenes with noticeable
color variation, the correlation between the approximation
errors is rather weak. This means that we cannot completely
remove the bias from approximation error, but we can par-
tially correct the bias caused by this error. We cannot correct
the bias from the modelling error. But despite the presence of
modelling error, we still can deal with the other errors. Other
estimators like TLS cannot.
Using the image gradients of one color channel as in-
strumental variables to the image gradients of another color
channel we obtain six different IV estimations of the real
value
x
:
x
1
=
A
t
B
A
R
−1
A
t
B
b
R
,
x
2
=
A
t
G
A
R
−1
A
t
G
b
R
,
x
3
=
A
t
G
A
B
−1
A
t
G
b
B
,
x
4
=
A
t
R
A
B
−1
A
t
R
b
B
,
x
5
=
A
t
B
A
G
−1
A
t
B
b
G
,
x
6
=
A
t
R
A
G
−1
A
t
R
b
G
.
(18)
Because of small sample size, in practice we use Fuller’s
modified IV estimator [9], which is defined as
x
=
A
t
A − νS
22
−1
A
t
b − νS
21
, (19)
where ν is a constant term that we set equal to 1. Our exper-
iments found that the choice of ν does not have a significant
influence on the estimation.
A,
b are defined as
A,
b
= W
W
t
W
−1
W
t
(A,
b) (20)
and S
21
∈ R
2×1
and S
22
∈ R
2×2
are submatrices of
S
= (n − k)
−1
(
b, A)
t
(
b, A) − (
b, A)
t
W
W
t
W
−1
W
t
(
b, A)
.
(21)
H. Ji and C. Ferm
¨
uller 5
Now we have six estimations for
b, or even nine if we
include the three least squares estimates. We can also estimate
their respective variances V(
x) according to (12), and take
the weighted mean of these estimates as our final estimate:
x
=
6
i=1
V
x
k
−1
−1
6
k=1
V
x
k
−1
x
k
. (22)
Such an estimate
x will decrease the variance and effectively
correct the bias.
4.3. Robust IV regression
So far, we have only discussed small-scale noise. Often, we
also have large-scale measurement errors (outliers). Such er-
rors occur in the temporal derivatives at the motion bound-
aries or in the spatial derivatives close to the boundary of ob-
jects. Outliers will seriously decrease the performance of a ny
estimator, LS, TLS, as well as the IV estimator. Next, we dis-
cuss an IV version of robust regression.
A popular robust regression dealing with outliers is the
median regression. Assuming that δA
i
,
δ
b
i
,andW
i
are inde-
pendent, we obtain that
Med
δA
i
,
b
i
|
W
i
=
0, (23)
which implies that
E
sgn
W
t
i
b
i
− A
t
i
x
=
0. (24)
Then a robust estimator
x
M IV
can be defined as the mini-
mum of some norm of its sample analogue:
1
n
n
i=1
W
t
i
1
b
i
− A
t
i
x>0
−
1
b
i
− A
t
i
x<0
, (25)
where 1
{·} is defined as
1
{Γ}=
⎧
⎨
⎩
1, Γ is TRUE,
0, Otherwise.
(26)
Such a robust estimator
x
M IV
effectively detects outliers. Af-
ter eliminating the outliers, the usual IV estimation can be
applied to obtain an accurate estimation of the parameters.
4.4. Integration of IV regression into
differential flow algorithms
A very popular optical flow model is the weighted local con-
stant flow model, where one minimizes
i
w
2
i
∇
I
t
i
x + I
t
i
2
(27)
with
∇I
i
= (I
x
i
, I
y
i
) denoting the spatial derivatives of I.Itis
easy to see that this amounts to the usual least squares regres-
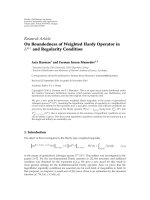
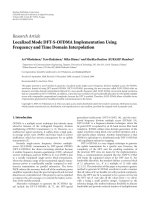
Figure 1: Reference images for the “cloud” sequence.
sion for the linear system A
x =
b,with
A
=
w
i
∇I
i
,
b
=−
w
i
I
t
i
,
x
=
u
x
, u
y
.
(28)
We can apply the IV regression to any combination of two
colors. For example, we can take color channels R and B to
obtain
A
t
R
A
B
x
= A
t
R
b
B
, (29)
with
A
R
=
w
i
1
∇R
i
,
A
B
=
w
i
2
∇B
i
,
x
R
=
w
i
1
R
t
i
,
x
B
=
w
i
2
B
t
i
.
(30)
Another common model assumes the surface in view to
be a parametric function of the image coordinates. For ex-
ample, if the surface is fronto parallel, the flow is linear. If
the surface is a slanted plane, the flow is quadratic. Such flow
models often are used in image registration and egomotion
estimation. The corresponding brightness consistency con-
straint
∇I
t
x + I
t
= 0 still is a linear system with a parameter
vector that encodes motion and surface information.
We also could easily incorporate the IV regression into
flow algorithms which enforce some smoothness constraints.
We only need to replace the LS form for the brightness con-
sistency constraint by its IV form while leaving the smooth-
ness penalty part of the objective function in the minimiza-
tion the same.
5. EXPERIMENTAL RESULTS AND SUMMARY
We compared the performance of IV estimation against LS
estimation and a straight forward version of TLS estimation
with similar complexity.
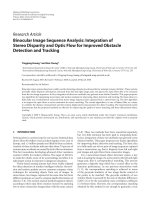
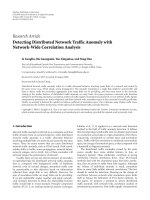
Using the two images in Figures 1 and 2, we generated
image sequences with 2D rigid motion, that is, 2D rotation
6 EURASIP Journal on Advances in Signal Processing
Figure 2: Reference image for the “office” sequence.
and translation, that is, the image motion amounts to
u
x
u
y
=
cos α − sin α
sin α cos α
x
y
+
t
x
t
y
. (31)
In the first experiment we described the flow with an
affine model as
u
x
u
y
=
a −b
ba
x
y
+
t
x
t
y
. (32)
Thus, having computed the image derivatives I
x
, I
y
, I
t
, the es-
timation amounts to first finding the parameters (a, b, t
x
, t
y
)
and then computing the optical flow at every point from
(32).Theaverageerrorisdefinedastheaveragedifference be-
tween the estimated optical flow and the ground truth (over
all pixels). In total 150 motion sequences were created with
parameter α distributed uniformly between [
−5, 0], and pa-
rameters t
x
, t
y
distributed uniformly between [−1, 1].
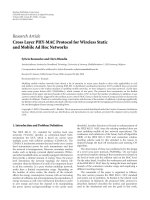
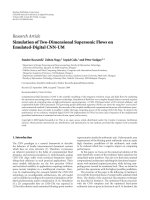
The scatter plots of the average error in Figure 3 clearly
show the advantage of IV over LS and TLS. The perfor mance
of TLS is much worse than LS, which from our discussion in
the previous section, is not surprising. (The normalization
is critical for the success of TLS. However, it also increases
the complexity dramatically.) The improvement of IV over
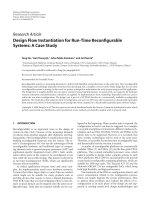
LS in Figure 4 is not as good as in Figure 3. This is due to the
fact that the three color channels in the sequence “office” (see
Figure 2) in many locations are very similar to each other,
while the three color channels in the sequence “cloud” (see
Figure 1) are not. Thus, the overall effect of bias correction
is less. But the IV method still could achieve moderate bias
correction.
In the second experiment, we used the Lucas-Kanade
multiscale algorithm [13], which does not rely on a paramet-
ric predefined flow model. We used a pyramid with three lev-
els of resolution and we added Gaussian noise with σ
= 4to
the synthetic image sequences. (This corresponds to an SNR
defined as I
mean
/σ of (25.7, 23.9, 14.7) for the three channels
(R,G,B), or a PSNR (peak SNR) defined as 20 log
10
(255/σ
2
)
of 24 for all three color channels.) 54 trials were conducted
20 40 60 80 100 120
Trials
0
0.1
0.2
0.3
0.4
0.5
0.6
0.7
0.8
Average error of flow
IV
LS
(a) LS versus IV
0 20 40 60 80 100 120
Trials
0
0.5
1
1.5
2
2.5
3
Average error of flow
TLS
IV
(b) TLS versus IV
Figure 3: Performance comparison on the “cloud” sequence.
with randomly chosen 2D motion parameters in the same
intervals as in the first experiment. The average errors in the
optical flow are illustrated in Figures 5 and 6. As in the first
experiment, the IV method outperforms the other two meth-
ods, and the improvement is much larger for the “cloud” se-
quence than for the “office ” sequence.
We also compared the three flow estimators on a real
image sequence. A robot moved with controlled translation
in the corridor carrying a camera that pointed at some an-
gle at a wall, which was covered with magazine paper (see
Figure 7 for one frame). The camera was calibrated, and thus
the ground truth of the optical flow was known. The flow was
estimated using the Lucas-Kanade multiscale algorithm with
H. Ji and C. Ferm
¨
uller 7
0 20 40 60 80 100 120
Trials
0
1.5
Average error of flow
LS
IV
0.5
1
(a) LS versus IV
0 20 40 60 80 100 120
Trials
0
2.5
Average error of flow
TLS
IV
0.5
1
1.5
2
(b) TLS versus IV
Figure 4: Performance comparison on the “office” sequence.
three levels of resolution. The estimation was performed on
the individual color channels (R, G, B) and on the combined
color channels using LS, TLS, and the IV method. Figure 8(a)
shows the average angular error between the estimated flow
and the ground truth. Figure 8(b) shows the average relative
error in the magnitude of the horizontal flow component,
that is, denoting the ground truth of the magnitude of the
flow values as x
i
, the estimates as x
i
, and the confidence in
the estimates (the condition number of matrix A in the equa-
tion Ax
= b)ascon(x
i
), the error was found as the mean
of (
|x
− x
i
|/x
i
)con (x
i
). As can be seen, there is different in-
formation in the individual color channels. However, how to
fuse the three channels, to arrive at more accurate estimates,
0 10 20304050 60
Trials
0.18
Average error of flow
LS
IV
0.12
0.13
0.14
0.15
0.16
0.17
(a) LS versus IV
0 102030405060
Trials
0.1
0.2
0.3
0.4
0.5
0.6
0.7
0.8
Average error of flow
TLS
IV
(b) TLS versus IV
Figure 5: Performance comparison on the “cloud” sequence using
the Lucas-Kanade algorithm.
is not a trivial task. The IV method performed best among
the three estimators in fusing the color channels.
6. CONCLUSIONS
We presented a new approach to correct the bias in the es-
timation of optical flow by utilizing color image sequences.
The approach is based on the instrumental variables tech-
nique. It is as simple and fast as ordinary LS estimation, while
providing better performance. The same technique could
also be applied to other estimation problems in image re-
construction. For example, the estimation of shape from dif-
ferent cues, such as stereo, texture, or shading. Many of the
8 EURASIP Journal on Advances in Signal Processing
0 10 20304050 60
Trials
Average error of flow
LS
IV
0.12
0.13
0.14
0.15
0.16
0.17
(a) LS versus IV
0 102030405060
Trials
0.1
0.2
Average error of flow
TLS
IV
0.3
0.4
0.5
0.6
0.7
0.8
(b) TLS versus IV
Figure 6: Performance comparison on the “office” sequence using
the Lucas-Kanade algorithm.
Figure 7: One frame in the “wall” sequence.
Red Green Blue LS TLS IV
Comparison
Average angular error
0.1
0.15
0.2
0.25
(a)
Red Green Blue LS TLS IV
Comparison
Average horizontal error
0.4
0.5
0.7
0.6
0.3
0.2
0.1
0
(b)
Figure 8: Performance comparison on the “wall” sequence: (a) Av-
erage angular error (in degrees) between estimation and ground
truth. (b) Average relative error in value of horizontal flow com-
ponent.
shapes from X techniques employ linear estimations, or they
use regularization approaches, which also could incorporate
a bias correction in the minimization.
REFERENCES
[1] B. K. P. Horn and B. G. Schunck, “Determining optical flow,”
Artificial Intelligence, vol. 17, no. 1–3, pp. 185–203, 1981.
[2] J. L. Barron, D. J. Fleet, and S. S. Beauchemin, “Performance
of optical flow techniques,” International Journal of Computer
Vision, vol. 12, no. 1, pp. 43–77, 1994.
[3] H H. Nagel, “Optical flow estimation and the interaction be-
tween measurement errors at adjacent pixel positions,” Inter-
national Journal of Computer Vision, vol. 15, no. 3, pp. 271–
288, 1995.
[4] C. Ferm
¨
uller, D. Shulman, and Y. Aloimonos, “The statistics
of optical flow,” Computer Vision and Image Understanding,
vol. 82, no. 1, pp. 1–32, 2001.
H. Ji and C. Ferm
¨
uller 9
[5] K. Kanatani, Statistical Optimization for Geometric Computa-
tion: Theory and Practice, Elsevier Science, Oxford, UK, 1996.
[6] J. Bride and P. Meer, “Registration via direct methods: a sta-
tistical approach,” in Proceedings of the IEEE Computer So-
ciety Conference on Computer Vision and Pattern Recognition
(CVPR ’01), vol. 1, pp. 984–989, Kauai, Hawaii, USA, Decem-
ber 2001.
[7] R. J. Andrews and B. C. Lovell, “Color optical flow,” in Pro-
ceedings of the Workshop on Digital Image Computing, vol. 1,
pp. 135–139, Brisbane, Australia, February 2003.
[8] P. Golland and A. M. Bruckstein, “Motion from Color,” Com-
puter Vision and Image Understanding, vol. 68, no. 3, pp. 346–
362, 1997.
[9] W. A. Fuller, Measurement Error Models,JohnWiley&Sons,
New York, NY, USA, 1987.
[10] S. Van Huffel and J. Vandewalle, The Total Least Squares Prob-
lem: Computational Aspects and Analysis, vol. 9 of Frontiers
in Applied Mathematics Series, SIAM, Philadelphia, Pa, USA,
1991.
[11] R. J. Carroll and D. Ruppert, “The use and misuse of orthogo-
nal regression estimation in linear errors-in-variables models,”
Tech. Rep., Department of Statistics, University of Texas A&M,
College Station, Tex, USA, 1994.
[12] L. Ng and V. Solo, “Errors-in-variables modeling in opti-
cal flow estimation,” IEEE Transactions on Image Processing,
vol. 10, no. 10, pp. 1528–1540, 2001.
[13] B. D. Lucas and T. Kanade, “An iterative image registration
technique with an application to stereo vision,” in Proceed-
ings of the 7th International Joint Conference on Artificial Intel-
ligence (IJCAI ’81) , pp. 674–679, Vancouver, BC, Canada, Au-
gust 1981.
Hui Ji received his B.S. degree, M.S. de-
gree in mathematics and Ph.D. degree in
computer science from Nanjing University,
National University of Singapore, and the
University of Maryland at College Park, re-
spectively. Since 2006 he has been an Assis-
tant Professor in the Department of Math-
ematics at the National University of Sin-
gapore. His research interests are in human
and computer vision, image processing, and
computational harmonic analysis.
Cornelia Ferm
¨
uller received the M.S. de-
gree in applied mathematics from the Uni-
versity of Technology, Graz, Austria in 1989
and the Ph.D. degree in computer science
from the Technical University of Vienna,
Austria in 1993. Since 1994 she has been
with the Computer Vision Laboratory of
the Institute for Advanced Computer Stud-
ies, University of Maryland, College Park,
where she is currently an Associate Research
Scientist. Her research has been in the areas of computational and
biological visions centered around the interpretation of the scene
geometry from multiple views. Her work is published in 30 journal
articles and numerous book chapters and conference articles. Her
current interest focuses on visual navigation capabilities, which she
studies using the tools of robotics, signal processing, and visual psy-
chology.