Báo cáo hóa học: " Research Article Hardware Implementation of a Modified Delay-Coordinate Mapping-Based QRS Complex Detection Algorithm" potx
Bạn đang xem bản rút gọn của tài liệu. Xem và tải ngay bản đầy đủ của tài liệu tại đây (1.55 MB, 13 trang )
Hindawi Publishing Corporation
EURASIP Journal on Advances in Signal Processing
Volume 2007, Article ID 57286, 13 pages
doi:10.1155/2007/57286
Research Article
Hardware Implementation of a Modified Delay-Coordinate
Mapping-Based QRS Complex Detection Algorithm
Matej Cvikl,1 Franc Jager,2 and Andrej Zemva3
1 Iskra
Sistemi, d.d., Stegne 21, 1000 Ljubljana, Slovenia
of Biomedical Computer Systems and Imaging, Faculty of Computer and Information Science,
University of Ljubljana, Trzaska 25, 1000 Ljubljana, Slovenia
3 Laboratory for Integrated Circuit Design, Faculty of Electrical Engineering, University of Ljubljana,
Trzaska 25, 1000 Ljubljana, Slovenia
2 Laboratory
Received 30 April 2006; Revised 23 January 2007; Accepted 23 January 2007
Recommended by David Hamilton
We present a modified delay-coordinate mapping-based QRS complex detection algorithm, suitable for hardware implementation.
In the original algorithm, the phase-space portrait of an electrocardiogram signal is reconstructed in a two-dimensional plane using the method of delays. Geometrical properties of the obtained phase-space portrait are exploited for QRS complex detection. In
our solution, a bandpass filter is used for ECG signal prefiltering and an improved method for detection threshold-level calculation
is utilized. We developed the algorithm on the MIT-BIH Arrhythmia Database (sensitivity of 99.82% and positive predictivity of
99.82%) and tested it on the long-term ST database (sensitivity of 99.72% and positive predictivity of 99.37%). Our algorithm
outperforms several well-known QRS complex detection algorithms, including the original algorithm.
Copyright © 2007 Matej Cvikl et al. This is an open access article distributed under the Creative Commons Attribution License,
which permits unrestricted use, distribution, and reproduction in any medium, provided the original work is properly cited.
1.
INTRODUCTION
Detecting QRS complexes is the most important task in electrocardiogram (ECG) signal analysis. Physiological variability of QRS complexes and various types of artifacts like muscle noise, power line interference, baseline wander, motion
artifacts, and electrode contact noise added to the ECG signal make QRS complex detection a difficult task.
In the literature, various types of QRS complex detection algorithms can be found. Kă hler et al. [1] divided QRS
o
complex detection algorithms into algorithms based on signal derivatives and digital filters, wavelet-based QRS complex
detection, neural network approaches, and additional approaches. The algorithms from the first two groups are most
widely used for QRS complex detection and can be found in
software (SW) or hardware (HW) implementations.
The first group encompasses algorithms based on signal derivatives and digital filters. Such approach divides the
search process into two stages: the preprocessing stage and
the decision stage. The preprocessing stage usually consists
of a band-pass linear filter to reduce noise and enhance the
QRS complex [2, 3], and a nonlinear filter, which by signal
differentiation, squaring, and integration differentiates the
QRS complex from the artifacts. The decision stage applies
QRS complex search rules where the detection function is
compared to a certain detection threshold level to find signal
peaks and then the decision is made whether the peak is a
QRS complex or not. One of the best performing algorithms
in this group is an open source ECG analysis SW (OSEA)
[4]; OSEA achieves QRS complex detection sensitivity (Se)
of 99.80% and positive predictivity (+P) of 99.80% on the
MIT-BIH Arrhythmia Database [5]. Further examples of algorithms with lower performance that can be classified into
this group can be found in [6–10].
The variety of QRS complex shape morphologies and artifacts causes the performance of QRS complex detection algorithms that use fixed bandwidth bandpass filters and fixed
width integration windows to decrease when the QRS morphology changes. To avoid this problem, a new approach to
QRS complex detection based on wavelet transform (WT)
has been introduced. The WT decomposes the ECG signal
into several scales, where each scale has different bandwidth
and time support. WT at any scale is done by filtering the signal with an appropriate filter. The most common approach
to QRS complex detection is finding local maxima at four
consecutive scales. Detection starts at the largest scale (W2 4 )
2
EURASIP Journal on Advances in Signal Processing
Time
delay
ECG
signal
Lowpass
filter
y
x
Area
calculation
Peak
detection
and
decision
Detection
threshold
level
calculation
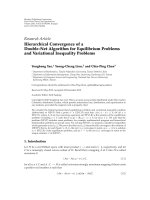
Figure 1: QRS complex detection using delay-coordinate mapping [11].
containing low-frequency signal information and continues
to the lowest scale (W2 1 ) containing high-frequency signal
information. A positive-negative pair of local maxima that
occurs at all the scales at the same time and meets other detection rules is declared as the QRS complex. One of the first
WT-based QRS complex detection algorithms with very high
Se of 99.89% and +P of 99.94% tested on the MIT-BIH Arrhythmia Database was published by Li et al. [12]. This algorithm serves as a starting point for other algorithms which
usually only differ in the usage of different wavelet functions
[13], number of processed scales [14], or modifications to
the original algorithm [15, 16]. These algorithms also have
lower performance than [12].
While algorithms from the first group are usually less
computationally intensive and suitable for microcontroller
implementations in embedded systems, other types of algorithms usually utilize a greater number of filters and decision
rules, making them unsuitable for systems with low-signal
processing power. Most of such algorithms run on personal
computers (PCs) where data is processed further. Regardless
of the type of the algorithm, when a lot of ECG signals need
to be processed on a single PC in a relatively short time, it
is essential to have enough processing power. All the signals
need to be processed without degrading the performance of
other applications running on the PC. One solution to the
problem is upgrading the PC, while the second solution is in
an application-specific HW. Such HW can be based on a digital signal processor (DSP) or field programmable gate array
(FPGA) added to the PC, so the processor in the PC can be
relieved from most of the computation.
The goal of our research work was development and HW
implementation of a QRS complex detection algorithm in order to set the groundwork for further ECG signal processing
stages in HW. Because of expected high-speed data processing, the HW is aimed to be used as a QRS complex detection
engine in systems where a larger number of ECG signals have
to be processed. In this paper, a HW implementation of the
QRS complex detection algorithm based on phase-space portrait of the ECG signal is described. In contrast to the original
algorithm [11], our algorithm processes blocks of ECG data,
has a different input filter, and uses a different method for
detection threshold level calculation. The algorithm was developed on the MIT-BIH Arrhythmia Database and a comparison with some of the well-known QRS complex detection algorithms in terms of QRS detection performance on
this database was made. Finally, the algorithm was tested on
the long-term ST database (LTST DB) [17].
2.
MATERIALS AND METHODS
A real-time QRS complex detection algorithm for microcontroller implementation was adapted for block data processing in HW. The developed algorithm was first modeled and
tested in SW (Matlab). The SW model served as an optimization and testing tool for the HW implementation of the algorithm, which was entirely written in very high-speed integrated circuit hardware description language (VHDL) [18].
The QRS complex detection algorithm proposed by Lee
et al. [11] uses time delay to map the input ECG signal. A single ECG signal and its time delayed duplicate create a phasespace portrait, whose geometrical properties are exploited
for QRS complex detection. Based on the size of the polygon bounded by a number of consecutive data points, a QRS
event can be found. Each time a new polygon size (area) exceeding the current detection threshold level is found, a decision is made whether the peak is indeed a QRS complex
or not, and the detection threshold level is updated. A block
diagram of the algorithm is shown in Figure 1.
Although this scheme requires several multiplications for
area calculation, the algorithm is relatively simple and has
satisfactory performance: Se of 99.69% and +P of 99.88%,
tested on the MIT-BIH Arrhythmia Database. In order to
simplify the preprocessing stage, authors deliberately used
only a lowpass filter, which resulted in more dynamic changes
of the polygon sizes since P and T waves and motion artifacts
were not filtered out.
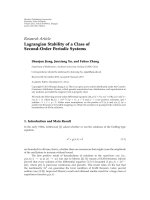
We modified the algorithm in order to make it more suitable for postprocessing, where the ECG signal is processed
block-by-block. It is designed and optimized for QRS complex detection in the ECG signal sampled at 250 Hz. However, other sampling rates can be used with appropriate adjustments to the input filter, correct block length, and detection threshold level calculation. The algorithm we propose is
shown in Figure 2.
As can be seen in Figure 2, the modified algorithm comprises a bandpass filter instead of the lowpass filter, and
the detection threshold level calculation is performed before
peak detection. Moreover, a different method for the detection threshold level calculation is utilized. The algorithm is
described in more detail in the following subsections.
Matej Cvikl et al.
3
Time
delay
ECG
signal
y
Bandpass
filter
Area
calculation
x
Threshold
calculation
Peak
detection
and
decision
Figure 2: Modified delay-coordinate mapping algorithm.
1
ECG (t+ delay) (mV)
1.5
1
ECG (t) (mV)
1.5
0.5
0
−0.5
0
−0.5
−1
−1
−1.5
0.5
0
0.5
1
t (s)
1.5
−1.5
−2
2
−1
(a)
1
2
1
2
(b)
1.5
1
1
ECG (t+ delay) (mV)
1.5
ECG (t+ delay) (mV)
0
ECG (t) (mV)
0.5
0
−0.5
−1
−1.5
−2
0.5
0
−0.5
−1
−1
0
ECG (t) (mV)
1
2
(c)
−1.5
−2
−1
0
ECG (t) (mV)
(d)
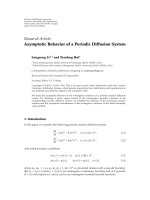
Figure 3: Phase-space portraits of the ECG signal: (a) input ECG signal, (b) phase-space portrait of the ECG signal with the time delay of
4 milliseconds, (c) phase-space portrait of the ECG signal with the time delay of 12 milliseconds, (d) phase-space portrait of the ECG signal
with the time delay 28 milliseconds.
2.1. Phase-space portrait
The phase-space portrait (also phase portrait) of a signal is constructed in a 2D plane (x-y) from the original signal and its time delayed duplicate, so that coordinates of each data point are written as x[nT] = ECG[nT]
and y[nT] = ECG[(n − τ)T], where τ is the time delay. Figure 3 shows exemplary phase-space portraits of two
consecutive heartbeats, where trajectories are generated by
delaying the signal by 4 milliseconds, 12 milliseconds, and
28 milliseconds. In the phase-space portraits, we can distinct
three different areas which the trajectory forms in the 2D
plane: the smaller areas are created by the P and T waves
with a lower amplitude, while the largest area corresponds
to a higher amplitude wave or the QRS complex, respectively.
4
EURASIP Journal on Advances in Signal Processing
ECG (t) (mV)
1
0
−1
−2
0
0.5
1
1.5
2
2.5
t (s)
3
3.5
4
4.5
5
2
ECG (t) (mV)
ECG (t) (mV)
(a)
0
−2
0
1
2
3
4
0.5
0
−0.5
5
0
1
2
t (s)
2
0
−1.5
−1
4
5
0.4
0.6
4
5
(c)
−0.5
0
0.5
ECG (t+ delay) (mV)
ECG (t+ delay) (mV)
(b)
−2
−2
3
t (s)
0.5
0
−0.5
−0.4
−0.2
ECG (t) (mV)
(d)
0
0.2
ECG (t) (mV)
(e)
2
0.4
1
0.2
0
0
1
2
3
4
5
0
0
1
2
(f)
3
t (s)
t (s)
(g)
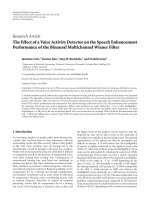
Figure 4: Phase-space portraits and the calculated area of the ECG signal: (a) input ECG signal, (b) lowpass filtered ECG signal, (c) bandpass filtered ECG signal, (d) phase-space portrait of the lowpass filtered ECG signal, (e) phase-space portrait of the bandpass filtered ECG
signal, (f) calculated area of the lowpass filtered ECG signal, (g) calculated area of the bandpass filtered ECG signal.
It is very important that an appropriate signal time delay is chosen in order to get useful phase-space portraits and
to sustain proportions between the sizes of areas created by
different waves. If the time delay is too short (Figure 3(b)),
the resulting trajectory creates rather “flat” areas around the
y = x line, that can potentially be disordered, but on the
other hand, if the time delay is too great (Figure 3(d)), the
contour can create several smaller areas instead of one larger
area. Based on their QRS detection algorithm performance,
Lee et al. [11] determined that the optimal time delay is
20 milliseconds.
Some phase-space portrait examples of ECG signals contaminated with high-frequency noise and baseline drifts are
shown in [11]. While baseline drifts cause the phase-space
portrait to move along the diagonal axis of the plane, along
the y = x line, and do not influence the size of the area itself,
the high-frequency noise can distort the phase-space portrait
to a point where the distinctive area created by the QRS complex cannot be found anymore. To avoid this, the ECG signal
is to be prefiltered, so the phase-space portrait is constructed
from the filtered ECG signal and its time delayed duplicate.
Figure 4 shows the input ECG signal, lowpass, and bandpass
filtered signals, their phase-space portraits, and sizes of the
areas the trajectories created. The input signal is deliberately
selected to emphasize the difference between the phase-space
portraits created by the two filters.
When the signal is filtered with the lowpass filter, the influence of baseline drift can be seen; the trajectory created
Matej Cvikl et al.
5
1
0.8
0.6
0.4
Amplitude
by time delaying the signal moves along the y = x line
(Figure 4(d)), while no influence can be seen on the calculated area (Figure 4(f)). It can also be noted that the lowpass filter allows waves like P and T to create small areas
(Figure 4(f)), which add to more dynamical area behavior. If
the ECG signal is filtered with a bandpass filter, the trajectory
does not move along the y = x line (Figure 4(e)) and there
are hardly any areas present that would be created by the P
and T waves, as these waves are attenuated (Figure 4(g)). It
can also be noticed that the different frequency characteristics of the bandpass filter result in a different shape and position of the shape the trajectory tends to form in the 2D plane
(Figures 4(d), 4(e)).
0.2
0
−0.2
−0.4
−0.6
−0.8
−1
0
1
2
3
2.2. Area calculation
4
5
Samples
6
7
8
9
(a)
1
Area =
2
x1 x2
x x
x
x
+ 2 3 + · · · + n−1 n
y1 y2
y2 y3
yn−1 yn
. (1)
Polygon orientation is not important, so the absolute value
of the calculated area (determinant) has to be considered. Lee
et al. [11] calculated the sizes of areas comprised of ten data
points. Their decision was based on the fact that if the average
QRS complex duration is less than 100 milliseconds (25 data
points at 250 samples per second), all polygons comprised
of ten data points are nonintersecting. The experiment for
obtaining the optimum number of data points for our algorithm is described in Section 3.
1
0.9
Amplitude (normalized to 1)
As mentioned in the previous subsection, each data point in
the x-y plane has coordinates (x[nT], y[nT]). The size of an
area formed by n data points (n-point data vector) is used
as the detection function for locating QRS complexes. The
area is obtained using plane geometry equation for a planar
non-self-intersecting polygon area calculation:
0.8
0.7
0.6
0.5
0.4
0.3
0.2
0.1
0
0
20
40
60
80
Frequency (Hz)
100
125
(b)
Figure 5: Filter characteristics: (a) impulse response, (b) frequency
response.
2.3. Filtering
Targeted for HW implementation in FPGA, the chosen filter
belongs to a family of simple nonrecursive filters with integer multipliers [19, 20]. Impulse response of the filter used
in this work is shown in Figure 5(a). The filter comprises two
sections, where each section of length L calculates the average value of L neighboring data samples; thus each section
represents a moving average filter. By averaging consecutive
data samples, the high-frequency components of the input
signal are attenuated. To attenuate power-line interference,
the length L of the two sections is calculated so that the filter has zero gain at 50 Hz ( f 50) and multiples of 50 Hz. For
250 Hz sampling rate ( f s), the section length L is five:
L=
fs
.
f50
(2)
The filter can be redesigned for other sampling rates accordingly, again attenuating 50 Hz. Furthermore, the impulse
response of the filter was chosen in such a way that there
is a step between coefficient values. This results in emphasis on high-speed transitions in the input ECG signal, that
is, slopes of the QRS complex, and attenuation of the lowfrequency components. Frequency response of the filter is
shown in Figure 5(b). The difference equation of the filter is
the following:
y[n] = x[n] + x[n − 1] + x[n − 2] + x[n − 3]
+ x[n − 4] − x[n − 5] − x[n − 6]
− x[n − 7] − x[n − 8] − x[n − 9].
(3)
Frequency response of the filter shows attenuation of lowand high-frequency components.
We can also see approximately linear characteristic below
the center frequency yielding sensitivity of the bandpass filter
to slopes in original signal and cancelation of the 50 Hz component and its multiples. The center frequency of the filter
designed is at 18.7 Hz and its cutoff frequencies are at 9.2 Hz
and 29.3 Hz.
An example of an input ECG signal and the filtered signal is shown in Figure 6. It is clearly visible that faster slopes
in the original signal were emphasized or extracted, while
ECG (t) (ADC value)
6
EURASIP Journal on Advances in Signal Processing
1050
1000
950
900
850
800
750
Calculate thr new
Yes
0
0.2
0.4
0.6
0.8
1
1.2
thr = thr new
t (s)
No
thr = thr old
Detect peaks,
apply QRS rules at
the end of the block
(a)
Filtered ECG (t) (value)
thr new > thr old/8
500
Yes
0
thr old = thr
−500
0
0.2
0.4
0.6
0.8
1
No
QRS found
thr old = thr old/2
1.2
t (s)
(b)
Stop detection?
Figure 6: Original ECG signal and filtered ECG signal.
slowly varying waves like P wave, ST segment, and T wave
composed from low frequencies were attenuated.
2.4. Detection threshold level calculation
The bandpass filter significantly reduces the influence of
lower- and higher-frequency components on the calculated
area, which can be seen when Figures 4(f) and 4(g) are compared. In Figure 4(g), representing the areas created by the
bandpass filtered signal, the peaks produced by the QRS
complexes can clearly be distinguished from other peaks.
This is true even when the signal is noisy, like it is between
the third and the fourth heartbeats in Figure 4. The reduction of areas created by non-QRS artifacts enables a different
approach to the QRS complex detection threshold level calculation than what was originally used in [11]. Our detection
threshold level evaluation is based on the average value of the
detection function in the current data block. As the average
value of the calculated areas in the block was not high enough
to filter out the peaks that were not due to QRS complexes,
multiplied average values were tested. After extensive testing,
the optimal value to be used as a detection threshold level
was determined to be four times the average area value in the
data block.
Two additional safety mechanisms for error prevention
were incorporated in our algorithm and are depicted in
Figure 7.
The first mechanism assures that blocks, where the calculated detection threshold level is too low, are treated as
blocks with no QRS. Without this fail-safe, in blocks with
no QRS complexes, a peak of any height would be recognized as a QRS complex and the number of false positive (FP)
detections would increase. A search was conducted to find
the optimum lower limiting value that can be represented
Figure 7: Scheme of QRS complex detection threshold level adaptation.
with a combination of numbers of power of two. This limitation was set to avoid divisions in HW. Testing results indicated that the detection threshold level in the current block
(thr new) has to be greater than 1/8th of the threshold level
in the previous block (thr old). If this is not the case, the old
value is kept as a valid detection threshold level for the current block, otherwise the new value is used and the old one
is updated. The second mechanism serves for recovery from
false negative (FN) detections, as each time no QRS complex is found, the old detection threshold level (thr old) is
decreased by 50%. This proves to be useful in cases when
nondetected weak QRS complexes are present; each time no
QRS is detected, the detection threshold level (thr old) is
lowered, and eventually becomes sufficiently low to start detecting the QRS complexes. However, there is a limit to the
number of the detection threshold level decreases. The algorithm only allows three consecutive detection threshold
level decreases, meaning that the detection threshold level
can drop to 1/8th of its initial value. The detection threshold level remains unchanged for all subsequent consecutive
blocks with no QRS complexes.
2.5.
Peak search and QRS complex detection rules
QRS complex detection is based on a set of amplitude and
timing criteria widely used in detection algorithms and is
shown in Figure 9(a). After the detection threshold level (thr)
is set for the calculated areas, the block of the calculated areas
is searched for all peaks above thr and all peaks between thr/2
and thr. All peaks that exceed thr are automatically treated as
Matej Cvikl et al.
7
Error at 600 samples, 8 points
FN + FP (beats)
FN = 295
FP = 837
1200
1000
FN = 147
FN = 153
FN = 256
800
FN = 154
FP = 426
FP = 371
FP = 670
FP = 276
600
FN = 220
FN = 147
400
FN = 138
FP = 423
FP = 412
200
FP = 299
0
4
8
12
16
20
24
28
32
Time delay (ms)
(a)
FN + FP (beats)
Error at 20 ms delay, 8 points
1200
1000
800
600
400
200
0
FN = 103
FP = 954
FN = 152
FP = 562
400
500
FN = 154
FP = 276
FN = 299
FP = 168
FN = 217
FP = 199
FN = 176
FP = 262
FN = 467
FP = 136
FN = 262
FP = 184
600
650
700
750
Block length (samples)
800
900
(b)
Error at 600 samples, 20 ms delay
FN + FP (beats)
500
475
FN = 151
450 FP = 337
425
FN = 148
FP = 307
FN = 154
FP = 276
400
6
FN = 185
FP = 288
FN = 175
FP = 280
7
8
9
10
Number of points for area calculation
FN = 212
FP = 273
11
(c)
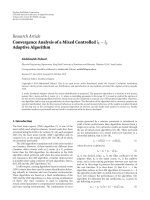
Figure 8: Influence of detection parameters ((a) time delay, (b)
block length, (c) number of polygon points) on the number of
missed and falsely detected beats.
QRS candidates, while the peaks between thr/2 and thr are
stored to a separate list (half peaks). Every time a new QRS
candidate is found, the half peaks list is cleared. If no QRS
candidates are found within 150% of the last RR interval,
the peaks from the half peaks list are added to QRS candidates, and the half peaks list is cleared. This procedure corresponds to the “search-back” procedure. After the complete
block of the area values is swept and the QRS candidate list is
obtained, QRS decision rules are applied to the list.
QRS complex decision is based on the peak mutual distance and amplitude criteria. A sweep through the peaks in
the detection function is performed. The position and height
of every peak in the QRS candidate list are compared to the
position and height of the last known peak in the list that
was recognized to originate from the QRS complex. The first
peak in the candidate list is automatically recognized as the
QRS complex. If the distance between the first and the second
peaks is less than the refractory period (200 milliseconds),
the higher of the two peaks is recognized as a QRS complex.
In case the second peak is higher, the first peak is discharged
and the second one is recognized as the first QRS complex. If
the distance is greater than the refractory period, the second
peak is automatically recognized as a new QRS complex. The
third peak would then be compared to the first or the second
peak, depending on which peak was recognized as the QRS
complex.
After all QRS complexes in the block have been located,
the difference between the last two QRS complexes is considered to be the RR interval. If none or only one QRS complex
is detected in a block, the RR interval remains unchanged.
It is also possible to calculate the RR interval as the mean
value of all RR intervals within one block. The performance
testing showed that the latter method performed worse, for
which its error persistence is to be blamed. If one FP beat is
detected, it takes several true positive (TP) detections to nullify its influence. Since such errors can persist through several blocks, the error can increase even further. Every FP detection causes the search-back to be performed sooner than
it should, which can lead to additional FP detections. The
opposite situation is also possible in cases when a few QRS
complexes are missed (FN); the search-back interval can be
increased and the search-back seldom performed. This way,
even more FN detections can occur when the QRS complexes
have their amplitude below the detection threshold level.
An additional feature of the QRS complex detection part
of the algorithm is the mechanism for block overlapping.
While in [13] consecutive blocks of data are overlapped by
75%, our algorithm uses the last detected QRS complex in
a block as a starting point for its subsequent block. The
method in [13] thus produces a constant 25% processing
overhead as 25% of the data is always processed twice. The
overhead in our method is variable and spans between 6.7%
(record 234) and 46.8% (record 231), but is with its average
value of 19.1% lower than in [13]. The same mechanism also
sets the starting point when no QRS is found in the processed
block. In such cases, the new starting point of the following
block is set at 450 samples of the currently processed block.
This means that the new block comprises 250 samples of the
old data (one second of the ECG signal) and 450 samples of
the new data. In cases where low-amplitude QRS complexes
are present but not detected, such block composition reduces
the number of FN detections, as some portions of blocks are
always processed twice and each time with a lower detection
threshold level.
To summarize, the main differences between the original
algorithm [11] and the proposed algorithm are the following. The influence of the bandpass filter on noise and lowfrequency signals causes the calculated phase-space portrait
area to be smoother. Additionally, the ECG signal is processed block-by-block, where block overlapping guarantees
detection of QRS complexes that would normally be split
into two separate blocks. These two features make it possible
8
EURASIP Journal on Advances in Signal Processing
Start
Read ECG data
Filtering,
area calculation
Reduced QRS
detection threshold
exceeded
Threshold
calculation,
start search
Add candidate to
half peaks
No
Yes
Read data
QRS detection
threshold
exceeded
No
Time exceeds
RR interval
No
Yes
Filtering,
area and
threshold
calculation
Write half peaks
Yes
Add to QRS
candidates
Clear half peaks,
reset searchback cnt.
No
Else
End of data block
Else
thr/2
exceeded
thr exceeded
1.5∗ RR
interval
exceeded
Write QRS
candidate
End of
block
Yes
Apply QRS detection rules
to QRS candidates,
update RR interval,
update old threshold
No
Compare
sample to
thresholds
Add
candidate to
half peaks
Stop detection
Apply QRS
rules to QRS
candidates
Clear
half peaks,
reset
search-back
cnt.
Update RR
interval,
transmit QRS
locations
Yes
Stop
(a)
(b)
Figure 9: QRS complex detection algorithm: (a) flow chart of the SW implementation, (b) simplified state diagram of the HW implementation.
to calculate the QRS detection threshold level on the basis
of the average value of the detection function in the current
data block.
3.
IMPLEMENTATION
The algorithm performance is highly dependant on the time
delay parameter τ, data block length settings, and the chosen number of polygon points. For testing purposes, the algorithm was first implemented in Matlab, where individual
detection parameters were set to give optimal QRS complex
detection performance in terms of the minimum number of
missed and falsely detected (FN and FP) QRS complexes.
For each of the three parameters, the algorithm performance was tested on the complete database. Each test had
two parameters fixed and the third parameter was chang-
ing (Figure 8). First, the time delay parameter selection was
made based on QRS complex detection performance with
blocks of 600 data samples and 8 data points for area calculation (Figure 8(a)). In the next step, the block length
was modified using the selected time delay and the same
number of polygon data points (Figure 8(b)). Finally, the
optimum number of data points used for area calculation
was determined using 20 milliseconds delay and block length
of 600 data samples (Figure 8(c)). Parameter settings with
the least detection error rate were chosen for the implementation and algorithm performance was evaluated on the
MIT-BIH Arrhythmia Database. The time delay was set to
20 milliseconds, the block length was set to 700 samples, and
the number of points was set to eight.
Based on the SW implementation in Figure 9(a), a statemachine adapted copy of the algorithm shown in Figure 9(b)
Matej Cvikl et al.
was developed in VHDL. The main difference between the
HW implementation and the SW implementation is true
parallel execution that the HW implementation offers.
All grayed parts of the code in Figure 9(a) are in the HW
implementation executed independent of each other. The
SW implementation needs to wait for the outcome of the detection threshold level comparison, while in the HW implementation both detection threshold level comparisons (thr
and thr/2) are performed at the same time. Such scheduling significantly reduces the number of clock cycles needed
for data processing and improves data processing speed. Furthermore, the average value can be calculated in parallel with
area calculation, which also speeds up block processing.
Another difference in the HW implementation is that in
the entire design only integer arithmetic is used. The decision to represent the variables with 32 bits or less was made
to reach a compromise between the entered calculation error
and resource utilization. Any variable that requires a greater
number of bits is appropriately modified. Such modification
is only needed at average value calculation, when 700 30-bit
area size variables are to be summed. The HW divider used
for average value calculation can only accept dividends of up
to 32 bits; therefore, before addition, each area value is divided by 256 to achieve a 32-bit sum (dividend). Because of
the high area values, such division has no influence on the
detection accuracy, and does not also influence the processing speed, since divisions with the power of two are in HW
only bit-shifts and zero padding.
The HW implementation of the algorithm is designed to
accept the input data of a single ECG signal as a nonrepeating
stream, meaning that the input logic only accepts as much
data as needed to fill up the input buffer; if 200 samples of a
block need to get overlapped with the next data block, only
500 additional input samples are added to construct the next
data block. The resulting QRS complex detection algorithm
in Figure 9(b) was implemented and tested with the Xilinx
XC2VP7 [24] development board. To prove the concept, an
addition of a soft-core microcontroller and a serial port interface were chosen for data transfer handling between the
development board and a PC.
4.
RESULTS AND DISCUSSION
The algorithm was developed on resampled data from the
MIT-BIH Arrhythmia Database. The database contains 48
half-hour ambulatory records. These records include complex ventricular, junctional, and supraventricular arrhythmias and conduction abnormalities. Several of these records
have interesting rhythm features, QRS morphology variations, and variety of changes in signal quality, thus representing “real-world” clinical conditions that may present difficulty to Arrhythmia detectors.
We tested standard performance measures such as the
sensitivity (Se) and the positive predictivity (+P). The Se reports the percentage of true beats that were correctly detected
by the algorithm, while the +P reports the percentage of beat
detections which were in reality true beats. The test results
presented in Tables 1 and 2 reflect the QRS complex detection
9
Table 1: Performance of the algorithm on the MIT-BIH Arrhythmia Database.
REC
AHB
TP
100
2273
2273
1865
1864
101
102
2187
2187
2084
2084
103
2229
2221
104
105
2572
2567
2027
2026
106
107
2137
2135
1763
1761
108
2532
2529
109
2124
2123
111
2539
2539
112
113
1795
1795
1879
1871
114
1953
1953
115
2412
2393
116
1535
1535
117
2278
2278
118
1987
1987
119
1863
1862
121
2476
2476
122
1518
1517
123
1619
1619
124
2601
2599
200
1963
1952
201
2136
2134
202
2980
2925
203
2656
2653
205
1860
1857
207
208
2955
2942
3005
3005
209
2650
2633
210
2748
2748
212
3251
3250
213
2262
2259
214
3363
3363
215
2208
2206
217
2154
2154
219
2048
2047
220
2427
2416
221
2483
2477
222
2605
2603
223
228
2053
2045
2256
2256
230
1571
1571
231
1780
1780
232
3079
3072
233
2753
2752
234
Total 109494 109294
FN
FP
0
1
0
0
8
5
1
2
2
3
1
0
0
8
0
19
0
0
0
1
0
1
0
2
11
2
55
3
3
13
0
17
0
1
3
0
2
0
1
11
6
2
8
0
0
0
7
1
200
0
4
0
0
14
34
0
0
85
0
0
0
0
5
0
3
0
0
0
1
0
0
0
3
2
0
18
0
5
3
0
4
0
0
0
0
1
0
0
0
1
0
11
0
0
6
0
0
200
FN + FP Se [%] +P [%]
0
5
0
0
22
39
1
2
87
3
1
0
0
13
0
22
0
0
0
2
0
1
0
5
13
2
73
3
8
16
0
21
0
1
3
0
3
0
1
11
7
2
19
0
0
6
7
1
400
100.00
99.95
100.00
100.00
99.64
99.81
99.95
99.91
99.89
99.88
99.95
100.00
100.00
99.57
100.00
99.21
100.00
100.00
100.00
99.95
100.00
99.93
100.00
99.92
99.44
99.91
98.15
99.89
99.84
99.56
100.00
99.36
100.00
99.97
99.87
100.00
99.91
100.00
99.95
99.55
99.76
99.92
99.61
100.00
100.00
100.00
99.77
99.96
99.82
100.00
99.79
100.00
100.00
99.37
98.69
100.00
100.00
95.40
100.00
100.00
100.00
100.00
99.73
100.00
99.87
100.00
100.00
100.00
99.95
100.00
100.00
100.00
99.88
99.90
100.00
99.39
100.00
99.73
99.90
100.00
99.85
100.00
100.00
100.00
100.00
99.95
100.00
100.00
100.00
99.96
100.00
99.46
100.00
100.00
99.66
100.00
100.00
99.82
10
EURASIP Journal on Advances in Signal Processing
Table 2: QRS complex detection performance compared to several algorithms (based on [15, Table II]).
QRS detector
Li et al. [12]
Saxena et al. [14]
Bahoura et al. [16]
Mart´nez et al. [15]
ı
This work
OSEA [4]
Lee et al. [11]
Hamilton and Tompkins [6]
Zong et al. [7]
Pan and Tompkins [2]
Afonso et al. [21]
Poli et al. [22]
Kunzmann et al. [10]
Aristotle SW [23]
∗
ANN
104182
103763
109809
109428
109494
91284∗
109486∗
109267
NA
109809
90909
109963
91283
109428
TP
104070
103664
109635
109208
109294
91105
109151∗
108927
NA
109532
90535
109522
NA
107567
FN
112
99
184
220
200
179
335
340
NA
277
374
441
NA
1861
FP
65
102
135
153
200
180
137
248
NA
507
406
545
NA
94
Error [%]
0.17
0.19
0.29
0.34
0.37
0.39
0.43
0.54
0.58
0.71
0.86
0.90
1.41
1.79
Se [%]
99.89
99.9
99.83
99.80
99.82
99.80
99.69
99.69
99.65
99.75
99.59
99.60
98.86
98.30
+P [%]
99.94
99.9
99.88
99.86
99.82
99.80
99.88
99.77
99.77
99.54
99.56
99.50
99.73
99.91
The numbers are recalculated.
performance obtained utilizing data blocks of 700 samples,
time delay of 20 milliseconds and eight data points for area
calculation. Because of initial data resampling to 250 samples per second, the obtained QRS complex locations were
recalculated to match the 360 samples per second data rate of
the original data and the attribute file. Then the performance
was tested applying a 40 milliseconds delay to the MIT-BIH
Arrhythmia Database. The first channel of all 48 two-channel
records throughout their entire length was used for testing
the performance of the algorithm.
The columns in Table 1 represent the record number
(REC), the number of heartbeats in the record (AHBs), the
number of correctly (true positive) (TP) detected heartbeats,
the number of missed (not detected) (FN) heartbeats, the
number of false positive (FP) detections, the sum of falsely
detected and missed heartbeats (FN + FP), the sensitivity (Se
[%]), and the positive predictivity (+P [%]), respectively.
The results in Table 1 were obtained by the algorithm
modified for nonrepeating data reception through a serial
link. The area calculation was performed on the data stream
and then partitioned to data blocks. In order to enable block
processing through the complete record, 1000 replicates of
the last data sample were added to the end of all records. The
algorithm was based on assumption that every block starts
at the last detected QRS complex, therefore data processing
starts 200 milliseconds after the block starts. This is also the
case for the first data block where the first 200 milliseconds
of data are not scanned for peaks, which leads to FN detections at the start of some records (207, 208, 210, 214, 220,
and 233).
The algorithm performs well and stable on all tested
records (Table 1); however, performance on two records is
far worse than on other records. The record 108 is problematic for many detection algorithms because of the first-degree
AV block and high and sharp P waves. The combination of
these two properties allows the P waves to qualify as the QRS
complexes and produce FP detections in several places in the
record. Detection performance on the record 203 mainly suffers from nondetected (FN) beats, mostly premature ventricular contractions (PVCs). The nondetected PVCs have low
amplitude and occur between two normal high-amplitude
beats. In such conditions, these beats either do not exceed
any of the detection threshold levels or exceed the lower detection threshold level, but there is no search-back.
To gain the sense of the algorithm performance on the
MIT-BIH Arrhythmia Database, a comparison of detection
results to a set of other well-known published algorithms is
reported in Table 2. The columns in Table 2 represent the
QRS detector (QRS detector), the number of tested (annotated) (ANN) heartbeats, the number of correctly (true positive) (TP) detected heartbeats, the number of missed (not
detected) (FN) heartbeats, the number of false positive (FP)
detections, percentage of falsely detected and missed heartbeats among all tested heartbeats (Error %), the sensitivity (Se [%]), and the positive predictivity (+P [%]), respectively.
With Se of 99.82% and +P of 99.82% the algorithm performs satisfactory when compared to other algorithms, and
outperforms the founding algorithm [11]. When the two algorithms are compared, it is interesting to see how the detection performance is influenced by different filtering and detection threshold level calculation. While our algorithm exhibits worse detection performance on, for example, records
104 and 108, it performs much better on, for example, record
222. We are confident that further algorithm improvements
would lead to even better QRS complex detection results. An
improvement in detection threshold level calculation could
prevent sudden baseline shifts or some QRS complexes from
raising the detection threshold level to a point where no QRS
is detected in a subsequent block, which in the record 203
happens at 108.4 seconds. Furthermore, incorporation of a
positive-negative wave pair detection mechanism similar to
other high-performance detection algorithms would exclude
sudden baseline shifts from the QRS candidate list.
Matej Cvikl et al.
11
Table 3: Performance of the algorithm on 43 records of the LTST DB.
REC
s20011
s20021
s20031
s20041
s20061
s20081
s20101
s20121
s20141
s20161
s20181
s20201
s20221
s20241
s20261
s20281
s20301
s20321
s20341
s20361
s20381
s20401
s20421
s20441
s20461
s20481
s20501
s20521
s20541
s20561
s20581
s20601
s20621
s20641
s30661
s30681
s30701
s30721
s30741
s30742
s30761
s30781
s30801
Total
AHB
100053
88963
109501
109304
117925
112979
78017
85526
116674
83698
106978
91477
119182
92439
102311
73076
106779
91929
100255
105688
102972
77333
92966
93127
98872
91455
142725
75336
115151
100816
84935
116943
112369
84854
144447
126651
107078
106636
123461
113767
117044
110087
94373
4426152
THB
99674
88598
109109
108993
117454
112553
77649
85220
116206
83355
106555
91058
118715
91997
101955
72808
106379
91586
99816
105380
102884
77048
92582
92737
98489
91117
142207
74957
114375
100391
84601
116488
111933
84426
143932
126101
106719
106234
123064
113317
116677
109635
94055
4409029
TP
99670
88597
109095
108977
117451
112553
77649
85210
116206
83337
106498
91057
118714
91997
101953
72807
106378
91542
99814
105377
102883
77046
92578
92735
98487
91027
142175
74918
114354
100370
84596
116365
111829
84423
143925
126097
106715
105818
122984
113311
115883
109231
84133
4396765
We then additionally tested the developed algorithm on
the 43 publicly accessible records [25] of the LTST DB. The
complete database contains 86 two- and three-channel 24hour annotated ambulatory records, where some records
present great difficulties for accurate QRS complex detection. The LTST DB contains records contaminated with lots
FN
4
1
14
16
3
0
0
10
0
18
57
1
1
0
2
1
1
44
2
3
1
2
4
2
2
90
32
39
21
21
5
123
104
3
7
4
4
416
80
6
794
404
9922
12264
FP
0
5
25
0
1
1
21
6
0
226
150
1
0
0
0
1
3
18
7
37
10
30
2
54
0
288
26
723
84
21
5
149
2320
44
26
145
4
7212
2
0
313
5359
10559
27878
FN + FP
4
6
39
16
4
1
21
16
0
244
207
2
1
0
2
2
4
62
9
40
11
32
6
56
2
378
58
762
105
42
10
272
2424
47
33
149
8
7628
82
6
1107
5763
20481
40142
Se [%]
100.00
100.00
99.99
99.99
100.00
100.00
100.00
99.99
100.00
99.98
99.95
100.00
100.00
100.00
100.00
100.00
100.00
99.95
100.00
100.00
100.00
100.00
100.00
100.00
100.00
99.90
99.98
99.95
99.98
99.98
99.99
99.89
99.91
100.00
100.00
100.00
100.00
99.61
99.93
99.99
99.32
99.63
89.45
99.72
+P [%]
100.00
99.99
99.98
100.00
100.00
100.00
99.97
99.99
100.00
99.73
99.86
100.00
100.00
100.00
100.00
100.00
100.00
99.98
99.99
99.96
99.99
99.96
100.00
99.94
100.00
99.68
99.98
99.04
99.93
99.98
99.99
99.87
97.97
99.95
99.98
99.89
100.00
93.62
100.00
100.00
99.73
95.32
88.85
99.37
of noises, arrhythmias, and in addition to this, also severe transient ischemic changes. The algorithm was tested
on the first channel of each of the 43 records with the
first five minutes of each record excluded from performance
analysis. In this way, the algorithm performance was tested
on 4409029 out of 4426152 beats and the results for QRS
12
detection Se and +P were 99.72% and 99.37%, respectively,
as shown in Table 3. The performance of the OSEA algorithm on the same data set is 99.79% for Se and 99.37%
for +P. The columns in Table 3 represent the record number
(REC), the number of all heartbeats in the record (AHBs),
the number of tested heartbeats (THBs), the number of correctly (true positive) (TP) detected heartbeats, the number of missed (not detected) (FN) heartbeats, the number of false positive detections (FP), the sum of falsely
detected and missed heartbeats (FN + FP), the sensitivity
(Se [%]), and the positive predictivity (+P [%]), respectively.
We tried to compare our work with other works in this
field, but there is lack of papers that describe detection results
of modified QRS complex detection algorithms and their
HW implementations. Therefore, our work can only be paralleled to [26, 27]. Two HW implementations of a QRS complex detector are described in [26]. One implementation is a
modification of the well-known Hamilton-Tompkins [6] detector and the other is a single-scale (W2 4 ) WT-based QRS
complex detector. Only modest performance results were
given and only descriptive comparisons of the results were
made to [13]. As both [13, 26] were tested on the AHA
database [28], we could not compare the performance of
those two algorithms with the performance of our algorithm.
When the size and speed of the design are compared to the
design in [26], large differences can be seen. The QRS complex detection algorithm in [26] uses less than 1% of the
Xilinx XC2V3000-6 [24] device resources and can operate
at 34 MHz. Our QRS complex detection algorithm together
with all communication logic uses approximately 17% of
the XC2V3000 device resources, but the estimated operating speed of the device is 82 MHz. In [27], a lifting WTbased FPGA implementation of a QRS complex detection algorithm is presented, but no accurate performance results are
supplied. While these two works present pure HW solutions
to QRS complex detection (except coefficient prelearning in
[27]), the HW/SW solution in [29] uses the FPGA as a coprocessor engine for cross-correlation coefficient calculation.
An important feature of the HW implementation of the
algorithm is data processing speed. To obtain the most comparable results of both HW and SW implementations, a comparison of block processing speed in the HW and SW implementations was made. The time needed to find all peaks in
one block and determine QRS complex locations was measured. In average, approximately 132 μs were required by the
HW implementation to perform these operations, while for
the SW implementation in average it took approximately
120 μs to perform the same operations. It needs to be singled
out that the operating frequency of the HW implementation
was only 5 MHz, while the SW implementation ran on an
AMD Athlon 2500+ processor with the operating frequency
of 1.8 GHz. Taking into consideration that the HW implementation can operate at 80 MHz, we can conclude that the
HW implementation can process data up to 14 times faster
than SW implementation. This means that in the same time
the HW device can process up to 14 times more data than a
PC.
EURASIP Journal on Advances in Signal Processing
5.
CONCLUSION
An ECG beat detection algorithm based on delay-coordinate
mapping was presented in this paper. Heartbeat detection
was based on the size of the area created in a 2D geometrical
plane by the ECG signal and its time delayed copy. The algorithm processes blocks of data and is applicable in systems
where true real-time beat detection is not needed, but the
data can rather be grouped into blocks and then processed.
Outperforming the founding algorithm, the QRS complex
detection performance of the proposed algorithm is comparable to other detection algorithms. With Se of 99.82% and
+P of 99.82% on the MIT-BIH Arrhythmia Database the algorithm is superior to a large number of well-known algorithms. The performance was additionally tested on the LTST
DB, where Se of 99.72% and +P of 99.37% were achieved.
The algorithm was implemented in both SW and HW, where
with all communication logic and without any code optimization it fits into the Xilinx XC3S400 device. Besides good
detection results, the HW implementation of the algorithm
excels itself with high data processing speed and the possibility of multiplying data processing cores in a single FPGA device. Being 14 times faster than the SW solution, the HW solution represents a valuable contribution to ECG signal processing, either as an easily upgradeable stand-alone beat detector or as a very powerful coprocessing engine.
REFERENCES
[1] B.-U. Kă hler, C. Hennig, and R. Orglmeister, “The principles
o
of software QRS detection,” IEEE Engineering in Medicine and
Biology Magazine, vol. 21, no. 1, pp. 42–57, 2002.
[2] J. Pan and W. J. Tompkins, “A real-time QRS detection algorithm,” IEEE Transactions on Biomedical Engineering, vol. 32,
no. 3, pp. 230–236, 1985.
[3] N. V. Thakor, J. G. Webster, and W. J. Tompkins, “Estimation
of QRS complex power spectra for design of a QRS filter,”
IEEE Transactions on Biomedical Engineering, vol. 31, no. 11,
pp. 702–706, 1984.
[4] P. S. Hamilton, Open Source ECG Analysis Software Documentation, E. P. Limited, Somerville, Mass, USA, 2002.
[5] R. G. Mark, P. S. Schluter, G. B. Moody, P. Devlin, and D. Chernoff, “An annotated ECG database for evaluating arrhythmia
detectors,” in Proceedings of the 4th Annual Conference of IEEE
Engineering in Medicine and Biology Society on Frontiers of Engineering in Health Care, pp. 205–210, IEEE Computer Society
Press, Philadelphia, Pa, USA, 1982.
[6] P. S. Hamilton and W. J. Tompkins, “Quantitative investigation of QRS detection rules using the MIT/BIH arrhythmia database,” IEEE Transactions on Biomedical Engineering,
vol. 33, no. 12, pp. 1157–1165, 1986.
[7] W. Zong, G. B. Moody, and D. Jiang, “A robust open-source
algorithm to detect onset and duration of QRS complexes,” in
Computers in Cardiology, vol. 30, pp. 737–740, Thessaloniki,
Chalkidiki, Greece, September 2003.
[8] I. I. Christov and T. V. Stoyanov, “Steep slope method for real
time QRS detection,” Electrotechnics & Electronics E+E, vol. 12, pp. 13–17, 2002.
[9] I. I. Christov, “Real time electrocardiogram QRS detection using combined adaptive threshold,” Biomedical Engineering Online, vol. 3, no. 1, p. 28, 2004.
Matej Cvikl et al.
[10] U. Kunzmann, G. von Wagner, J. Schă chlin, and A. Bolz, Pao
rameter extraction of ECG signals in real-time,” Biomedizinische Technik, vol. 47, supplement 1 part 2, pp. 875–878, 2002.
[11] J.-W. Lee, K.-S. Kim, B. Lee, B. Lee, and M.-H. Lee, “A real time
QRS detection using delay-coordinate mapping for the microcontroller implementation,” Annals of Biomedical Engineering,
vol. 30, no. 9, pp. 1140–1151, 2002.
[12] C. Li, C. Zheng, and C. Tai, “Detection of ECG characteristic points using wavelet transforms,” IEEE Transactions on
Biomedical Engineering, vol. 42, no. 1, pp. 21–28, 1995.
[13] S. Kadambe, R. Murray, and G. F. Boudreaux-Bartels, “Wavelet
transform-based QRS complex detector,” IEEE Transactions on
Biomedical Engineering, vol. 46, no. 7, pp. 838–848, 1999.
[14] S. C. Saxena, V. Kumar, and S. T. Hamde, “Feature extraction from ECG signals using wavelet transforms for disease
diagnostics,” International Journal of Systems Science, vol. 33,
no. 13, pp. 1073–1085, 2002.
[15] J. P. Mart´nez, R. Almeida, S. Olmos, A. P. Rocha, and P. Laı
guna, “A wavelet-based ECG delineator: evaluation on standard databases,” IEEE Transactions on Biomedical Engineering,
vol. 51, no. 4, pp. 570–581, 2004.
[16] M. Bahoura, M. Hassani, and M. Hubin, “DSP implementation of wavelet transform for real time ECG wave forms detection and heart rate analysis,” Computer Methods and Programs
in Biomedicine, vol. 52, no. 1, pp. 35–44, 1997.
[17] F. Jager, A. Taddei, G. B. Moody, et al., “Long-term ST
database: a reference for the development and evaluation of
automated ischaemia detectors and for the study of the dynamics of myocardial ischaemia,” Medical and Biological Engineering and Computing, vol. 41, no. 2, pp. 172–182, 2003.
[18] D. L. Perry, VHDL: Programming by Example, McGraw-Hill,
New York, NY, USA, 2002.
[19] P. A. Lynn, “Online digital filters for biological signals: some
fast designs for a small computer,” Medical and Biological Engineering and Computing, vol. 15, no. 5, pp. 534–540, 1977.
[20] F. Jager, “QRS complex detection in electrocardiogram,” M.S.
thesis, University of Ljubljana, Ljubljana, Slovenia, 1984.
[21] V. X. Afonso, W. J. Tompkins, T. Q. Nguyen, and S. Luo,
“ECG beat detection using filter banks,” IEEE Transactions on
Biomedical Engineering, vol. 46, no. 2, pp. 192–202, 1999.
[22] R. Poli, S. Cagnoni, and G. Valli, “Genetic design of optimum
linear and nonlinear QRS detectors,” IEEE Transactions on
Biomedical Engineering, vol. 42, no. 11, pp. 1137–1141, 1995.
[23] G. B. Moody and R. G. Mark, “Development and evaluation of
a 2-lead ECG analysis program,” in Computers in Cardiology,
pp. 39–44, Seattle, Wash, USA, 1983.
[24] Xilinx, />[25] “Long-Term ST Database at Physionet,” />physiobank/database/ltstdb/.
´
[26] M. M. Peiro, F. Ballester, G. Paya, J. Belenguer, R. Colom, and
R. Gadea, “FPGA custom DSP for ECG signal analysis and
compression,” in Proceedings of the 14th International Conference on Field Programmable Logic and Application (FPL ’04),
vol. 3203 of Lecture Notes in Computer Science, pp. 954–958,
Leuven, Belgium, August-September 2004.
[27] K. Kuzume, K. Niijima, and S. Takano, “FPGA-based lifting
wavelet processor for real-time signal detection,” Signal Processing, vol. 84, no. 10, pp. 1931–1940, 2004.
[28] R. E. Hermes, D. B. Geselowitz, and G. C. Oliver, “Development, distribution, and use of the American heart association database for ventricular arrhythmia detector evaluation,”
in Computers in Cardiology, pp. 263–266, Williamsburg, Va,
USA, October 1980.
13
[29] A. Rosado, M. Bataller, J. F. Guerrero, J. Calpe, J. V. Franc´ s,
e
and J. R. Magdalena, “High performance hardware correlation
coefficient assessment using programmable logic for ECG signals,” Microprocessors and Microsystems, vol. 27, no. 1, pp. 33–
39, 2003.
Matej Cvikl received his B.S. degree in electrical engineering from the Faculty of Electrical Engineering, University of Ljubljana,
in 2002. Since then, he has been working as HW and System Design Engineer. In
October 2004, he started working towards
the Ph.D. degree at the Faculty of Electrical Engineering, supported by Ministry
of Higher Education, Science and Technology. His current research includes HW/SW
codesign in the area of ECG signal processing on FPGAs.
Franc Jager received a Ph.D. degree in computer and information science from the
University of Ljubljana, in 1994. Currently,
he is a Full Professor in the Faculty of Computer and Information Science at the University of Ljubljana, and a Research Affiliate at the Massachusetts Institute of Technology, Cambridge. His research interests
include biomedical signal processing and
medical imaging, and biomedical computer
systems.
Andrej Zemva received his B.S., M.S., and
Ph.D. degrees in electrical engineering from
the University of Ljubljana, in 1989, 1993,
and 1996, respectively. He is Associate Professor at the Faculty of Electrical Engineering. His current research interests include
HW/SW codesign, logic synthesis and optimization, test pattern generation, and fault
modeling.