Báo cáo hóa học: " Multi-scale ordering of self-assembled InAs/GaAs(001) quantum dots" pdf
Bạn đang xem bản rút gọn của tài liệu. Xem và tải ngay bản đầy đủ của tài liệu tại đây (652.95 KB, 10 trang )
Abstract Ordering phenomena related to the self-
assembly of InAs quantum dots (QD) grown on
GaAs(001) substrates are experimentally investigated
on different length scales. On the shortest length-scale
studied here, we examine the QD morphology and
observe two types of QD shapes, i.e., pyramids and
domes. Pyramids are elongated along the [1–10]
directions and are bounded by {137} facets, while do-
mes have a multi-facetted shape. By changing the
growth rates, we are able to control the size and size
homogeneity of freestanding QDs. QDs grown by
using low growth rate are characterized by larger sizes
and a narrower size distribution. The homogeneity of
buried QDs is measured by photoluminescence spec-
troscopy and can be improved by low temperature
overgrowth. The overgrowth induces the formation of
nanostructures on the surface. The fabrication of self-
assembled nanoholes, which are used as a template to
induce short-range positioning of QDs, is also investi-
gated. The growth of closely spaced QDs (QD mole-
cules) containing 2–6 QDs per QD molecule is
discussed. Finally, the long-range positioning of self-
assembled QDs, which can be achieved by the growth
on patterned substrates, is demonstrated. Lateral QD
replication observed during growth of three-dimensional
QD crystals is reported.
Keywords Self-assembly Æ Semiconductor quantum
dots Æ Photoluminescence
Introduction
Over the last decade semiconductor quantum dots
(QDs) have attained much interest due to their
electronic properties characterized by discrete atomic-
like energy levels [1, 2]. Nowadays, self-assembled
QDs are widely used as a playground to study novel
physical phenomena such as cavity quantum electro-
dynamics [3, 4], as well as building blocks for high
performance QD-based devices [1, 5]. In general,
understanding the formation and evolution of self-
assembled QDs on any specific length scale is required
in order to fully engineer the QD structures.
Recently, several concepts on the ordering of self-
assembled QD systems on different length scales have
been proposed and demonstrated [6–8]. With reference
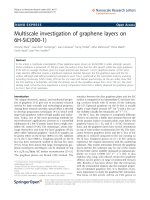
to Fig. 1, we can describe the route towards ordering of
self-assembled QDs at different length scales. At the
shortest length scale, we consider the ordering at the
level of individual QDs, which can be sub-divided into
ordering in shape, size, and composition. The QD
shape can be ordered under certain conditions, i.e., a
monomodal distribution of QD shapes can be
obtained. The formation, evolution and shape transi-
tions are also discussed in this context. We can improve
QD size and composition homogeneity by changing the
QD growth conditions. The QD overgrowth procedure
plays also an important role in determining the degree
of order. The concept of order can be extended to the
spatial arrangement of QDs. Groups of closely spaced
QDs, termed lateral QD molecules, can be obtained by
means of an in situ etching technique. The etching
produces self-assembled nanoholes which can be used
as a template to guide the formation of QD molecules.
The longest length scale of ordering in self-assembled
S. Kiravittaya (&) Æ R. Songmuang Æ A. Rastelli Æ
H. Heidemeyer Æ O. G. Schmidt
Max-Planck-Institut fu
¨
r Festko
¨
rperforschung,
Heisenbergstrasse 1, D-70569 Stuttgart, Germany
e-mail:
Nanoscale Res Lett (2006) 1:1–10
DOI 10.1007/s11671-006-9014-8
123
NANO REVIEW
Multi-scale ordering of self-assembled InAs/GaAs(001) quantum
dots
S. Kiravittaya Æ R. Songmuang Æ A. Rastelli Æ
H. Heidemeyer Æ O. G. Schmidt
Published online: 25 July 2006
Ó to the authors 2006
QDs is the absolute positioning. This can be achieved
by growing QDs on patterned substrates.
In this paper, we will present a route to achieve
QD ordering on multiple length scales. The experi-
mental observations are based on the self-assembled
InAs/GaAs QD system. The route starts with the
shape of freestanding QDs, followed by the homoge-
neity of buried QDs. The local QD positioning and
the fabrication of short-range ordered QDs (QD
molecules) are also reported. Finally, we briefly
present our recent results on the long-range posi-
tioning of self-assembled QDs on patterned
substrates.
QD shapes
The surface morphology of InAs QDs grown on
GaAs(001) has received relatively little attention
compared to the QD electronic and optical proper-
ties. This is mainly due to the nanometric size of the
QDs, which renders it difficult to obtain detailed
information from commonly used atomic force
microscopy (AFM). Under usual growth conditions,
the QD surface is bounded by well-defined crystal
planes. By taking advantage of the high resolution of
scanning tunneling microscopy (STM), Ma
´
rquez et al.
[9] have identified the facets composing the surface of
small QDs as {137}. By using reflection high-energy
electron diffraction (RHEED) [10], transmission
electron microscopy (TEM) [11], and STM [12], steep
facets, such as {101}, have been observed on the
surface of larger QDs. The detailed shape of such
QDs has been revealed by a facet analysis of STM
data [13, 14], allowing to draw a coherent picture
describing the QD morphology. Similarly to the well-
characterized SiGe/Si(001) material system [8, 15],
two facetted morphologies have been identified: small
and shallow {137}-facetted pyramids and larger multi-
facetted domes.
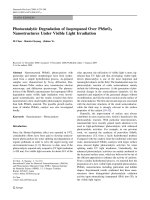
Figure 2a shows a three-dimensional (3D) view of
an STM image of InAs QDs on a flat GaAs(001)
surface [12]. The QDs are grown by a solid-source
molecular beam epitaxy system at a low growth rate of
0.01 monolayers/s (ML/s) and a relatively high sub-
strate temperature (500 ° C). From this measurement
we observe small elongated InAs pyramids and large
multi-facetted domes [12]. A schematic picture of
pyramidal QDs is shown in Fig. 2b. As one clearly sees
from the STM image (Fig. 2a), the dome-shaped QDs
are much larger than the pyramid-shaped QDs. In
agreement with previous reports [16] and with what is
observed in the SiGe system [17], we believe that a
morphological transition occurs from pyramid to dome
shape when the amount of deposited material is in-
creased or the system ripens during in situ annealing.
The analysis of the dome shape reveals several facet
planes. The facets with largest area have {101} indices.
Smaller {111} facets are also observed at the QD base.
The {137} facets are still observed at the top and bot-
tom of the dome, indicating that during the shape
transition, steep facets form and expand while the {137}
facets shrink. A schematic representation of a dome-
shaped QD is shown in Fig. 2c. On the atomic-scale,
the surface reconstruction of the {137} facets was
reported in Ref. [9]. The (1 · 1)-reconstructed {101}
Fig. 1 Route towards controlling the ordering of self-assembled
QD structures. Scale bar corresponds to 500 nm
Fig. 2 (a) 3D view STM image of pyramid-shaped and dome-
shaped InAs QDs on a flat GaAs(001) surface. Schematic
representation of (b) a pyramid and (c) a dome. Data courtesy of
C. Manzano, G. Costantini, Nanoscale Science Department,
Max-Planck-Institute Stuttgart
2 Nanoscale Res Lett (2006) 1:1–10
123
facets and the (2 · 2)-reconstructed {111} facets of the
domes were studied in Ref. [13].
Ordering in QD size
Free-standing QDs
The size fluctuation of self-assembled QDs grown
under typical growth conditions is about ±10% [18].
However, the size homogeneity can be improved by
optimizing the growth conditions [6]. Figure 3 shows
the histogram of the height distribution of InAs QDs
grown at 500 °C using different growth rates. The 3D
AFM images of QDs on the surface are shown in the
insets. We clearly see that the lower growth rate
induces larger QDs with better size homogeneity [6,
19]. We can explain this effect by different migration
lengths of In adatoms [20]. At a low growth rate (large
migration length), the In adatoms are preferentially
incorporated into existing QDs, rather than forming
new QDs. The long migration length produces also a
better size homogeneity of the QD array. This can be
explained by the fact that when In adatoms can migrate
longer, they have a higher chance of finding a lower
energy position to be incorporated. Since larger QDs
produce higher strain barriers, the In adatoms prefer to
incorporate into smaller QDs. Such an effect is called
self-limiting growth [21].
For general electronic and optical applications,
burying the QDs in higher band gap material is of
interest. Photoluminescence (PL) spectroscopy is a
typical tool for the investigation of the buried QD
structure. Figure 4 shows room temperature PL spec-
tra obtained from QDs, which were grown under the
same growth conditions as the QDs shown in Fig. 3,
but were overgrown with GaAs layers. The PL line-
width obtained from a QD ensemble is generally
attributed to the inhomogeneous broadening produced
by the size and composition fluctuations of the QDs in
the ensemble. The variation of the PL linewidth as well
as the PL peak energy are well consistent with the QD
size and size distribution observed by AFM, i.e., the
larger QDs with narrower size distribution provide
longer wavelength emission with narrower emission
linewidth [19, 20, 22].
Buried QDs
The size, shape, and composition of QDs in an array
are affected not only by the QD growth conditions but
also by the overgrowth conditions. The influence of the
substrate temperature during GaAs overgrowth has
been investigated by PL spectroscopy [19, 22]. Figure 5
shows room temperature PL spectra of 1.8 ML InAs
Fig. 3 Height histograms of 1.8 ML InAs QDs grown at
different InAs growth rates of (a) 0.01 ML/s, (b) 0.05 ML/s,
and (c) 0.2 ML/s. Insets show the corresponding 1 · 1 lm
2
AFM
images
Fig. 4 Room temperature PL spectra of 1.8 ML InAs QDs
grown at different InAs growth rates of (a) 0.01 ML/s,
(b) 0.05 ML/s, and (c) 0.20 ML/s
Nanoscale Res Lett (2006) 1:1–10 3
123
QDs grown at 500 °C and overgrown by GaAs at lower
overgrowth temperature (460 °C). We observe that the
PL spectra are significantly narrower and red shift
compared to QDs overgrown at 500 °C (Fig. 4). This
observation can be attributed to the suppression of
In-Ga intermixing. Moreover, the low temperature
growth is expected to preserve the shape of buried
QDs [23, 24].
Since all QDs experience an evolution in size, shape
and composition during overgrowth, the overgrowth
process can induce another degree of inhomogeniety.
By limiting this evolution the homogeneity of the
buried QDs would improve. It is worth to note that the
composition inhomogeniety induced by In-Ga inter-
mixing as well as the QD size and shape evolution
during the overgrowth process can also be hindered by
using a strain-reducing layer [6, 25].
We performed a systematic investigation of the
surface morphology evolution during the overgrowth
process. Figure 6 shows AFM images of InAs QDs
overgrown with GaAs at 460 °C[23]. We observe a
drastic collapse of the QD height. At the early stage of
GaAs deposition, the covered QDs transform from
dome-like shapes to elongated structures along the
[1–10] direction. For 3 ML GaAs thickness, the
remaining QDs can still be identified in the middle of
the mound structures. These mounds have a size of
120–160 nm along the [1–10] direction and 50–70 nm
along the [110] direction. The elongation is attributed
to the anisotropy of Ga diffusion during growth [26].
Interestingly, after the deposition of 6 ML GaAs, we
observed the formation of holes in the middle of the
elongated nanostructures. The tiny holes (20–30 nm
wide and ~1.5 nm deep) provide evidence of non-
preferential GaAs growth on top of the QDs due to
strain effects [27].
Spatial ordering of QDs on the short-range scale:
QD molecule formation
Apart from controlling the size and improving the size
homogeneity of QDs, there is growing interest to
locally control the positioning of QDs. In particular,
closely-spaced QDs can act as ‘‘QD molecules’’, which
are interesting, both as a new playground for studying
interacting electronic systems and for their potential
application as building blocks of quantum information
processing devices [28]. In fact, single QDs can be used
as one [29, 30] or two ‘‘qubit’’ [31] systems, but cannot
be scaled to perform complex operations. For this
purpose, chains or groups of QDs are required. A rel-
atively simple way to fabricate vertical QD molecules is
to grow stacks of QDs [32]. The main disadvantage of
this approach is that the composition and strain state of
the different layers are usually different and, most
importantly, it is hard to envision a controlled tuning of
the QD potential profiles, especially of the barrier
Fig. 5 Room temperature PL spectra of 1.8 ML InAs QD grown
at 500 °C with the indicated InAs growth rates and capped with
GaAs at a lower growth temperature (460 °C)
Fig. 6 Surface morphologies of 1.8 ML InAs QDs capped with
the indicated amount of GaAs at a lower growth temperature.
The panels on the right side show corresponding 3D magnified
images of nanostructures on the surface
4 Nanoscale Res Lett (2006) 1:1–10
123
between them. Therefore, a lateral geometry is desir-
able. Recently, we have reported on a simple route to
fabricate lateral QD-molecules, based on the use of
hierarchical self-assembly. In hierarchically self-
assembled structures the result of a self-assembly step
is used as the starting point for the subsequent step.
Here, the starting point is represented by InAs/
GaAs(001) QDs. QDs are buried with a thin GaAs
layer and then an in situ etching step is applied. AsBr
3
gas is used as etchant. The strain modulation from the
buried InAs QDs increases the etching rate of GaAs
[33], leading to the spontaneous formation of holes on
the GaAs overgrowth surface [33, 34].
The process of nanohole fabrication is illustrated in
Fig. 7. An AFM image of the surface morphology of
InAs QDs capped with 10-nm GaAs is shown in
Fig. 7a. When the etching step is applied, the hole
depth and width increase (Fig. 7b–d) with increasing
nominal etching depth. (The nominal etching depth is
defined as the amount of material removed from an
unstrained GaAs(001) substrate under the same etch-
ing conditions). The size of these self-assembled
nanoholes can be manipulated by changing the etching
times. The 5-nm nominal etched nanoholes (Fig. 7d),
with an average depth of about 6 nm, are used as a
template to fabricate groups of closely spaced InAs
QDs (QD molecules).
Figure 8a shows an ensemble of lateral QD
bi-molecules (QDBM), obtained by overgrowing the
self-assembled nanohole with 2.5 ML InAs at 500 °C.
The QDBMs are rather homogeneous in size and the
number of isolated QDs can be reduced by growing
the nanohole template on a slightly rough surface [35].
Moreover, QDBMs are aligned along the [1–10]
direction possibly because of the anisotropic hole
shape and anisotropic In diffusion [36]. The number of
QDs per QD-molecule can be tuned [37, 38] to a cer-
tain extent by changing the InAs growth conditions
(Fig. 8b–d). For instance, QD-quad- and hexa- mole-
cules can be obtained by depositing 2.0 ML InAs and
1.8 ML InAs at 450 °C on the nanohole template. For
a statistical analysis we select different samples grown
under growth conditions, where the percentage of a
certain n-fold QD molecule is particularly high. For
2.5 ML InAs deposition at 500 °C, we obtain 59% bi-
molecules and 40% isolated dots, while for 2 ML InAs
deposition at 470 °C, we obtain 52% quad-molecules,
28% tri-molecules, 4% bimolecules, and 16% others.
In the case of 1.8-ML InAs deposition at 450 °C, we
obtained 32% hexa-molecules, 22% penta-molecules,
8% hepta-molecules and 38% others. We observe that
the maximum percentage of n-fold QD molecules de-
creases with increasing n (see Fig. 9). n-fold QD mol-
ecules with large n tend to form when the InAs growth
is performed at lower substrate temperature, because
In adatoms have a higher probability to nucleate new
islands before possibly being incorporated into existing
QD molecules. We note that the formation of QD
molecules with even multiplicity tend to have a higher
probability than that of QD molecules with odd n.We
attribute this effect to the two-fold symmetry of the
hole structure.
Fig. 7 Surface morphology of 1.8 ML InAs QDs capped with 10-
nm GaAs and etched with AsBr
3
in situ etching gas for (a) 0 nm,
(b) 1 nm, (c) 3 nm, and (d) 5 nm nominal etching depth. The
panels on the right side show corresponding 3D magnified
images of nanostructures on the surface
Fig. 8 3D view AFM images of (a) QDBM ensemble, (b)a
single QDBM, (c) a single QD quad-molecule, and (d)aQD
hexa-molecule
Nanoscale Res Lett (2006) 1:1–10 5
123
In order to gather insight into the formation mech-
anism and into the optical properties of QDBMs, we
performed AFM and PL spectroscopy investigations.
The samples for this study consisted of nanoholes
overgrown with different amounts of InAs. Fig. 10a
shows representative AFM images illustrating the
hole-filling process. (The 5-nm etched and 2.5 ML
InAs filled hole structures are shown in Figs. 7d and 8a,
respectively.) From the AFM data, we observe that the
hole is still preserved after overgrowth with 0.2 ML
InAs. QDBMs start to form at an InAs coverage be-
tween 1.6 and 2.0 ML and then they evolve into fully
developed QDBMs at a coverage of 2.5 ML. For the
PL investigations the InAs layer was overgrown with a
thick GaAs layer. For the nanoholes obtained by 5-nm
nominal etching depth, the wetting layer (WL) signal
at 1.414 eV is the dominant peak, indicating that the
underlying QDs are completely removed and only the
WL remains. At 0.2 ML InAs deposition, we observe
another peak, which is attributed to the second InAs
layer that partially fills the etched holes. For 1.6 ML
InAs deposition, a third peak appears at smaller
energies, which is appointed to the initial stage of
the QDBM formation. The linewidth of the peak is
29 meV, indicating a good size uniformity of the
QDBMs. Figure 10c contains a summary of the PL
peak position at room temperature as a function of
deposited amount of InAs. The WL signal is the
dominant peak up to 1.6 ML InAs deposition and then
the peak from the QDs in the second layer can be
observed. It is noteworthy that for 2.5 ML InAs
deposition, the QDBMs emit at 0.972 eV, have a
linewidth of 30 meV (see inset of Fig. 10c), and the PL
intensity is comparable to the original QD layer, which
underlines a good size uniformity of the structure and
the high crystal quality of the samples, respectively.
While short-range spatial ordering can be achieved
by combining several self-assembly steps, it is hard to
envision spontaneous long-range ordering of QDs
required to address single QDs. The most promising
strategy to achieve this goal is to combine the bottom-
up approach with the top-down as discussed in the next
section.
Fig. 9 Maximum percentage of dominant QD molecules as a
function of the number of QDs per QD molecule
Fig. 10 (a) 3D view AFM images of surface structures obtained
by overgrowing nanoholes with 0.2 ML, 1.6 ML, 1.8 ML and
2.0 ML InAs. (b) Low-temperature PL spectra of the structures
developed during the QDBM fabrication process. (c) Observed
room-temperature PL peak energy versus amount of deposited
InAs to fill the nanoholes. Inset in (b) shows a room temperature
spectrum obtained from the QDBM grown by depositing 2.5 ML
InAs on the surface with self-assembled holes
6 Nanoscale Res Lett (2006) 1:1–10
123
Spatial ordering of QDs on the long-range scale:
Quantum dot crystals
As shown in the previous section, the positioning of
self-assembled QDs can be well controlled on a short
length scale. In this section, we present a successful
method to position self-assembled QDs on the long-
range scale by the growth of InAs on patterned sub-
strates. The patterned substrates were prepared by
standard electron-beam lithography and reactive ion
etching using SiCl
4
. Details of the pattern preparation
have been reported elsewhere [39]. Figure 11a shows a
3D AFM image of a patterned hole surface aligned
along [100] and [010] directions. The molecular beam
epitaxial growth is performed on this patterned sur-
face. After deposition of an 18 ML GaAs buffer, an
enlargement of the hole diameter and a reduction of
the hole depth are observed (Fig. 11b). When the
deposition proceeds further the holes become facetted
(Fig. 11c) [40]. Using these nanoholes as a template for
the InAs growth, we can obtain QDs in the patterned
holes as shown in Fig. 11d.
Homogeneous and ordered QD arrays can be fab-
ricated by overgrowing the QDs in the patterned holes
(Fig. 11d) with a Ga(Al)As capping layer followed by
a second InAs QD layer. Figure 12a shows AFM
images of a QD array on a flat surface obtained by this
procedure. The patterns in this case have 160-nm
periodicity. Typically, long-range ordering is observed
on the sample. Figure 12b shows a large-scale AFM
image (8 · 10 lm
2
) which contains no QD defects
(QD vacancies or QD interstitial defects). From the
analysis of height and diameter of each QD in this
array, we obtain an average QD height (diameter) of
14.7 nm (67 nm). Remarkably, a narrow size distribu-
tion of about 5% is observed (Fig. 12c) [41]. Such a
narrow size distribution implies an improvement of the
QD size homogeneity due to the pattern.
Once a homogeneous array of QDs is realized, a 3D
ordered QD structure, a so-called QD crystal, can be
obtained. Figure 13 shows AFM images of the topmost
QD layers of 3D QD crystals grown on patterned hole
surfaces. The pattern periodicity is 210 nm. This QD
crystal is grown under optimized conditions for this
pattern periodicity. The first QD layer on the patterned
holes is capped with a spacer layer consisting of 8 nm
GaAs, 4 nm Al
0.4
Ga
0.6
As and 3 nm GaAs. A sub-
sequent 1.8 ML InAs QD layer is grown on top.
Repetitive growth of the spacer layer and the QD layer
Fig. 11 3D view AFM images of (a) initial patterned hole
surface, patterned hole surface overgrown with (b) 18 ML and
(c) 36 ML GaAs buffer layer and (d) patterned hole surface after
18 ML GaAs buffer layer growth and 2 ML InAs. On the right
side of (c) and (d) magnified images are shown
Fig. 12 (a) 3D view AFM images of a homogeneous ordered QD array on flat GaAs surface. (b) Large area AFM image of the same
sample. (c) Height and diameter distributions extracted from the AFM image
Nanoscale Res Lett (2006) 1:1–10 7
123
results in a 3D QD crystal. This is illustrated for six
InAs QD layers in Fig. 13b and eleven InAs QD layers
in Fig. 13c. Since the strain field from buried QDs
predefines the QD formation positions, the number of
QD defects (QD vacancies or QD interstitial defects)
on the surface is as low as 0.043%. Therefore, we can
realize a 3D QD crystal with high structural perfection
[39]. As clearly seen in Fig. 13b, the ordered QDs form
on top of a ridge structure aligned along [1–10] direc-
tion. This ridge, which has a width of ~100 nm and a
height of ~3 nm above the flat surface, is caused by an
overlap of elongated mound structures that occur
during overgrowth of large QDs grown at low growth
rate [23]. The height of the surface QDs measured
from the top part of the ridge is about 5.6 nm. The
small QD size might be due to a redistribution of InAs
material in the ridge. The height distribution has a
relative width of 10% for the sixth QD layer (Fig. 12b)
and 7% for the eleventh QD layer (Fig. 12c).
Interestingly, if we look closer at the shape of sur-
face QDs in the six-fold stacked QD crystal, we
observe that some QDs consist of two peaks on top of a
common base area. (We call these structures QD
pairs). When the number of stacked layers increases to
eleven, we observe both well-defined QD pairs and
single QDs on the patterned sites. All QD pairs on the
surface align along the [1–10] direction. Each QD pair
is found at the center of the patterned site. This
observation directly implies that the QDs that make up
a QD pair form in the vicinity of the buried QD po-
sition. The QD pair formation is much less pronounced
on the unpatterned surface, where only very few QD
pairs have formed in the eleventh layer [42].
Magnified 3D AFM images and lateral peak-to-peak
distance as well as base width distributions of QD pairs
in the sixth layer are shown in Figs. 14a and b, respec-
tively. An average peak-to-peak distance of 26 nm is
observed for this QD layer. A statistical analysis shows
that 20% of the patterned sites are occupied by QD
pairs. The number of sites occupied by the QD pairs
slightly decreases to 16% while the peak-to-peak
distance increases to 44 nm for the QD pairs in the
eleventh layer (Fig. 14d). This result implies that
the stacking of QD pairs can also lead to single QDs in
the subsequent layers as has been reported for random
QD arrays [32]. For the QDs on the unpatterned
surface (not shown), we count only 3% of QD pairs.
In order to account for our experimental observa-
tion, we perform kinetic Monte-Carlo (KMC) simula-
tions to investigate the preferential nucleation sites of
Fig. 13 3D view AFM images
of surface QDs in 3D QD
crystals containing (a) two,
(b) six, and (c) eleven InAs
QD layers. The ridge
structure developing during
the overgrowth of QDs is
clearly visible in (b) and (c)
Fig. 14 (a) 3D view of a QD
pair on the surface of a QD
crystal with 6 QD layers. (b)
Statistical data obtained from
QD pairs observed in the
same sample. (c) 3D view of a
QD pair on the surface of a
QD crystal with 11 QD layers
and (d) data for QD pairs
observed in the QDC
11
.
Definitions of base width b
and peak-to-peak distance d
are shown in (c)
8 Nanoscale Res Lett (2006) 1:1–10
123
2D islands on a strain modulated surface. Simulation
details are reported in Ref. [42]. Figure 15 shows the
calculated surface strain energy profile and the results
of the KMC simulations. In Fig. 15a, we observe only
one strain energy minimum positioned on top of the
buried QD. Consequently, almost 70% of all simula-
tions result in single elongated 2D islands that form on
top of the strain minima positions. Our simulations also
produce 30% of double 2D islands aligned along [1–10]
that form in the vicinity of the strain energy minima.
The formation of double 2D islands aligned along the
ridge orientation can be understood in the following
way: In the simulations the diffusion coefficient of an
adatom (surface atom without neighboring atoms) is
D/(2k
B
T/h) exp(E
str
/k
B
T), where k
B
T is thermal en-
ergy and E
str
is the surface strain energy density. As
shown in the bottom part of Fig. 15a, E
str
along [1–10]
is smaller than that along [110], which implies that the
diffusion coefficient of adatoms diffusing along [1–10]
is smaller than along [110]. Hence, atoms preferably
aggregate on the ridge in the vicinity of the strain
energy minimum positions, where they nucleate into
stable 2D islands. In our simulation the average center-
of-mass distance between double 2D islands is 27 nm,
which is in excellent agreement with the 26 nm average
peak-to-peak QD distance obtained from our experi-
ment. Furthermore, the simulated 30% of double 2D
islands compares reasonably well with the 20% QD
pairs found in our experiment.
In Fig. 15b, we show the calculated surface strain
energy obtained from the buried QD pair in the sixth
layer using the peak-to-peak distance and the corre-
sponding ridge structure deduced from the AFM
images. In this case, we find two strain energy minima
on top of each buried QD of the QD pair. The simu-
lation in Fig. 15b produces 93% double 2D islands, and
the average center-of-mass distance between the dou-
ble 2D islands increases to 34 nm. This simulation
results allow us to conclude that QD pairs become
more separated in subsequent layers, which is in good
agreement with our experimental observations.
Conclusion
In conclusion, ordering of self-assembled InAs/
GaAs(001) QDs on a multi-length scale was discussed.
Beginning with the study of the QD morphology, we
observed dome and pyramid shaped InAs QDs on
GaAs surface. The next step is the ordering of QD size.
By varying the growth rate, we can improve the QD
size homogeneity, while the homogeneity of the QD
size distribution in the GaAs matrix can be further
improved by overgrowth at lower growth temperature.
The morphology of nanostructures on the surface
developing during GaAs overgrowth was also investi-
gated. By using an atomic-layer precise in situ etching,
we have realized self-assembled nanoholes, which can
be used as a template for fabricating QD molecules.
Ordering of the QD position on a long-range scale is
obtained by the growth on patterned substrates. The
ordered QD arrays show remarkable size homogene-
ity. Finally, we reported on the phenomenon of lateral
QD replication during stacking of self-assembled QDs
to fabricate 3D QD crystals.
Acknowledgments The technical support of U. Waizmann, T.
Reindl, and M. Riek is acknowledged. The authors would like to
thank K. von Klitzing for continuous interest and support. This
work was financially supported by the Bundesministerium fu
¨
r
Bildung und Forschung (contract number: 03N8711).
References
1. D. Bimberg, M. Grundmann, N.N. Ledentsov, Quantum Dot
Heterostructures (Wiley, Chichester, 1999)
Fig. 15 (a) Results of the
KMC simulation of the initial
QD pair formation on a strain
modulated surface. The strain
field, which is used as an input
in the simulation, is shown
below the simulation results.
(b) The simulation result
demonstrating the
development of QD pair after
its formation (see text)
Nanoscale Res Lett (2006) 1:1–10 9
123
2. Y. Masumoto, T. Takagahara, Semiconductor Quantum
Dots: Physics, Spectroscopy and Applications (Springer,
Berlin Heidelberg 2002)
3. J.M. Ge
´
rard, B. Sermage, B. Gayral, B. Legrand, E. Costard,
V. Thierry-Mieg, Phys. Rev. Lett. 81, 1110 (1998)
4. T. Yoshie, A. Scherer, J. Hendrickson, G. Khitrova,
H.M. Gibbs, G. Rupper, C. Ell, O.B. Shchekin, D.G. Deppe,
Nature 432, 2000 (2004)
5. M. Sugawara, Semiconductors and Semimetals, vol. 60, ed. by
R.K. Willardson, A.C. Beer (Academic Press, London 1999)
6. O.G. Schmidt, S. Kiravittaya, Y. Nakamura, H. Heidemeyer,
R. Songmuang, C. Mu
¨
ller, N.Y. Jin-Phillipp, K. Eberl,
H. Wawra, S. Christiansen, H. Gra
¨
beldinger, H. Schweizer,
Surf. Sci. 514, 10 (2002)
7. V.A. Shchukin, D. Bimberg, Rev. Mod. Phy. 71, 1125 (1999)
8. J. Stangl, V. Holy
´
, G. Bauer, Rev. Mod. Phys. 76, 725 (2004)
9. J. Ma
´
rquez, L. Geelhaar, K. Jacobi, Appl. Phys. Lett. 78,
2309 (2001)
10. T. Kaizu, K. Yamaguchi, Jpn. J. Appl. Phys. 42, 4166 (2003)
11. S. Ruvimov, P. Werner, K. Scheerschmidt, U. Go
¨
sele,
J. Heydenreich, U. Richter, N.N. Ledentsov, M. Grund-
mann, D. Bimberg, V.M. Ustinov, A.Y. Egorov, P.S. Kop’ev,
Zh.I. Alferov, Phys. Rev. B 51, 14766 (1995)
12. G. Costantini, C. Manzano, R. Songmuang, O.G. Schmidt,
K. Kern, Appl. Phys. Lett. 82, 3194 (2003)
13. G. Costantini, A. Rastelli, C. Manzano, R. Songmuang,
O.G. Schmidt, K. Kern, H. von Ka
¨
nel, Appl. Phys. Lett.
85, 5673 (2004)
14. G. Costantini, A. Rastelli, C. Manzano, P. Acosta-Diaz,
G. Katsaros, R. Songmuang, O.G. Schmidt, H. von Ka
¨
nel,
K. Kern, J. Cryst. Growth 278, 38 (2005)
15. A. Rastelli, H. von Ka
¨
nel, Surf. Sci. 532–535, 769 (2003).
16. I. Mukhametzhanov, Z. Wei, R. Heitz, A. Madhukar, Appl.
Phys. Lett. 75, 85 (1999).
17. G. Medeiros-Ribeiro, A.M. Bratkovski, T.I. Kamins, D.A.A.
Ohlberg, R.S. Williams, Science 279, 353 (1998)
18. D. Leonard, M. Krishnamurthy, C.M. Reaves, S.P. Denba-
ars, P.M. Petroff, Appl. Phys. Lett. 63, 3203 (1993)
19. R. Songmuang, S. Kiravittaya, M. Sawadsaringkarn, S.
Panyakeow, O.G. Schmidt, J. Cryst. Growth 251, 166 (2003)
20. Y. Nakata, K. Mukai, M. Sugawara, K. Ohtsubo, H. Ishika-
wa, N. Yokoyama, J. Cryst. Growth 208, 93 (2000)
21. Y. Chen, J. Washburn, Phys. Rev. Lett. 77, 4046 (1996)
22. S. Kiravittaya, Y. Nakamura, O.G. Schmidt, Physica E 13,
224 (2002)
23. R. Songmuang, S. Kiravittaya, O.G. Schmidt, J. Cryst.
Growth
249, 416 (2003)
24. A. Rastelli, E. Mu
¨
ller, H. von Ka
¨
nel, Appl. Phys. Lett. 80,
1438 (2002)
25. K. Nishi, H. Saito, S. Sugou, J S. Lee, Appl. Phys. Lett. 74,
1111 (1999)
26. K. Shiraishi, Appl. Phys. Lett. 60, 1363 (1992)
27. Q. Xie, P. Chen, A. Madhukar, Appl. Phys. Lett. 65, 2051
(1994).
28. G. Burkard, G. Seelig, D. Loss, Phys. Rev. B 62, 1581 (2000)
29. T.H. Stievater, X. Li, D.G. Steel, D. Gammon, D.S. Katzer,
D. Park, C. Piermarocchi, L.J. Sham, Phys. Rev. Lett. 87,
133603 (2001)
30. A. Zrenner, E. Beham, S. Stufler, F. Findeis, M. Bichler,
G. Abstreiter, Nature 418, 612 (2002)
31. X. Li, Y. Wu, D. Steel, D. Gammon, T.H. Stievater, D.S.
Katzer, D. Park, C. Piermarocchi, L.J. Sham, Science 301,
809 (2003)
32. Q. Xie, A. Madhukar, P. Chen, N.P. Kobayashi, Phys. Rev.
Lett. 75, 2542 (1995)
33. H. Schuler, N.Y. Jin-Phillipp, F. Phillipp, K. Eberl, Semic-
ond. Sci. Technol. 13, 1341 (1998)
34. S. Kiravittaya, R. Songmuang, O.G. Schmidt, J. Cryst.
Growth 251, 258 (2003)
35. L. Wang, A. Rastelli, S. Kiravittaya, R. Songmuang, O.G.
Schmidt, B. Krause, T.H. Metzger, Nanoscale Res. Lett.
(in press)
36. E. Penev, S. Stojkovic
´
, P. Kratzer, M. Scheffler, Phys. Rev. B
69, 115335 (2004)
37. O.G. Schmidt, Ch. Deneke, S. Kiravittaya, R. Songmuang,
H. Heidemeyer, Y. Nakamura, R. Zapf-Gottwick, C. Mu
¨
ller,
N.Y. Jin-Phillipp, IEEE J. Sel. Top. Quantum Electron. 8,
1025 (2002)
38. R. Songmuang, S. Kiravittaya, O.G. Schmidt, Appl. Phys.
Lett. 82, 2892 (2003)
39. S. Kiravittya, H. Heidemeyer, O.G. Schmidt, Physica E 23,
253 (2004)
40. H. Heidemeyer, C. Mu
¨
ller, O.G. Schmidt, J. Cryst. Growth
261, 444 (2004)
41. S. Kiravittaya, O.G. Schmidt, Appl. Phys. Lett. 86, 206101
(2005)
42. S. Kiravittaya, H. Heidemeyer, O.G. Schmidt, Appl. Phys.
Lett. 86, 263113 (2005)
10 Nanoscale Res Lett (2006) 1:1–10
123