Báo cáo hóa học: " Site-controlled quantum dots fabricated using an atomic-force microscope assisted technique" pptx
Bạn đang xem bản rút gọn của tài liệu. Xem và tải ngay bản đầy đủ của tài liệu tại đây (344.25 KB, 7 trang )
Abstract An atomic-force microscope assisted tech-
nique is developed to control the position and size of
self-assembled semiconductor quantum dots (QDs).
Presently, the site precision is as good as ± 1.5 nm and
the size fluctuation is within ± 5% with the minimum
controllable lateral diameter of 20 nm. With the ability
of producing tightly packed and differently sized QDs,
sophisticated QD arrays can be controllably fabricated
for the application in quantum computing. The optical
quality of such site-controlled QDs is found compara-
ble to some conventionally self-assembled semicon-
ductor QDs. The single dot photoluminescence of site-
controlled InAs/InP QDs is studied in detail, present-
ing the prospect to utilize them in quantum commu-
nication as precisely controlled single photon emitters
working at telecommunication bands.
Keywords Quantum dot Æ Site-Control Æ Atomic-force
microscope Æ Local oxidation Æ Quantum computer Æ
Quantum communication
Introduction
In general, self-assembled semiconductor quantum dots
(QDs) grown in Stranski–Krastanov (S–K) mode are
randomly distributed both in position and size, which
limits their possible applications [1]. Well ordered QD
arrays are quite attractive in many applications such as
optoelectronic devices. For example, two-dimensionally
ordered and close-packed QDs may suppress the pho-
non scattering and enhance the optical non-linearity [2,
3]. In few cases, such an array can be self-organized by
direct S–K growth.[4]. In recent years, self-assembled
semiconductor QDs have been considered to be utilized
in quantum information processing [5–8]. It requires
well defined inter-dot coupling [9], putting demands on
precise controlof QD sites. Efforts havebeen devoted to
define the positions of self-assembled QDs by means of,
e.g., scanning tunneling microscope lithography [10],
strain modulation [11] and nanotemplate [12], but they
seem difficult in constructing qubits mainly due to dot
separation still being out of noticeable inter-dot cou-
pling. We developed a technique assisted by atomic-
force microscope (AFM), by which one can set QDs
sufficiently close and prepare dot array sophisticated to
fit the requirements of quantum information processing
[13]. In this paper, we describe the characteristics of site-
controlled semiconductor QDs fabricated using our
AFM-assisted technique and their applications in
quantum computation and quantum communication.
Fabrication
Our AFM-assisted technique consists of three steps,
briefly forming oxide dots, preparing holes and
growing QDs.
H. Z. Song (&) Æ T. Usuki Æ T. Ohshima Æ K. Takemoto Æ
T. Miyazawa Æ S. Hirose Æ Y. Nakata Æ M. Takatsu Æ
N. Yokoyama
Nanotechnology Research center, Fujitsu Lab. Ltd.,
Morinosato-Wakamiya 10-1, Atsugi,
Kanagawa 243-0197, Japan
e-mail:
Y. Sakuma Æ M. Kawabe
Nanomaterials Laboratory, National Institute for Materials
Science (NIMS), Tsukuba, Ibaraki, Japan
Y. Okada
Institute of Applied Physics, University of Tsukuba,
Tsukuba, Ibaraki 305-8773, Japan
Nanoscale Res Lett (2006) 1:160–166
DOI 10.1007/s11671-006-9012-x
123
NANO EXPRESS
Site-controlled quantum dots fabricated using an atomic-force
microscope assisted technique
H. Z. Song Æ T. Usuki Æ T. Ohshima Æ Y. Sakuma Æ
M. Kawabe Æ Y. Okada Æ K. Takemoto Æ T. Miyazawa Æ
S. Hirose Æ Y. Nakata Æ M. Takatsu Æ N. Yokoyama
Published online: 3 August 2006
Ó to the authors 2006
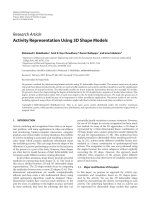
The first stage is the fabrication of oxide dots, which
is performed by AFM lithography at room tempera-
ture in a humid atmosphere. The substrate can be
many semiconductors such as GaAs [13–15], InP [16]
and Si [17] of any conduction type (n, p and intrinsic).
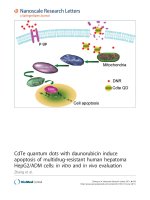
As shown schematically in Fig. 1, when a negatively
biased AFM tip approaches the flat surface of a semi-
conductor substrate, the electric field decomposes wa-
ter molecules in the small region around the AFM tip
into H
+
and OH
–.
Then the OH
–
ions locally oxidize
the surface. In the case of GaAs substrate, this reaction
is as follows [18]
2GaAs þ12OH
À
! Ga
2
O
3
þ As
2
O
3
þ 6H
2
O þ12e
À
ð1Þ
Oxygen incorporation expands the volume and then
contributes a part above the original surface, and then
forms a nanoscaled oxide dot outstanding beyond the
surface as shown in Fig. 1a. The oxidation rate depends
on the electric field or current. Due to the pin-shape of
a tip, the electric field/current decreases along the ra-
dial directions from the tip center. It thus gives rise to a
lens-shaped oxide dot. The oxide dot size can be con-
trolled by suitably tuning the applied voltage and
reaction time.
The oxidized region is not limited above the ori-
ginal surface. Similar to the conventional oxidation of
semiconductor surface, nearly half of the oxidized
region lies below the original surface level, as can
also be seen in Fig. 1a. If we remove the oxide, the
space released from the oxide dot will give a hole. To
remove the oxide dots, one can use chemical etching.
The usually used solution is HCl : H
2
O = 1:20 ~
1:100 at least for GaAs and InP. The etching time
can be from 30 s to a few minutes. After etching,
site-controlled holes are obtained, as shown sche-
matically in Fig. 1b. Immediately, the hole-patterned
substrate is rinsed in flowing de-ionized water for
enough time so that the surface is of little residual
solution. An alternative way to remove oxide dots is
ultrasonic cleaning in water, whose mechanism may
be that the structure of the oxide is so relaxed that
the atomic bonding is weaker than in bulk semicon-
ductor.
As the final process, QDs are epitaxially grown by
methods such as molecular beam epitaxy (MBE) and
metalorganic chemical vapor deposition (MOCVD) on
the hole-patterned surface. Before overgrowing, the
thin oxide layer, which is formed in the short time of
mounting the sample into the growth chamber, has to
be cleaned away from the surface. It is unsuitable to
carry out thermal cleaning because the hole pattern
may be smeared out or even destroyed at temperature
as high as 600 °C. We can use irradiation of atomic
hydrogen at temperature below 550 °C for a few min-
utes. Hereafter, heteroepitaxy is performed to grow
QDs at the same temperatures as normally used for
QD growth in S–K mode. The coverage is limited
below the point of transition from two to three
dimensional growth modes, which is a fundamental
factor in S–K growth of self-assembled QDs. With
growth condition well controlled, QDs are formed on
the sites of holes as shown in Fig. 1c. This site-selective
growth of QDs may be understood by more strain-
relaxation at the hole sites [15], although other expla-
nations such as concentration of atomic steps [10] can
not be completely excluded.
Controlability
We shall now demonstrate how well the QDs can be
controlled by our AFM-assisted technique. As an
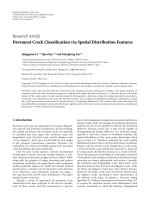
example, Fig. 2 shows the results of fabricating a square-
latticed array with site-site distance of 50 nm on the
surface of an n
+
-GaAs (001) substrate (2 · 10
18
cm
–2
Si-doped). Apart from the AFM images, line profiles,
which were taken from somewhere in the AFM images
along the centers of a chain of sites, are also given as a
reference. The oxide dots seen in Fig. 2a are nearly of
round shape in base and rather homogeneous in diam-
eter, 32–36 nm. The line profile shows a reasonably
small variation of the height of oxide dots, 1.2 –1.6 nm.
The hole diameters seen in Fig. 2b, 32–36 nm, well fol-
low that of the oxide dots. The line profile indicates the
depth of the holes, 1.1–1.5 nm, which is similar to the
height of the oxide dots as expected. The surface
roughness looks a bit larger than that before etching due
to the etching effect of native oxide on the flat area.
However, this roughness does not influence the preci-
sion of hole pattern at all. Figure 2c shows the QDs
array after MBE growth of In
0.4
Ga
0.6
As at 490°C for
Fig. 1 Process of AFM-assisted control of semiconductor QDs
Nanoscale Res Lett (2006) 1:160–166 161
123
4.4 ML. The QDs are well organized into the expected
square-latticed array. It implies that the QDs exactly
locate on the sites of holes formed in (b). The diameters
of QDs, 32 ~ 36 nm, are consistent with the oxide dots
and holes. As a whole, the size fluctuation of about
± 5% is much better than usual S–K growth and com-
parable to very recently achieved homogeneity of S–K
QDs [19]. The height and depth fluctuations, ~ 0.4 nm
here, are reasonably small.
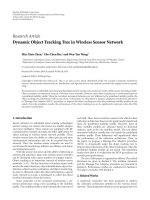
The precise QD control of our technique keeps
working well until the inter-site distance gets down to
less than 1.5 times of the hole diameter. In the upper
half of Fig. 3, one line of 20 nm sized In
0.5
Ga
0.5
As
QDs are differently separated. It indicates that the
side-to-side neighboring QDs can grow almost inde-
pendently. With our minimum achievable lateral size,
20 nm, the controllable inter-dot distance can be
down to 25 nm, meaning QDs nearly touching their
neighbors. Detailed studies show that the lateral size
is determined by the hole diameter without changing
with coverage, whereas the QD height increases with
coverage at a speed related to the hole size [15]. The
lower half of Fig. 3 shows three different QDs which
were formed on three different holes about 50, 30
and 20 nm large. After depositing 3.5 ML of In
0.5-
Ga
0.5
As, the on-site QDs exhibit the same lateral si-
zes as the original holes but different heights of 3, 2,
and 1 nm.
The minimum available interdot distance of less
than 30 nm enables observable coherent lateral
interaction between neighboring QDs [20, 21]. The
simultaneous availability of various QD sizes provides
a way to controllably construct asymmetric QD mol-
ecules. These open the way to apply the present
technique in quantum computation using site-con-
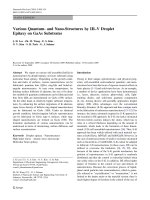
trolled semiconductor QDs [22]. In a proposed model
of quantum computer [23], one qubit consists of a big
QD as the main dot and a few small QDs as the
operation dots, as is schematically illustrated in
Fig. 4a. The inter-qubit interaction is controlled by
pushing an electron into the main dots (weakly or not
coupled) or neighboring operation dots (strongly
coupled). In the stand-by state, the electron with spin
up or down stays in the main dot. Applying a suitable
p-pulse to any qubit, the electron will transfer to an
operation dot. The quantum gate operation is imple-
mented via swapping between the electron spins in
operation dots belonging to neighboring qubits. Fig-
ure 4b shows such a QDs structure fabricated by the
present technique. The big and small dots are ~30 and
~20 nm in diameter and the center-center distance
between big and small sites is 40 nm. The height of
oxide dots are about 1.5 (big) and 1.2 nm (small) and
the depth of holes are 1.4 (big) and 1.1 nm (small),
Fig. 2 Top-view AFM images
and line profiles of a square-
latticed array after (a) AFM
oxidation, (b) oxide dots
removal by chemical etching
and (c) 4.4 ML of
In
0.4
Ga
0.6
As regrowth by
MBE. The lines in the images
indicate where the profiles are
taken
Fig. 3 AFM image and cross-section profiles for growing 3.5 ML
of In
0.5
Ga
0.5
As on a GaAs surface patterned with differently
distant (upper half) and differently sized (lower half) holes
fabricated by AFM oxidation and oxide removal
162 Nanoscale Res Lett (2006) 1:160–166
123
which are as expected. Of course, to better satisfy the
requirement of qubit construction, more precise con-
trol should be realized. For instance, control scale of
10 nm can be available if a recently developed
carbon-nanotube AFM tip is readily adopted in AFM
lithography on semiconductor surface.
Optical characteristics
For the application of site-controlled QDs, their opti-
cal properties were characterized. Here we are going to
show an example of InAs/InP QDs [16], which are the
candidate of single photon emitters at telecommuni-
cation bands of silica-based optical fibers, i.e. from 1.3
to 1.55 lm[24, 25]. The sample preparation was
performed on the surface of a flat semi-insulating
InP(001) substrate using the present technique. After
formation of holes by chemical etching, MOCVD was
carried out to form InAs QDs at the holes sites. In this
case, the initial native oxides are removed by the
reactive atomic hydrogen generated from decomposed
PH
3
. The InAs QDs, formed with 1.4 ML of InAs
coverage, are 500 nm separated for the purpose of
single dot photoluminescence (PL) measurements, as
shown in Fig. 5a. The cross section of such QDs is
depicted schematically by the upper half in Fig. 5b,
where it is shown that they have a deep part, in fact
~2 nm, below the wetting layer. Formation of site-
controlled QDs are immediately followed by a so-
called ‘‘double-cap’’ growth [26–29]. The first cap
process cuts the outstanding part of QDs beyond the
surface, as shown by the lower diagram of Fig. 5b. As a
result, the first cap layer thickness determines the final
height of QDs.
The micro-PL was measured with the 532 nm line
of a Nd:YAG laser on samples with the first cap layer
thickness varying from 0.3 to 2 nm. At an arbitrary
position, we first observe the strong wetting layer
emission around 985 nm as shown in the inset of
Fig. 6. In the region of site-controlled QDs, narrow
PL peaks are observed. Taking the detector efficiency
into account, the luminescence intensity is compara-
ble to that of InAlAs/AlGaAs QDs conventionally
self-assembled in S–K mode [30]. The site-depen-
dence of micro-PL following the controlled sites of
QDs confirms that these single peaks come from the
site-controlled single InAs/InP QDs [16]. A typical
single dot PL spectrum for each sample is presented
in Fig. 6. For the sample with the first cap of 2 nm,
the QDs emissions are estimated to be centered
around 1.7 lm, which is beyond the instrument limit.
As a result, most of the QDs are undetectable but few
dots emitting at shorter wavelengths are observed, as
exemplified by a peak at 1.59 lm in Fig. 6. The other
three peaks in Fig. 6, at 1.33, 1.42 and 1.47 lm reflect
approximately the average emission wavelength over
all dots in one sample. The change of average position
Fig. 4 (a) Qubit structure and operation of an all-optical
quantum computer using electron spins in asymmetrically
coupled QDs; (b) AFM image of qubit-structured QDs array,
which fits the model in (a), fabricated using the present
technique
Fig. 5 (a) AFM image of site-controlled InAs/InP QDs after
MOCVD regrowth of 1.4-ML InAs; (b) the schematic demon-
stration of the following ‘‘double-cap’’ growth
Nanoscale Res Lett (2006) 1:160–166 163
123
follows the quantum confinement effect and indicates
that the emission wavelength can be tuned by the
fabrication conditions to fit the application require-
ments. The site-controllability of single dot emitters at
telecommunication bands is thus revealed.
The single dot peaks look broader than conven-
tionally grown self-assembled quantum dots, about
0.8 meV in full width at half maximum, but they are
the same as that of InAs/InP QDs produced at nano-
templates [12], in which the formed QDs are a few
hundred nm far away from the initially patterned sur-
face processed by electron beam lithography. This
suggests that regrowth of QDs directly on a chemically
processed substrate may not be a severe factor to
degrade the dot quality in our technique.
However, the possibly imperfect interface between
the chemically processed substrate and the overgrown
QDs might play some role in the optical behaviors of
site-controlled QDs. This is implied by the excitation
density dependence of the single dot micro-PL inten-
sity. It is found that the integrated intensities of single
dot micro-PL peaks do not exhibit a universal excita-
tion density dependence but vary from linear to qua-
dratic for different QDs. Three examples, for dots a, b
and c from the sample with first cap of 0.3 nm, shown
in Fig. 7a by solid symbols follow the power law
function with index of 1.0, 1.32 and 2.0, respectively.
We may refer to a model in terms of nonradiative
process as in quantum wells [31], in which the excita-
tion density I
ex
satisfies:
aI
ex
¼
n
s
n
þ Bnp ¼
p
s
p
þ Bnp ð2Þ
where n(p) is the electron (hole) number in the QD,
s
n
(s
p
) is the nonradiative decay time of electrons
(holes), B is the radiative recombination rate and a is
an coefficient associated with the absorption. Here the
radiative recombination takes the form of Bnp because
the electrons and holes can be captured independently
in a single QD [32]. Denoting PL intensity as
L=Bnp=np/s
0
with s
0
the rediative lifetime, and
defining (s
n
s
p
)
1/2
= s as the normalized nonradiative
lifetime, Eq. (2) can be reduced to:
aI
ex
¼ L þ
ffiffiffiffiffiffiffiffi
Ls
0
p
=s: ð3Þ
It is easy to see that L%a
2
s
2
I
ex
2
/s
0
when s
2
/s
0
is suf-
ficiently small, and L%a I
ex
while s
2
/s
0
is sufficiently
large. Providing the nonradiative lifetime s varies from
dot to dot, the different excitation density dependence
of PL intensity can be understood. In Fig. 7a, it is clear
that the results at 10 K are well fitted by Eq. (3) with
different s for different peaks. The dot dependent
1300 1400 1500 1600
at 10K
10
3
Wcm
-2
excited
10
3
Wcm
-2
excited
1st cap
2.0 nm
1st cap
1.0 nm
1st cap
0.6 nm
1st cap
0.3 nm
1592.2 nm
0.58 meV
1477.5 nm
1.08 meV
1416.0 nm
0.68 meV
1333.6 nm
0.82 meV
PL Intensity (a. u.)
Wavelen
g
th
(
nm
)
900 1200 1500
wetting layer
at 10K
Fig. 6 Typical single dot micro-PL peaks from site-controlled
InAs/InP QDs with different thickness of the first cap layer. The
inset shows the PL of the wetting layer
1 10 100
10
–1
10
0
10
1
10
2
10
3
10
0
10
1
10
2
quadratic
linear
(a)
dot a dot b
77K
140K
10K
dot c
dot a
45K
Integrated PL Intensity (a.u.)
Excitation Density (10
2
Wcm
-2
)
20 40 60 80 10 0
(b)
2X10
3
Wcm
-2
excited
dot a
dot b
dot c
Integrated PL Intensity (a.u.)
1000/T
(
1/K
)
Fig. 7 (a) Excitation density and (b) temperature dependences
of the single dot PL intensities of site-controlled InAs/InP QDs.
Lines show the fitted results using Eqs. (3) and (4)
164 Nanoscale Res Lett (2006) 1:160–166
123
nonradiative lifetime is thought to be the result of
different number of nonradiative centers in different
dots. Considering the chemical processing before QD
regrowth, the nonradiative centers might be some
impurities or defects in the vicinity of QDs, which are
survived from the incomplete surface cleaning.
The effects of impurities/defects can be further
suggested by the temperature dependence of the
single dot emission. The symbols other than solid
ones in Fig. 7a show the excitation density depen-
dence at elevated temperatures for dot a. It is seen
that increasing temperature leads to more and more
quadratic excitation density dependence of PL inten-
sity. These can also be well fitted by Eq. (3) but with
s more and more shortened with increasing temper-
ature. In detail, Fig. 7b demonstrates that, at a fixed
excitation density, the PL intensity of each dot is
nearly constant at low temperatures but thermally
quenched at higher temperatures. These data are
suggestive of an expression of the nonradiative
lifetime s as:
s
À1
¼ s
À1
1
þ s
À1
2
e
ÀE=kT
; ð4Þ
where s
1
and s
2
are time constants, E is an activation
energy, k is the Boltzmann constant and T is the
temperature. The solid lines in Fig. 7b indicate that the
experimental results are well fitted to Eq. (3) together
with (4). What is more important, all the site-con-
trolled QDs show an activation energy E%22.5 meV,
suggestive of phonon scattering as in conventionally
self-assembled QDs [33] at higher temperatures. In
addition, s
1
is dot dependent and close to the value of s
at 10 K, while a, s
0
and E are almost dot independent.
The parameter s
2
is also dot dependent with the same
trend as but more weakly than s
1
. This may be ascribed
to impurities/defects enhanced photon scattering [34],
as a result of imperfect interface between site-con-
trolled QDs and their substrate.
Nevertheless, the PL from the wetting layer is as
normal, i.e. it does not show a complicated excitation
density dependence but simply a linear behavior in a
lower excitation range (not shown). It means that the
nonradiative process due to interface impurities/defects
does not have an obvious effect in the wetting layer.
Therefore, the impurities/defects exist mainly at QD
sites. This is because there are high density of
steps with dangling bonds at the hole sites. It may
be concluded that these impurities/defects are not
intrinsic in our present technique. They will be well
suppressed in the future by improving the fabrication
technique, e.g. using in situ atomic hydrogen
irradiation to remove oxide dots, optimizing the
annealing condition and finely controlling the AFM
oxidation.
Although our site-controlled QDs are open to be
improved, the present quality is not below the limit of
application in quantum communication because con-
ventionally self-assembled InAlAs/AlGaAs QDs of
similar quality have exhibited single photon emission
[35]. We are currently struggling to perform single
photon transmission using such site-controlled QDs as
the source working at telecommunication bands for
silica-based optical fibers.
Summary
We developed an AFM-assisted technique to control
the position and size of self-assembled semiconductor
QDs. The site precision of QDs is as good
as ± 1.5 nm and the QD size fluctuation can be
within ± 5%, which is better than that in conven-
tional S–K growth. The controllable minimum lateral
size of 20 nm, the interdot distance as small as the
diameter of QDs and the simultaneous control of
differently sized QDs enable constructing QD qubits
to be applied in quantum computing. The optical
quality of such site-controlled QDs is found compa-
rable to conventionally self-assembled InAlAs/Al-
GaAs QDs. The InAs/InP QDs fabricated by this
technique are shown to be a candidate of site-con-
trolled single-photon emitters working at telecom-
munication bands for the application in quantum
communication. What is to be improved may be the
imperfection of the interface between QDs and the
processed substrate, where impurities/defects influ-
ence the optical quality of site-controlled QDs.
References
1. D. Bimberg, M. Grundmann, N.N. Ledentsov, Quantum Dot
Heterostructures (Widley, New York, 1999)
2. H. Sakaki, Jpn. J. Appl. Phys. 28, L314 (1989)
3. T. Takagahara, Surf. Sci. 267, 310 (1992)
4. H.Z. Song, K. Akahane, S. Lan, H.Z. Xu, Y. Okada,
M. Kawabe, Phys. Rev. B 64, 085303 (2001)
5. N.H. Bonadeo, J. Erland, D. Gammon, D. Park, D.S. Katzer,
D.G. Steel, Science 282, 1473 (1998)
6. L. Besombes, J.J. Baumberg, J. Motohisa, Phys. Rev. Lett.
90, 257402 (2003)
7. C. Santori, D. Fattal, J. Vuc
ˇ
kovic
´
, G.S. Solomon, Y.
Yamamoto, Nature 419, 594 (2002)
8. Z. Yuan, B.E. Kardynal, R.M. Stevenson, A.J. Shields, C.J.
Lobo, K. Cooper, N.S. Beattie, D.A. Ritchie, M. Pepper,
Science 295, 102 (2002)
9. D. Loss, D.P. DiVincenzo, Phys. Rev. A 57, 120 (1998)
10. T. Ishikawa, T. Nishimura, S. Kohmoto, K. Asakawa, Appl.
Phys. Lett. 76, 167 (2000)
Nanoscale Res Lett (2006) 1:160–166 165
123
11. H. Lee, J.A. Johnson, M.Y. He, J.S. Speck, P.M. Petroff,
Appl. Phys. Lett. 78, 105 (2001)
12. D. Chithrani, R.L. Williams, J. Lefebvre, P.J. Poole,
G.C. Aers, Appl. Phys. Lett. 84, 978 (2004)
13. H.Z. Song, T. Ohshima, Y. Okada, K. Akahane, T. Miyazawa,
M. Kawabe, N. Yokoyama in Proceedings of the 26th ICPS,
Edinburgh, 29 July- 2 August 2002, P.32
14. U.F. Keyser, H.W. Schumacher, U. Zeitler, R.J. Haug,
K. Zberl, Appl. Phys. Lett. 76, 457 (2000)
15. H.Z. Song, Y. Nakata, Y. Okada, T. Miyazawa, T. Ohshima,
M. Takatsu, M. Kawabe, N. Yokoyama, Phys. E 21, 625 (2004)
16. H.Z. Song, T. Usuki, S. Hirose, K. Takemoto, Y. Nakata,
N. Yokoyama, Y. Sakuma, Appl. Phys. Lett. 86, 113118 (2005)
17. A. Hirai, K.M. Itoh, Physica E 23, 248 (2004)
18. Y. Okada, Y. Iuchi, M. Kawabe, J.S. Harris, Jr., J. Appl.
Phys. 88, 1136 (2000)
19. Zh. M. Wang, Y.I. Mazur, Sh. Seydmohamadi, G.J. Salamo,
H. Kissel, Appl. Phys. Lett. 87, 213105 (2005)
20. H.Z. Song, S. Lan, K. Akahane, K.Y. Jang, Y. Okada,
M. Kawabe, Solid State Communications 115, 195 (2000)
21. D.L. Huffaker and D.G. Deppe, Appl. Phys. Lett. 73, 366
(1998)
22. T. Ohshima, H.Z. Song, Y. Okada, K. Akahane, T. Miyazawa,
M. Kawabe, N. Yokoyama, Phys. Stat. Sol. (c) 4, 1364 (2003)
23. T. Ohshima, Phy. Rev. A 62, 062316 (2000)
24. K. Takemoto, Y. Sakuma, S. Hirose, T. Usuki, N. Yokoyama,
Jpn. J. Appl. Phys. (part B) 43, L349 (2004)
25. K. Takemoto, Y. Sakuma, S. Hirose, T. Usuki, N. Yokoyama,
T. Miyazawa, M. Takatsu, Y. Arakawa, Jpn J. Appl. Phys.
(part B) 43, L993 (2004)
26. C. Panranthoen, N. Bertru, O. Dehaese, A. LeCorre,
S. Loualiche, B. Lambert, G. Patriarche, Appl. Phys. Lett.
78, 1751 (2001)
27. S. Raymond, S. Studenikin, S.J. Cheng, M. Pioro-Ladrie
`
re,
M. Ciorga, P.J. Poole, M.D. Robertson, Semicond. Sci.
Technol. 18, 385 (2003)
28. Y. Sakuma, K. Takemoto, S. Hirose, T. Usuki, N. Yokoy-
ama, Physica E 26, 81 (2005)
29. Y. Sakuma, M. Takeguchi, K. Takemoto, S. Hirose, T.
Usuki, N. Yokoyama, J. Vac. Sci. Technol. B 23, 1741
(2005)
30. T. Yokoi, S. Adachi, H. Sasakura, S. Muto, H.Z. Song,
T. Usuki, S. Hirose, Phys. Rev. B 71, 041307R (2005)
31. W. Feng, Y. Wang, J. Wang, W.K. Ge, Q. Huang, J.M. Zhou,
Appl. Phys. Lett. 72, 1463 (1998)
32. K.F. Karlsson, E.S. Moskalenko, P.O. Holtz, B. Monemar,
W.V. Schoenfled, J.M. Garcia, P.M. Petroff, Appl. Phys.
Lett. 78, 2952 (2001)
33. V.I. Ignatiev, E.I. Kozin, S.V. Nair, H.W. Ren, S. Sugou,
Y. Masumoto, Phys. Rev. B 61, 15633 (2000)
34. M. Pepper, J. Phys. C 13, L709 (1980)
35. S. Kimura, H. Kumano, M. Endo, I. Suemune, T. Yokoi, H.
Sasakura, S. Adachi, S. Muto, H.Z. Song, S. Hirose, T. Usuki,
Jpn. J. Appl. Phys. 44, L793 (2005)
166 Nanoscale Res Lett (2006) 1:160–166
123