Báo cáo hóa học: " Cross-Layer Design and Analysis of Downlink Communications in Cellular CDMA Systems" docx
Bạn đang xem bản rút gọn của tài liệu. Xem và tải ngay bản đầy đủ của tài liệu tại đây (1.5 MB, 23 trang )
Hindawi Publishing Corporation
EURASIP Journal on Wireless Communications and Networking
Volume 2006, Article ID 21297, Pages 1–23
DOI 10.1155/WCN/2006/21297
Cross-Layer Design and Analysis of Downlink Communications
in Cellular CDMA Systems
Jin Yuan Sun, Lian Zhao, and Alagan Anpalagan
Department of Electrical and Computer Engineering, Ryerson University, Toronto, ON, Canada M5B 2K3
Received 1 October 2005; Revised 10 March 2006; Accepted 19 May 2006
A cellular CDMA network with voice and data communications is considered. Focusing on the downlink direction, we seek for
the overall performance improvement which can be achieved by cross-layer analysis and design, taking physical layer, link layer,
network layer, and transport layer into account. We are concerned with the role of each single layer as well as the interaction
among layers, and propose algorithms/schemes accordingly to improve the system performance. These proposals include adaptive
scheduling for link layer, priority-based handoff strategy for network admission control, and an algorithm for the avoidance
of TCP spurious timeouts at the transport layer. Numerical results show the performance gain of each proposed scheme over
independent performance of an individual layer in the wireless mobile network. We conclude that the system performance in terms
of capacity, throughput, dropping probability, outage, power efficiency, delay, and fairness can be enhanced by jointly considering
the interactions across layers.
Copyright © 2006 Jin Yuan Sun et al. This is an open access article distributed under the Creative Commons Attribution License,
which permits unrestricted use, distribution, and reproduction in any medium, provided the original work is properly cited.
1. INTRODUCTION
With the growing demand and popularity of high-speed data
applications in wireless networks, the system capacity and
bandwidth resource become increasingly stringent. Radio re-
source management plays a key role in wireless system design
and analysis. Research efforts are made to expand the capac-
ity and to efficiently allocate the resource. Some of the efforts
include the evolution of the CDMA technology. For example,
3G (third generation) and 3G+ (beyond 3G) CDMA systems
(i.e., WCDMA and CDMA2000) are superior to 2G CDMA
systems (IS-95) in that the former ones have higher carrier
bandwidth and faster power control frequency (more precise
channel feedback). On the other hand, some efforts focus on
the algorithm design which can be implemented in the soft-
ware to optimize the system performance. As the research on
3G and 3G+ CDMA systems emerges, and although count-
less works have contributed to this research area, there still
remain a great number of problems unsolved. In this paper,
we would like to share our ideas to approach some of the
problems in this field. We choose to focus on the cross-layer
design of the CDMA networks as this issue has recently been
capturing interests.
The traditional wireless networks mainly support voice
service without data service provided through the Internet
backbone. However, the integ ration of the wireless network
and the wired backbone is of great importance today because
of the increasing data application requirement at the mo-
bile terminal (e.g., cellular phone and wireless laptop). While
most previous research was on the performance optimization
of individual layer, it often leads to performance degrada-
tion of other layers or suboptimal system performance. The
hierarchical structure of the wireless networks, as the wired
ones, facilitates us to design and study protocols for the sin-
gle layer that is of particular interest since these layers (phys-
ical layer, link layer, network layer, transport layer, and appli-
cation layer) are transparent to one another. But this isola-
tion may cause suboptimal system performance. Recent re-
search has shown that a well-designed cross-layer approach
that supports multiple protocol layer adaptivity and opti-
mization can yield significant performance gains [1]. Many
researchers use the cross-layer approach for their designs.
However, these designs can be very different due to various
combinations and interactions of multiple layers.
We have studied a number of cross-layer approaches for
CDMA system optimization in the literature. In what fol-
lows, we summarize some of these approaches. Authors of
[2–8] propose cross-layer approaches to achieve system op-
timization in CDMA systems. In [2] a set of PHY-MAC
(physical-MAC) mechanisms is proposed based on the rate
adaptation provided by the MAC and the channel state from
the PHY to improve spectrum efficiency and reduce power
2 EURASIP Journal on Wireless Communications and Networking
consumption. Yu and Krishnamurthy [3] focus on cross-
layer QoS (quality-of-service) guarantee by combining phys-
ical layer SIR (signal-to-interference ratio) and network layer
blocking probability to reduce computational complexity
and approximate the optimal solutions. Other works are also
found to address physical/network cross-layer optimization
issues [9, 10]. Price and Javidi [4] deal with the interaction
between congestion (transport layer) and interference (MAC
layer), and integrate them into a single protocol by means of
rate assignment optimization. Friderikos et al. [5] interpret
the rate adaptation as TCP-related since the r ate in this paper
is defined as the ratio of the current congestion window and
RTT (round-trip-time) of the connection, and jointly con-
siders it with physical layer (power). Hossain and Bhargava
[6] model and analyze the link/PHY level influence on TCP
behavior and illustrate their dependency. Yao et al. [7]study
the reverse and forward link capacities balancing issue by
covering link layer and the network layer to seek for optimal
handoff probability. Chan et al. [8] propose a joint source
coding power control and source channel coding, and inter-
pret them as the MAC-layer power control and application-
layer source coding, respectively, maximizing the delivered
service quality and minimizing the resource consumption.
There are also additional attention on other aspec ts of cross-
layer design, such as to decrease the cross-layer interference
[11] instead of optimization.
The above survey indicates that different interpretations
of “cross-layer” and resources belonging to these layers pro-
duce a v ariety of cross-layer studies. While existing works
address cross-layer issues based on two or three layers, we
propose to fully address this issue by taking the four impor-
tant layers into account: physical layer, link layer, network
layer, and transport layer. We design algorithms/protocols
for each of these layers by considering their communications
and mutual impacts to prevent isolation thus improving the
overall performance. At the physical layer, two fundamental
techniques, power control and rate allocation, are studied.
The proposed integrated power control and rate allocation
is briefly introduced which is primarily used for the link-
layer scheduling and is demonstrated in detail in the follow-
ing scheduling schemes. At the link layer, a novel voice packet
scheduling scheme named modified adaptive priority queu-
ing (MAPQ) and a unified framework (UF) for scheduling
hybrid voice and data trafficareproposed.Anadaptiveprior-
ity profile is defined in these schemes based on queuing delay
and physical layer information such as required transmission
power, and available transmission rate, which borrows the
idea of composite metric from wired systems. Estimation er-
ror is considered when measuring received pilots at mobile
stations. For MAPQ, this definition ensures system capacity
improvement, packet dropping probability reduction, and
fairness. Users are allocated resources according to their pri-
orities in a modified PQ fashion constrained by total power
budget of base stations. For UF, we address the consistency
of the framework as well as the distinctions of voice and data
scheduling processes by discussing the common policy and
individual requirements of both classes. With this design,
the proposed algorithm accomplishes system performance
enhancement while retaining separate performance features
without degradation. The uniformity of the proposed frame-
work not only simplifies the implementation of the schedul-
ing algorithms a t base stations, but also is verified to b e ro-
bust and resistant to various offered trafficloadandvariable
service structure (voice/data proportion). At network layer,
we propose an adaptive prioritizing soft handoff algorithm
for concurrent handoff requests aiming at a same cell. A pre-
dicted set, an adaptive priority profile jointly exploiting the
impact of required handoff power, and call holding time have
been developed to realize the proposed algorithm. A link-
layer scheduler residing in each base station to ensure the
desired operation of the prioritizing procedure is also de-
signed, with input information from network layer. At trans-
port layer, we study the problem of TCP over wireless link
and summarize the solutions for this problem from exten-
sive research works. We design an algorithm to prevent the
spurious timeouts at TCP sources caused by the stochastic
intervals of wireless opportunistic scheduling.
The rest of this paper is organized as fol lows. Section 2 il-
lustrates the system model based on which this research is
carried out. The main body consists of Sections 3, 4,and
5, where we propose strategies for LINK/PHY (link/physical
layer), NET/LINK/PHY (network/link/physical layer), and
TRANS/NET/LINK (transport/network/link layer), respec-
tively, and study their interactions. Section 6 gives out the
simulation environment and the performance evaluation/
analysis of the proposed cross-layer design. Finally Section 7
concludes this paper with primary contributions, open issues
and certain limitations.
2. SYSTEM MODEL
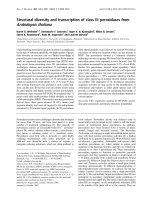
We concentrate on a cellular WCDMA system with wrap-
around cell structure, as shown in Figure 1, where mobile
stations (MSs) select serving base stations (BSs, displayed as
pentagrams) based on the measured strength of pilot signals
(P
p
) sent out periodically by BSs. Typically, 20% of the down-
link total power will be assigned to pilot channel by each BS.
The rest of the total power is shared by traffic channel and
an other control channel (carries control information, power
control symbols, etc.).
In forward link (downlink), BSs transmit packets to MSs
through traffic channels which consist of frames. Each frame
is of a 10 ms length and is subdivided by 15 time slots within
one of which traffic destined for one specific MS is delivered.
To guar antee that MSs receive packets correctly, the
transmission power allotted by BSs has to overcome chan-
nel impairments, which consist of path loss (d
ib
/d
0
)
−α
, shad-
owing e
−(βX
b
)
, and Rayleigh (fast) fading using Jakes’ fading
model [12], where d
ib
is the distance between the MS and the
BS, d
0
is the reference distance, α is the path loss exponent,
β
= ln 10/10 is a constant, and X
b
is a Gaussian distr ibuted
shadowing (in cell b) random variable with zero mean and
variance σ
2
X
.
Unlike the uplink case, downlink restriction is neither the
intracell (from adjacent MSs within home cell) nor inter-
cell (from neighboring other cells) interference, but the total
Jin Yuan Sun et al. 3
Figure 1: A typical cellular structure with base stations.
transmission power of BSs. Thus the E
b
/I
0
(bit energy to in-
terference density ratio), received at each mobile i from its
home BS b, is expressed as
γ
i
= Γ
P
i
G
bi
P
T
− P
i
G
bi
+
j=b
P
T
G
ji
,(1)
where Γ
= W/R is the spreading gain with W the spread spec-
trum bandwidth and R the required packet transmission rate.
P
i
and P
T
(in Watt ) denote the transmission power for user
i and total downlink transmission power of BSs, respectively,
assuming BSs are transmitting at the maximum capacity al-
ways. G
i∗
denotes signal attenuation (reciprocal to link gain)
of the channel between user i and BS
∗. During each time
slot, MS i compares the received γ
i
with target E
b
/I
0
γ
∗
and
generates the power control command informing its serving
BS to increase or decrease the transmission power. Note that
unlike [13] and many others of its kind, we consider mul-
tipath fading as part of the channel impairments instead of
using an orthogonality factor (OF) in (1). Authors of [13]
argue that OF is defined as the fraction of received downlink
power converted by multipath into multiaccess interference.
They consider only the path loss as the channel impairment
and include an OF to reflect the multipath impairment. Since
the multipath impairment is reflected by fast fading, we do
not employ OF here.
In reality, however, limited measuring ability of MSs can
introduce an erroneous estimation of received pilots, which
results in errors in measuring G
i∗
(obtained from measuring
pilot signals). We approximate the sum of measurement er-
rors as log-normally distributed as indicated in [14]. Let e
βY
ib
denote the measurement error of the measured value, where
Y
ib
is a Gaussian distributed random variable with zero mean
and a vari ance of σ
2
Y
. As a result, the actual received SIR for
each MS is derived from the following revised version of (1)
counting errors:
γ
i
= Γ
P
i
/P
T
1 − P
i
/P
T
+ e
−βY
ib
j=b
G
ji
/G
bi
. (2)
3. LINK-LAYER PACKET SCHEDULING (LINK/PHY)
Packet scheduling is a promising link-layer management
mechanism. More and more research [15, 16] on this tech-
nique has emerged. However, existing algorithms focus on
data scheduling with little or no concern on voice. The time-
varying nature of wireless channels determines the impor-
tance of voice scheduling. Voice dropping is less likely to
come from congestion than data dropping due to its higher
priority. Nevertheless, voice trafficispronetosuffer a deep-
fading channel and consumes a large amount of limited base
station power, thus must be scheduled properly. In the first
part of this section, we propose a novel voice scheduling
scheme named modified adaptive priority queuing (MAPQ)
for forward link in a wireless cellular WCDMA environment.
An adaptive priority profile is defined in the scheme based
on queuing delay and required transmission power, which
borrows the idea of composite metric imported by IGRP (in-
terior routing protocol) and EIGRP (enhanced IGRP) from
wired networks.
Next, we present a unified packet scheduling framework
(UF) t o include data traffic and demonstrate the easy inte-
gration and general adaptability of MAPQ to the UF.
The E
b
/I
0
used here is the same as (1) except that R in
Γ
= W/R here, R ∈{R
v
, R
d
}, is the required transmission
rateofvoiceordatapackets.TheactualreceivedE
b
/I
0
for
each MS takes the form of (2).
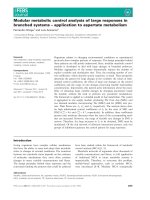
For link-level scheduling implementation, each BS has a
scheduler to regulate incoming hybrid traffic, and arrange
packets aimed for MSs in a specified sequence depending
on the logic of the scheduler. The scheduler implemented in
BSsissketchedinFigure 2,whereQ
V1
and Q
V2
denote voice
queues while Q
D1
and Q
D3
denote data queues.
3.1. Integrated power control and rate allocation
We propose to use physical-layer information power/rate as
the input for link-layer scheduling (LINK/PHY).
Fast closed-loop power control (CLPC) is applied to our
scheme in the downlink to optimize the system performance.
The merit of CLPC has two aspects compared to the alterna-
tive open-loop power control (OLPC).
(1) Under relatively good channel conditions, where fast
fading is not severe, the transmission power for mobiles from
the base station can be kept to the minimum required level
to satisfy the SIR at all times since CLPC performs faster
than channel fading rate. Thus, CLPC is able to compensate
medium to fast fading and inaccuracies in OLPC [17]. As a
result, more transmission power of the base station remains
for voice users that are either far away from the base station
or in a difficult environment, and data users, giving rise to
enhanced system capacity and data throughput in multime-
dia networks.
(2) Under poor channel conditions where users undergo
severe fast fading, OLPC may fail to adapt to the required
transmission power for each mobile due to the slow rate
and inaccuracy of OLPC, resulting in an insufficient power
level to combat channel fading and fulfill QoS requirement.
4 EURASIP Journal on Wireless Communications and Networking
Voice queue Q
V1
Voice queue Q
V2
Data queue Q
D1
.
.
.
Data queue Q
D3
Voice output queue
after sorting
Data output queue
after sorting
Allocated first
Allocated after
Output queue
after allocation
Figure 2: Base station scheduler structure for scheduling framework.
Whereas our approach CLPC solves this problem because the
transmission power is always adjusted accordingly to satisfy
the QoS requirement.
Single-code variable spreading gain (VSG) rate alloca-
tion technique is applied to our scheme, as demonstrated
later, to adjust the transmission rate wh en the satisfaction
cannot be achieved by power adaptation only. According to
the calculation of the transmission rate R after spreading,
R
= W/Γ,whereW and Γ represent the spread spectrum
bandwidth and the spreading gain, respectively, the actual
transmission rate that is obtained can be adjusted by differ-
ent values of Γ, given the fact that W is a constant. Typically,
in the WCDMA standard, Γ
∈{4, 8, 16, 32, 64, 128, 256, 512}.
The a ctual value assigned to Γ depends on the transmission
rate demanded. Note that R is inversely proportional to Γ.
When we select a smaller Γ,wewillobtainalargerR,and
vice versa.
The way that we combine power and rate for our schedul-
ing scheme is to first adjust power with a fixed rate to the
point that the change of power no longer produces any effect
on the scheme (see Section 3.2.2). Then the power is fixed
and the spreading gain will be adjusted to obtain the satis-
factory transmission rate and to fulfill the predefined goal.
More details will be given in the description of the voice/data
framework.
3.2. MAPQ and UF
3.2.1. Voice only: MAPQ
In general, MAPQ has two subprocesses: sorting and alloca-
tion. The operation of MAPQ scheme and its subprocesses is
demonstrated as follows.
MAPQ scheduler sorts incoming traffic into high- (Q
V1
)
and low- (Q
V2
) priority queues based on each packet’s cal-
culated priority value, which is evaluated by jointly consid-
ering required power and buffering delay as AP
i
= a ∗
delay
nor
i
+ b/power
nor
i
, where AP
i
denotes the adaptive pri-
ority for packet i.delay
nor
i
and power
nor
i
are the normal-
ized buffering delay and the normalized required power of
packet i,respectively.Thebuffering delay is defined as the
time interval of the arrival and departure of a packet. For
simplicity, the calculation time of the scheduler is neg lected
for al l packets in the simulation. Zero buffering delay means
that the packet gets served in the first round upon arrival.
Let delay
i
V
thre
denote the buffering delay of packet i, the
delay threshold of voice beyond which voice packets en-
ter Q
V1
. This step is implemented in the scheduler pro-
gramming. It does not indicate the actual packet move-
ment in the memory where the queues locate. Let power
i
and power
mean
denote the required transmission power of
packet i, and the mean downlink transmission power of ac-
tiveusersinonecell.Thenwehavedelay
nor
i
= delay
i
/V
thre
,
and power
nor
i
= power
i
/power
mean
. The way to normalize the
delay and power components in the AP expression ensures
the two terms in AP (a
∗ delay
nor
i
, b/power
nor
i
)comparable.
Parameters a and b are the adaptive factors determining the
weight of delay over power (wdp, in our case voice is delay
sensitive thus a larger wdp should be assigned). The smaller
required power (the better channel condition), or the larger
delay, yields the higher priority (AP). The way to define the
priority profile ensures users with better channels and larger
delays to get served first, thus increases the throughput, re-
duces the voice packet dropping probability, and guarantees
the fairness which is measured by the mean delay in the net-
work.
MAPQ scheduler then allocates resources starting from
Q
V1
according to AP values and total transmission power
budget of BSs. The scheduler does not terminate even if the
user currently being served in Q
V1
requires a power exceed-
ing the remaining budget. Since each user’s priority depends
on both delay and power, higher priorities do not merely in-
dicatesmallerpowers.Also,afterQ
V1
has been fully checked
and if there is power remaining (P
r
), the scheduler will con-
tinue to check Q
V2
and serve available users in Q
V2
using P
r
.
This is the major difference between MAPQ and classic PQ. A
similar concept can be found in [18], where the authors pro-
posed a modified FIFO scheme for power-constraint systems.
This modified queuing fashion can lead to hig her-power uti-
lization efficiency, as will be shown later.
3.2.2. Unified voice/data framework: UF
The rest of this section is dedicated to the discussion of the
UF. In the proposed framework, the allocation scheme is
applied to not only each queue within each class but also
Jin Yuan Sun et al. 5
among classes. It is apparent that voice class has higher prior-
ity than data class, which necessitates the employment of the
proposed allocation algorithm (modified PQ) for each voice
queue to secure the scheduler not skipping to data class be-
fore completing checkup w ithin voice class. However, classic
priority queuing scheduler will not jump to data users until
all the voice users have been served. It may cause power waste
if none of the users in voice queues but some of the users in
the data queue can be served. The proposed allocation algo-
rithm further improves system capacity and throughput by
also performing an exhaustive search within data class after
an exhaustive search within voice class. We do not repeat the
similar part of scheduling in terms of sorting and allocation
for data traffic but would like to emphasize the discrepancy
of data scheduling (sorting and allocation) as follows.
Difference in sorting mainly lies in the expression of
adaptive priority profile. We have for data
AP
i
= a ∗ delay
nor
i
+ b/power
nor
i
+ c/rate
nor
i
,(3)
where AP
i
denotes the adaptive priority for packet i,anda,
b,andc are adaptive constants. Voice and data have different
a, b,andc values. Note that “rate
nor
i
” denotes the normalized
new required transmission power after decreasing the data
rate, using (1), where Γ
= W/R
d
. The nor malization method
is similar to that used for voice power normalization. Here
we use “rate
nor
i
” in order to distinguish from power
nor
i
in the
AP expression. Furthermore, “rate
nor
i
” is used to emphasize
that the new required transmission power is obtained by ad-
justing the data rate.
Voice requires constant bit rate during transmission and
thus it is unlikely to change voice users’ priority through rate
variation. On the other hand, data (best-effort traffic in this
paper unless otherwise specified) transmission rate is vari-
able and can be raised if extra power is available or reduced
without enough power resource to support target rate. In
data scheduling profile, the last term “c/rate
i
”isnotused
until delay exceeds a predefined threshold D
thre
, and the re-
quired transmission power is still too large to increase AP.
If the packet enters this stage (delay >D
thre
), it implies that
merely adjusting power does not get an opportunity for the
packet to be transmitted. At this point, transmission rate is
adjusted since the change of power only no longer produces
any effect. This is the only case where we decrease the re-
quired transmission data rate in order to get a smaller re-
quired power while SIR target is maintained. Since data users
are able to withstand some delay and do not have strict drop
bound, in which case wdp should be less than 1 to serve
users under desirable channel conditions (small transmission
power) with preference.
For simplicity, we set a to 1 and adjust b in the range of
(0, 1) for voice. For data, a is set in the r ange of (0, 1) while
b (or c) is set to 1. We compare to show the sorting sub-
processes and allocation/reallocation subprocesses of voice
and data scheduling in Figures 3 and 4.WeobserveinFig-
ure 3 that the sorting processes for voice (Figure 3(a))and
data (Figure 3(b)) scheduling are similar. While Figure 4 il-
lustrates more complex data allocation process (Figure 4(b))
because of the additional reallocation process.
In the particular reallocation, process data scheduler does
not stop when the remaining power is not enough to sup-
port the current packet, because data transmission rate is
adjustable according to the amount of remaining power re-
source as indicated earlier. Hence, the remaining power (if
any) can be further allocated to specially selected data users
with various transmission rate values. The idea behind is
summarized as follows. After every packet in the queue has
been checked, if there is remaining power for one more
“normal” packet even at minimum rate, this packet gets
served (system capacity increased). If not, share the power
left among “normal” packets since they require lesser power
(data throughput improved). Only if neither of the above
is true, we give the extra power to the first “moderate” or
“urgent” packet in the sorted output queue. This packet has
already been allocated resource after all packets in the data
queue have been scheduled. P
r
is not allotted to “moderate”
or “urgent” packets which are stil l in the queue since they
consume relatively large powers. As queuing delay increases,
they will be assigned a larger AP until eventually get trans-
mitted. This is the key role of delay taken into account in our
design.
4. NETWORK LAYER ADMISSION CONTROL AND
SOFT HANDOFF (NET/LINK/PHY)
High mobility and universal access are enabled by handoff
mechanisms employed in next-generation cellular CDMA
networks. Without handoff, forced termination would occur
frequentlyasmobileuserstraversecellboundaries.
An apparent pair of contradictive parameters represent-
ing resource management efficiency and effectiveness in a
handoff system is the call blocking probability (P
b
) and the
handoff dropping probability (P
d
). Since fixed downlink to-
tal traffic power is shared between newly accepted users and
ongoing handoff users, one’s being greedy will induce an-
other’s being starved. It is therefore important to regulate
and optimize their behaviors by balancing the amount of re-
sources distributed. Based on the fact that interrupting an
ongoing call is more disagreeable than rejecting a new call,
handoff users are issued higher priority to reduce P
d
wher-
ever competition arises. Among numerous prioritizing algo-
rithms [19, 20], resource reservation has attracted an over-
whelming favor owing to lig hter required communication
overhead. However, existing algorithms prioritize handoff
users as an entire category towards new users category. None
of them concerns priority assignment among handoff users,
which is necessary when several users attempt to handoff to a
same target cell simultaneously, under the constraint of lim-
ited available target cell power (guard power P
G
)setaside
for handoffs. By “simultaneously” we mean while the BS is
still handling one handoff request, another one or several re-
quests may emerge, and so forth over and over. This is es-
pecially true in metropolitan cities where the mobile net-
works are mostly busy w ith cellular phone users. It does not
mean two or more requests emerging at exactly the same
time instant, which is not very likely in reality. Therefore,
it is imperative to avoid signaling flood at the moment of
6 EURASIP Journal on Wireless Communications and Networking
Begin
For each existing packet,
buffering delay >V
thre
?
Yes No
Put it into Q
V1
in the
order of arrival time
Put it into Q
V2
in the
order of arrival time
Calculate AP for each packet in each queue
i
= 1: rear, i ++
find the packet with max AP
Schedule this packet
i == rear ?
Yes
No
Results of
voice sorting
(a) Sorting subprocess of voice scheduling
Begin
For each existing packet,
buffering delay
== 0?
Yes No
Put it into queue “normal”
in the order of arrival time
For each existing packet,
buffering delay >D
thre
?
No
Yes
Put it into queue “moderate”
in the order of arrival time
Put it into queue “urgent”
in the order of arrival time
Calculate AP for each packet in each queue
i
= 1: rear, i ++
find the packet with max AP
Schedule this packet
i
== rear?
Yes
No
Results of
data sorting
(b) Sorting subprocess of data scheduling
Figure 3: Sorting processes.
simultaneous handoff requests, since predictions would not
occur at the same time. Please refer to [21] for detailed expla-
nations about the motivation and necessity of the proposed
prioritizing algorithm.
We propose a handoff prioritizing algorithm, employing
a link-layer scheduler with network and physical layer input
(NETWORK/LINK/PHY). For prioritizing handoff users, a
scheduler implementing link-layer scheduling with network-
layer inputs inheres in each base station to regulate incom-
ing handoff requests and to arrange these messages desig-
nated to different target BSs in a specified sequence depend-
ing on the logic of the scheduler, which has been proposed
with physical-layer inputs in the previous section. The sched-
uler applied to BSs is sketched in Figure 5, assuming the cur-
rent serving base station is BS
0
.BS
1
,BS
2
, ,BS
n
denote tar-
get handoff BSs, with n the number of handoff base station
targets.
4.1. Connection admission control (CAC)
Capacity of CDMA systems is “soft.” Acceptance of each new
call increases the interference level of existing ongoing calls
and affects their quality [22]. Hence, CAC is deployed to con-
trol the access to such networks, complying with types of ser-
vice and quality-of-service (QoS) requirement, as well as cur-
rent system load.
With wireless Internet applications growing, the forward
link becomes very critical to system capacity, in that the
bottleneck-like power capacity of BSs imposes stringency on
available power resources allotted to each sharing user. The
CAC mechanism employed in this paper, thereby, is based
on total downlink t raffic power and the precedence of hand-
offs over new calls, which is shown as a handoff request is
admitted if
N
c
on
i=1
P
i
+ P
ho
≤ P
t
,(4)
and a new connection request is admitted if
N
c
on
i=1
P
i
+ P
rsv
+ P
new
≤ P
t
,(5)
where N
c
on
is the number of ongoing calls in cell c,andP
i
, P
ho
,
P
rsv
, P
new
,andP
t
represent the required power of an ongoing
call i, the incoming handoff call, the reservation for future
handoffs (will be discussed later), the incoming new call, and
the downlink total traffic power of BSs, respectively. Both (4)
and (5) conform to the general admission criterion
N
c
on
i=1
P
i
≤
P
t
.
Jin Yuan Sun et al. 7
Results of
voice sorting
Allocate resource for each packet i in Q
V1
with
power pw(i)andrateR
v
based on priority
and power budget (pwt) until pw(i) > pwt
k
= (i +1):rear,k ++
Yes
k
== rear?
No
pw(k) <
= pwt?
No
Yes
Permit packet k to transmit
at power pw(k), rate R
v
;
pwt
= pwt pw (k)
Allocate resource for each packet j in Q
V2
with
power pw(j)andrateR
v
based on priority
and power budget until pw(j) > pwt
k
= ( j +1):rear,k ++
Yes
k
== rear?
No
No
pw(k) <
= pwt?
Yes
Permit packet k to transmit
at power pw(k), rate R
v
;
pwt
= pwt pw (k)
End
(a) Allocation subprocess of voice scheduling
Results of
data sorting
Allocate resource for each data packet i with
power pw(i) and the required rate based on
priority and power budget (pwt) until pw(i) > pwt
k
= (i +1):rear,k ++
Yes
k
== rear?
No
pw(k) <
= pwt?
Yes
No
Permit packet k to transmit at
power pw(k), the required
rate; pwt
= pwt pw(k)
Yes
pw(t)
== 0?
No
All “normal” packets
served (allocated)?
P
r
enough for min
rate of 1st “normal” packet
in the queue?
No
No
Any “normal” packets
served (allocated)?
No
Yes
Yes
Yes
Assign P
r
to the served
(allocated) “moderate”/
“urgent” packet whichever
has the largest AP
End
P
r
= pwt; share P
r
among
them with equal rate
Assign P
r
fully to this packet
with max available rate
Share P
r
among them
with equal rate
(b) Allocation and reallocation processes of data scheduling
Figure 4: Allocation processes.
Handoff requests to BS
1
Handoff requests to BS
2
.
.
.
Handoff requests to BS
n
.
.
.
.
.
.
Output to BS
1
after prioritizing
Output to BS
2
after prioritizing
Output to BS
n
after prioritizing
Ordered by
arrival time
Ordered by
adaptive priority
Figure 5: Base station scheduler structure for handoff algorithm.
8 EURASIP Journal on Wireless Communications and Networking
Measurement
quantity
CPICH1
CPICH2
CPICH3
Cell 1 connected
Event 1A
add cell 2
Event 1C
replace cell 1
with cell 3
Event 1B
remove cell 3
Time
ΔT ΔT ΔT
AS
Th + AS Th Hyst
AS
Rep Hyst
AS
Th AS Th Hyst
(a) A typical soft handoff algorithm
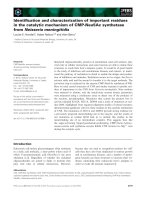
Initiate
Mobiles send PSMM predicting handoff,iff (9),
and transfer pilots to predicted set
BS prioritizes predictions destined to a same cell based on AP values
Any of the above mobiles withdrew, iff (8),
or dynamic channel reservation employed?
BS updates PQ (removing withdrawals) or dynamic P
G
after W
t
,
and signals its neighbors with the updated P
G
(dynamic scheme only)
BSs update PQ (based on the changing power and T
c
)afterW
t
Mobiles send PSMM requesting handoff,iff (7)
Mobiles identified by BS?
BS sends corresponding guard capacity requests to the target
BS allots resources based on mobiles’ order in PQ (if any), procures
guard capacity, an exhaustive search, and informs mobiles by HDM
Mobile transfers pilot to active set and sends back HCM
Terminate
No
Yes
Yes
No
(b) Proposed soft handoff procedure
Figure 6: Soft handoff algorithm and procedure.
4.2. Soft handoff
One of the major benefits of a CDMA system is the ability of
a mobile to communicate with more than one base station
at a time during the call [23]. This functionality allows the
CDMA network to perform soft handoff.Insofthandoff a
controlling primary base station coordinates with other base
stations as they are added or deleted for the call. This allows
the base stations to receive/transmit voice packets with a sin-
gle mobile for a single call.
In forward link handoff procedure, a mobile receives pi-
lots from all the BSs in the active set through associated traffic
channels. All these channels carr y the same traffic (with the
exception of power control subchannel [23]), which facili-
tates the mobile to gain macroscopic diversity by combining
power received from the channels (i.e., maximal ratio com-
bining [24]). Thus, less power is needed implying total inter-
ference lessening and system capacity raising.
A basic soft handoff algorithm typically used in 3G
CDMA systems is illustrated in Figure 6(a) [25], with AS
Th,
AS
Th Hyst, AS Rep Hyst, and ΔT defined as the threshold
of reporting for active set transfer, hysteresis of the former
threshold, replacement hysteresis, and time to trigger, respec-
tively. CPICH is the abbreviation of common pilot channel.
The events, together with the hysteresis mechanism and time
to trigger mechanism are discussed in [25].
We employ a similar basic algorithm with slight simplifi-
cation. The selection of a base station into the active set and
the deletion from the active set are based on dynamic thresh-
olds. Let M
b
ps
and Best
active
ps
be the measured pilot signal from
base station b, and best measured pilot from the active set, re-
spectively. All the variables appearing in the inequalities be-
low have the unit of Watt. A base station b is added into the
active set if
M
b
ps
> Best
active
ps
− AS Th + AS Th Hyst, (6)
for a period of ΔT, and is removed from the active set if
M
b
ps
< Best
active
ps
− AS Th − AS Th Hyst, (7)
for ΔT, where AS
Th, AS Th Hyst, and ΔT are design pa-
rameters.
We briefly describe the mobile-assisted soft-handoff pro-
cedure as follows: mobile detects pilot strength from its mon-
itored set by (6) and sends a pilot strength measurement
message (PSMM) to the serving BS. BS requests resources
from the target handoff cell, allocates traffic channel, and
sends a handoff direction message (HDM) to mobile. Mo-
bile transfers this pilot to the active set and transmits to BS a
handoff completion message (HCM). Mobile starts handoff
drop timer when the pilot strength in the active set meets (7)
and sends to BS a PSMM. Mobile removes the pilot from the
active set to the monitored set as the above time expires.
Jin Yuan Sun et al. 9
Note that the monitoring mechanism enables us to per-
form the prediction for prioritizing without extra network
resources or high cost, as will be discussed in the next sec-
tion.
4.3. Adaptive prioritizing soft handoff algorithm
The parameters and performance measures of the proposed
prioritizing algorithm are a ddressed in this section, together
with the description of the detailed implementation proce-
dure of the algorithm. We mentioned in Section 1 that the
adaptive priority profile is designed by jointly considering
several elements, which are critical to define a specific hand-
off user.
4.3.1. Prediction
First of all, user mobility and location information are
needed by prediction, w hich is the prerequisite of the pri-
oritizing algorithm. This information is utilized by predic-
tions for reserving guard capacity in the literature to track
the speed and moving direction of mobiles. However, Wang
et al. [19] claimed that such information procured from mo-
bility models or GPS monitoring is generally costly and inac-
curate, and complicated as well. As an alternative, they pro-
posed using measured pilot strength to predict handoff (in
IS-95 systems) since it is the origin of every handoff thus
is accurate. Moreover, it is inexpensive since no additional
network signaling is needed. We take advantage of this idea
for the prediction in our algorithm, but modified it for 3G
CDMA systems (i.e., WCDMA). It must be noted that the
prediction method introduced in this paper is not as complex
and precise as the aforementioned one because our focus is
not on guard capacity reservation algorithm. However, with
elaborately designed prediction scheme the significance and
effectiveness of our algorithm will be more prominent.
Typically, in addition to the avoidance of signaling flood,
prediction is updated at the end of every prediction win-
dow W
t
to remove withdrawals (i.e., (7) holds) resulting
from incorrect predictions or call termination (T
c
>D
th
,see
Section 4.3.3 below). The output priority queue (PQ) is up-
dated accordingly based on the latest information procured
through prediction notification from mobiles. When hand-
offsactuallytakeplace,mobileswhichareinPQareiden-
tified by BS and are allocated channels immediately if the
guard power allows. On the other hand, if the handoff re-
quests are not identified as in the regular handoff procedure,
these requests have to be sent to the target cell first since
the BS has to inform the target to reserve power resources,
where there exists the uncertainty about whether these re-
quests can be approved with sufficient resources. Hence with
prediction, the availability of resource is assured to maintain
dropping performance. The handoff execution delay is also
shortened which may cause power outage and fade margin
enlarging [26]. Note that it is wise to shorten this delay by all
means especially in our case. Since additional handoff execu-
tion time can be caused by queuing and sorting the handoff
predictions in the proposed algorithm, which may introduce
computation complexity to the base station and reduce the
base station’s handoff processing speed, all of the above rea-
sons reinforce the need for prediction.
A predicted set is proposed in our algorithm, which con-
sists of BSs satisfying the inequality beneath,
M
b
ps
>λ
Best
active
ps
− AS Th + AS Th Hyst
. (8)
The prediction threshold PS
Th obeys the dynamics of the
threshold for the active set switching, and is related by
PS
Th = λ(Best
active
ps
− AS Th + AS Th Hyst), where λ, λ ∈
(0, 1) is a design constant affecting the prediction threshold
above which the pilot is added into the predicted set, relative
to the active set threshold. The criterion (8)servesasatrigger
for the execution of the prioritizing algorithm. When (8)is
satisfied, MS will report to BS of the prediction and the call
holding time T
c
, and the request will be put into the priority
queue. As long as the queue is not empty, BS will perform the
algorithm at the end of W
t
.
4.3.2. Downlink transmission power
Next, channel condition should be taken into account of the
profile, in that it is the indicator of required handoff power. A
user experiencing better link gain and hence demanding less
power is given a higher priority, in order to get more users
served with the same amount of scarce downlink power re-
source. Assuming the maximum size of the active set is 2 (i.e.,
at most 2 BSs co-serve a handoff user at the same time), we
can apply the maximal ratio combining strategy in (1)tode-
rive the E
b
/I
0
of a mobile i within the soft handoff zone as
γ
i
=
b=0,1
Γ
P
bi
G
bi
P
T
− P
bi
G
bi
+
j=b
P
T
G
ji
,(9)
where 0 and 1 are in general the two coserving base station’s
identity numbers and P
bi
is the transmission power to mo-
bile i from BS b (current BS 0 and target BS 1). The actual
received E
b
/I
0
takes the form of (2). Based on the straig htfor-
ward power division strategy [27](i.e.,P
0i
.
= P
1i
), under the
presumption of
j=0
G
ji
/G
0i
.
=
j=1
G
ji
/G
1i
, the required
handoff power from BS1 to mobile i can be written as
P
1i
.
=
γ
i
P
T
1+
j=1
G
ji
/G
1i
2Γ + γ
i
. (10)
4.3.3. Call-holding time
The last term included in the profile is the call-holding
time T
c
. This information can be easily derived by the UE
(user equipment) through monitoring the connection time
elapsed for the ongoing call. For the proposed profile, we im-
port a parameter D
th
denoting the death threshold for on-
going calls. The ongoing call is presumed to be terminated
by the user before the actual handoff takes place if its T
c
is greater than D
th
at the time the prediction is made. If
T
c
<D
th
holds at the time of prediction, higher priority is
assigned to a longer T
c
. Because it is more probable that this
mobile will terminate its call soon and release the resource
for other mobiles’ use.
10 EURASIP Journal on Wireless Communications and Networking
We finally conclude the adaptive priority profile for user
i as
AP
i
=
1
μP
nor
1i
+ T
nor
ci
, (11)
in which AP
i
is the user i’s priority and μ is the adaptive fac-
tor adjusting the proportion of power and time to be com-
parable quantitatively. P
nor
1i
and T
nor
ci
denote the normalized
downlink transmission power and the normalized call hold-
ing time of user i,respectively.P
nor
1i
= P
1i
/P
mean
,whereP
mean
is the mean downlink transmission power of predicted hand-
off users for the same target cell. T
nor
ci
=T
ci
/T
scale
,where
T
scale
= 10 s is the scale of the calling time. We use a rough
calling time measuring method. The available T
nor
ci
values are
0, 1, 2, , D
th
/T
scale
. While the actual T
ci
values can be any
number between 0 and D
th
, for simplicity, we assume that the
T
ci
/T
scale
values will be ceiled to one of the above T
nor
ci
values
for the AP calculation. This definition style is derived from
the wired networks, where IGRP and EIGRP routing proto-
cols define a composite metr ic associated with each route in
an alike fashion as mentioned in Section 3.Specifically,we
subdivide users into two classes, which are distinguished by
different priority profiles. According to Viterbi et al. [28], the
maximum fade margin (max γ
d
) put apart for overcoming
shadowing correlation (with coefficient a
2
) is obtained at the
cell boundary, subject to a certain outage probability target
(P
∗
out
). Hence, we issue boundary users a lower μ since they
require a higher power for handoff (due to a higher γ
d
)to
ensure fairness. For convenience, we set μ
= 1 for ordinary
users and μ
∈ (0, 1) for marginal users. Dedicated surveys on
fade margin improvement and delicate relations among pa-
rameters such as γ
d
, P
∗
out
,anda
2
are present in [26, 28, 29].
The implementation procedure of the proposed soft
handoff algorithm is drawn in Figure 6(b). Note that we pro-
vide the option of dynamic channel reservation mechanism
in the flowchart, in spite of its absence in our algorithm. Ad-
ditionally, the exhaustive search allocation scheme incorpo-
rated in the flowchart can be traced in [30], where we pro-
posed a modified queuing algorithm, considering that a user
with a smaller required power is p ossible to be at the back of
PQ, since the synthetic AP value is determinant when prior-
itizing incoming users. While in the classic first-in-first-out
queuing scheme, users behind will not be allocated until all
of the front users are served.
5. TRANSPORT LAYER TCP PERFORMANCE
(TRANS/NET/WIRELESS LINK)
TCP congestion control is originated and well investigated in
wired networks where congestion is the main cause of packet
loss, thus operates properly in such networks. But wire-
less networks and mobile terminals feature a large amount
of losses due to bit errors and handoffs, thus are in some
facets non-cooperative with traditional TCP congestion con-
trol, resulting in end-to-end performance degradation. In
wired networks, TCP assumes that packet loss is caused by
congestions and reacts to it by decreasing the congestion
window (cwnd), retransmitting the missing packets, trigger-
ing congestion control/avoidance mechanism (i.e., slow start
[31]), and recalculating the retransmission timer with some
backoff according to Karn’s algorithm [32]. In wireless net-
works, when packet loss occurs for some reasons other than
congestion, such as temporary blackout due to fading, or
when packets are correctly received but the corresponding
ACKs have not been returned which is the so-called spuri-
ous timeout, TCP will perform the same as for reacting to
congestion in wired networks because it is not able to iden-
tify these different types of losses. The spurious timeouts of
TCP in wireless communications eventually lead to unnec-
essary cwnd/throughput drop and inefficientbandwidthuti-
lization, especially in the presence of the well-known stochas-
tic internals of wireless scheduling which is the focus of this
section. We address this problem, present existing solutions,
and provide our algorithm.
Although there are difficulties implementing TCP in
wireless networks, so far no single research has proposed
to replace TCP with another transport layer protocol suit-
able for communications over wireless links. It is unwise
to remove TCP since its hierarchical relationship with pop-
ular application-layer protocols such as HTTP, FTP, TEL-
NET, and SMTP has been well established. In order to fa-
cilitate the seamless integration of mobile communications
through wireless networks with the wired Internet backbone,
TCP over wireless techniques are proposed. In general, the
proposals found in the literature can be categorized into
three classes: split-connection protocols (i.e., indirect-TCP
(I-TCP) [33]), end-to-end protocols (i.e., explicit congestion
notification (ECN) [34]), and link-layer proposals (i.e., for-
ward error correction (FEC) [35]). One may refer to [36]
for a detailed survey on different classifications of TCP-over-
wireless solutions.
To the best of our knowledge, the impact of down-
link scheduling on the performance degradation of TCP in
CDMA networks has not received much research attention.
Two works regarding similar issues in time-slotted networks
have been found in the existing literature. Authors of [37]
proposed a reservoir mechanism at the base station to store
some ACKs during scheduling midseason and release them
in the offseason to avoid spurious timeouts at TCP sources.
It is a revised version or addition of the Snoop protocol [38]
(a special link-layer protocol). The problem of this algorithm
is that they use ICMP packets to measure the round trip
time (RTT) for ACK release interval calculation. These ex-
tra ICMP packets can significantly increase the network traf-
fic especially in a large network w here there are lots of TCP
senders and receivers. In addition, they did not demonstrate
clearly what methodology they utilized to measure the idle
period and the scheduling cycle at the base station. Authors
of [39] proposed to use pure MAC layer information to cal-
culate a TCP-related metric for link-layer scheduling. Thus
TCP performance is maintained when they use this metric in
the link layer to schedule traffic from TCP sources. This al-
gorithm can also be called TCP-aware link-layer algorithm.
A crucial part of this algorithm is to use MAC information to
approximately calculate the average RTT. However, this ap-
proach is very complicated since it requires heavy mathemat-
ical calculations to obtain the new metric at the beginning of
Jin Yuan Sun et al. 11
Wired network
Internet
Server
Mobile host
Mobile host
Wireless network
Base station
Mobile host
RNC
PDSN
RNC
Base station
Base station
Mobile host
Mobile host
Mobile host
(a) The integrated network topology for TCP proposal
FTP/TCP
source
Node
0
Node
1
CBR/UDP
source
Base
station
Node
2
Node
3
Node
4
Node
5
Node
6
Node
7
Mobile
terminals
(b) Network topology for TCP-over-wireless
simulations
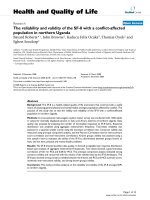
Figure 7: Network topologies for TCP proposal and simulations.
each scheduling cycle and updating of the information for
recursive c alculation afterwards.
One of the innovations of our works is that we propose an
algorithm to eliminate TCP performance degradation due to
wireless scheduling in CDMA downlinks. In this paper, we do
not give details on how wireless opportunistic scheduling im-
pacts TCP performance since it is well illustrated in [37, 39].
We assume it is the existent problem and are concerned with
the solutions in a CDMA environment. As addressed in the
preceding section that in CDMA downlinks, scheduling users
under better channel condition first can improve overall
network performances. Wherever scheduling arises in wire-
less networks, there are impacts on TCP sources. The pro-
posal is based on an example of real-time video transmis-
sions where the jitter is smoothed out at the receiver to en-
sure a constant rate playout. We apply this idea to CDMA
downlink scheduling which introduces stochastic halt affect-
ing TCP performance at the sender (typically a fixed sta-
tion in the wired part of the network from which data can
be downloaded using HTTP or FTP application protocols).
Figure 7(a) depicts the network topology we are dealing with,
where RNC (radio network controller) and PDSN (packet
data serving node) connect the wireless network with the In-
ternet backbone.
TCP mechanism is quite mature in wired networks. The
problem that we are facing now is because of the exclusion
of potential wireless applications when TCP was proposed.
Naturally, one solution would be emulating the behavior of
the wired network, so that the “wireless” effect on TCP could
be eliminated. Wired scheduling is periodical and hence pre-
dictable since every user is equal in terms of channel con-
dition (no time-varying fading over wired links). It can be
prevented and will not be a cause of TCP spurious timeouts.
Thus wired scheduling is not within the scope of our study.
On the other hand, wireless scheduling is unpredictable a nd
thus irregular due to time-varying wireless links (users have
to be rescheduled according to their instant channel fading).
Wireless CDMA networks consist of two parts: the uplink
and the downlink. In the reverse direction (uplink, i.e., from
the mobile station to the base station), the key restriction
is the incremental interference in the system as communi-
cating mobiles increase, due to transmission power levels of
other active users and imperfect orthogonality of channel
codes. Scheduling in this direction is not needed as long as
the system interference stays below the threshold. Here we
assume that the simultaneously active users in the system are
not enough to cause the interference beyond the threshold.
Therefore, scheduling in this direction is of little importance
to be considered by TCP performance. Rather, we focus on
the downlink direction where we proposed novel scheduling
schemes and explained their necessity and effectiveness.
Through the analysis above, downlink scheduling is
the only affecting factor to degrade TCP performance in
our study. Specifically, when interscheduling cutoffs (inter-
vals/halts) occur, there is a temporary silent period in the
wireless part of the network for the scheduler to collect the
up-to-date channel information and to perform the new
scheduling at the base station. During this period, no traf-
fic is in the wireless network and the mobile station will not
send back the expected ACK since it has not received the TCP
packet queued at the base station. Consequently, the TCP
source may undergo spurious timeouts without the ACK it
is expecting.
What if we avoid this burst-and-silence trafficpatternto
smooth the traffic throughout the burst and the following
silence period, just as what we do to avoid annoying jitter
in video playout? Then the TCP packets stored in the base
station will arrive at the mobile station with steady rate and
the mobile station will return the ACK without huge gaps
for TCP to timeout. After the scheduler determines the order
of the packets to be transmitted based on the channel con-
ditions of each mobile user, it calculates a new transmission
rate to send the packets in a steady pace instead of sending
them out all at once. In this case, there is traffic flowing in the
12 EURASIP Journal on Wireless Communications and Networking
Table 1: Key technical specifications of WCDMA.
Multiple access technique
Direct-spread code
Number of slots/frame 15
division multiple access
Frequency reuse 1 Number of chips/slot 2560
Carrier bandwidth
4.4–5.2 MHz Intrasystem handoff Soft/softer handoff
Chip rate of spreading bits
3.84 Mcps Power control period Time slot = 1500 Hz rate
Maximum user data rate
2.3Mbps Powercontrolstepsize 0.5, 1, 1.5, 2 dB (variable)
Frame length
10 ms (38400 chips) Physical layer spreading factors
4
···256 (uplink)
4 ···512 (downlink)
network at all times so that there is no cutoff any more. This
is our Proposal 1. Let the queues at the base station be per-
TCP-flow and the ACK per-packet based (TCP Reno [40]).
Let N
i
be the number of TCP packets in queue i of the refer-
ence base station, let T
bi
and T
si
(in seconds) be the midsea-
son (burst) and offseason (silence) duration of the schedul-
ing cycle of queue i, respectively. The playout rate to smooth
out the “jitter” of the burst traffic R
p
is written as
R
p
=
N
i
T
bi
+ T
si
, (12)
where N
i
is known to the base station through queue moni-
toring, T
bi
+ T
si
is equivalent to one term T
ci
, the scheduling
cycle of queue i, which can be obtained from the history as
T
ci
(n) = (1 − ρ)T
ci
(n − 1) + ρT
ci
(n − 1), (13)
where T
ci
(n)andT
ci
(n − 1) denote the nth and its previous,
the (n
− 1)th, scheduling cycles, respectively. T
ci
(n − 1) de-
notes the average duration of scheduling cycle of queue i up
to scheduling cycle (n
− 1). ρ is a weighing parameter with a
typical value of 1/1000 [39]. The initial value of the schedul-
ing cycle (i.e., T
ci
(1)) can be monitored by the base station
through some timer setting . Having smoothed out the “jit-
ter” using the above algorithm, the base station can “play”
the traffic continuously and get the ACK back to the TCP
sender accordingly, without temporary blackout which is the
root of TCP spurious timeout and performance degradation.
The above proposal can be easily implemented and effec-
tive, which is based on the fact that the ACK flow back to the
TCPsourceiscontinuousaslongastheTCPpacketswaiting
at the base station get transmitted to the mobile destination
continuously. It applies to wireless part of the network with
both comparable and neglig ible delay compared with the de-
lay in wired part of the network, because the timeout interval
is updated by TCP through the measured variable round trip
delay.
6. PERFORMANCE ANALYSIS-SIMULATION
ENVIRONMENT & NUMERICAL RESULTS
We address the performance measure and numerical results
in this section. As argued before (see Section 1), different
interpretation of “cross-layer” yields a different concern on
complex connections among layers. Some layers may inter-
act in terms of one measure while others may be related
in terms of another. In general, it is difficult to generate
a method that conforms the performance measures across
all the four layers involved in our research, as proposed in
Sections 3–5; the interacting layers are LINK/PHY, NET-
WORK/LINK/PHY, and TRANSPORT/NETWORK/LINK,
respectively, where they are associated based on currently
prevalent and practical problems concerned. Thus for each
combination which is formulated by these layers’ featured
relationships/interactions, there are individual measures that
best exhibited the performance gain over noncombination.
This is how we desig n the simulation senarios to exploit the
performance gain for each cross-layer combination.
The simulations of the following subsections are set up in
a WCDMA environment. Some of the key technical specifica-
tions of WCDMA [41] used for our simulation environment
setup are listed in Ta bl e 1.
6.1. MAPQ and UF
Other relevant parameters are 19 wrap-around cells with ra-
dius r
= 500 m (macrocell). One BS is located in the center
of each cell with P
T
= 20 W and a portion of 70% of P
T
is
dedicated to traffic channel [42]. Mobility speed in Rayleigh-
fading model is 10 km/h (vehicular environment), α
= 4,
σ
X
= 8dB,σ
Y
= 2dB,γ
∗
voice
= 5 dB, and γ
∗
data
= 3dB.
Hybrid voice and data users are uniformly distributed,
approximately30userspercellonaverage.Voicetrafficis
modeled a s “ON-OFF” with 50% “ON” duration probabil-
ity, and best-effort data traffic is generated with exponentially
distributed arrival r ate. Generally speaking, voice traffichas
lower transmission rate compared to data traffic. In the in-
tegrated voice/data scheduling scheme, minimum voice rate
R
v
is selected from one of the following values: {8, 16, 32,
64} kbps corresponding to a spreading gain of 512, 256, 128,
and 64, respectively, while R
v
= 64 kbps is the fixed transmis-
sion rate in the voice-only scheduling (MAPQ). Data rate R
d
can be chosen from any available value allowed by the spread-
ing gain set of {4, 8, 16, 32, 64, 128, 256, 512}.
For voice-only scheduling, maximum tolerable delay is
d
max
= 100 ms, and buffering delay (d
b
= 60 ms) is used in
Jin Yuan Sun et al. 13
0.7
0.65
0.6
0.55
0.5
0.45
0.4
0.35
0.3
0.25
Normalized system capacity
0.10.20.30.40.50.60.70.80.91
Trafficload
MAPQ
FIFO
STPD
(a) System capacity comparison for MAPQ
0.9
0.8
0.7
0.6
0.5
0.4
0.3
0.2
Mean normalized delay
0.10.20.30.40.50.60.70.80.91
Trafficload
MAPQ
FIFO
STPD
(b) Mean normalized delay comparison for MAPQ
Figure 8: Performance evaluation of MAPQ.
the simulations to determine the unfairness criterion. The
power for calculating AP is procured from (1). For integrat-
ing voice/data scheduling framework, the delay thresholds
for sorting voice and data packets into different queues are
V
thre
= 10 ms, and D
thre
= 120 ms. The delay bounds of voice
and data packets are 100 ms and 2 s, respectively, which will
be used in the mean normalized delay calculation in the fol-
lowing section.
We first define the performance measures used in the
MAPQ and UF simulations for voice and data. Define N
F
,
N
A
, N
S
, N
C
, ψ
F
,andψ
A
as the total number of users in the
network (in our case 30/cell), the number of active users in
the network, the number of active users actually served, the
number of cells in the system (in our case 19), the through-
put (kbps) of the system if all the active users can be served,
and the actual throughput of the system, respectively.
(1) MAPQ for voice only.
(i) Normalized system capacity (throughput)-ψ
A
/ψ
F
.
Note that voice packets have constant transmission
rate thus the capacity and throughput have similar
behaviors.
(ii) Packet dropping probability—(number of packets
dropped)/(number of packets transmitted). A voice
packet is dropped if its buffering delay exceeds the
delay bound (100 ms).
(iii) Unfairness probability—we call it “unfair” if a
user’s buffer ing delay is greater than d
b
yet not
served. Therefore, unfairness probability refers to
the probability that such unfair event happens. One
possible way is to use N
UP
/N
A
to measure it, where
N
UP
is the number of users that experience unfair-
ness.
(iv) Trafficload-N
A
/N
F
.
(2) UF for hybrid traffic.
(i) System capacity-N
S
/N
C
.
(ii) Traffic throughput-ψ
A
/N
C
.
(iii) Outage probability: fraction of time that a user’s
received power is below the minimum acceptable
power level to satisfy the target SIR.
(iv) Average power utilization (efficiency)—(total
power consumed)/(total trafficpowerbudgetof
BSs). It acts as the indicator of resource consump-
tion efficiency.
(v) Voice ratio—the proportion of voice traffic in the
hybrid traffic. It controls the variation of the hybrid
trafficstructure.
(3) For both MAPQ and UF.
(i) Mean normalized delay:
N
s
i=1
normalized delay of packet
i
N
s
, (14)
where the numerator equals to
buffering
delay of packet
i
delay bound of packet
i
. (15)
We measure the normalized delay only for success-
fully served users because there are other criteria,
voice dropping probability and data outage, to illus-
trate the behavior of each scheduling scheme with
service f ailures.
6.1.1. Voice only: MAPQ
The simulation runs over 100 000 times. Compared to sys-
tems where no sorting scheme nor modified PQ allocation
14 EURASIP Journal on Wireless Communications and Networking
0.9
0.8
0.7
0.6
0.5
0.4
0.3
0.2
Voice dropping probability
0.10.20.30.40.50.60.70.80.91
Trafficload
MAPQ
FIFO
STPD
(a) Dropping probability comparison for MAPQ
0.9
0.8
0.7
0.6
0.5
0.4
0.3
0.2
Unfairness probability
0.10.20.30.40.50.60.70.80.91
Trafficload
MAPQ
FIFO
STPD
(b) Unfairness probability comparison for MAPQ
Figure 9: Performance evaluation of MAPQ.
scheme (FIFO) is deployed, system p erformances of the
MAPQ scheme in terms of system capacity, voice packet
dropping probability, mean normalized delay, and unfairness
probability improve in various degrees, as shown in Figures
8 and 9,respectively.
As the traffic load grows heavier, the performance gain
of the proposed scheme becomes more apparent. This can
be explained by the following observations. When the power
budget is getting tighter and users are more competitive for
limited resources, the FIFO scheme is not c apable of produc-
ing satisfactory results due to its inadaptability to severe sys-
tem environment. While the MAPQ scheme is generally sta-
ble and insensitive to throughout traffic variation, and able to
produce acceptable outcomes even if experiencing stringent
conditions, as a result of well designed adaptive features.
Moreover, we compare the MAPQ scheme with a more
advanced scheduling scheme in the literature named STPD
(scheduling with transmission power and delay) [15]. In this
scheme, packets whose required transmission power is less
than a threshold P
th
are classified into Group 1, otherwise
are classified into Group 2. For real-time trafficlikevoice,if
the maximum buffering delay of Group 1 is less than a delay
threshold, Group 2 is transmitted first to avoid the exceed-
ing of the tight delay bound. While for non-real-time traf-
fic like data, Group 1 is always transmitted first since it is
delay-tolerable. This algorithm is less complex in calculation
since it does not use the priority to sort each packet. How-
ever, the simplicity may result in some degradation of the
performance, as shown in Figures 8(a) and 8(b), where ob-
viously the more complex MAPQ scheme performs better in
terms of both the system capacity and the mean normalized
delay in the network.
TheMAPQschemenotonlyoutperformstheSTPD
in these criteria, but also maintains other performances in
terms of voice dropping probability and unfairness probabil-
ity, as shown in Figures 9(a) and 9(b).InFigure 9(b), MAPQ
and STPD almost have the same performance but as the traf-
fic load becomes heavier, the MAPQ shows the t rend to out-
perform the STPD.
Note that the fairness cr iterion in our simulation is im-
plied by both the mean normalized delay and the unfairness
probability measures. Smaller normalized delay and lower
unfairness probability indicate higher degree of fairness.
We also testified the necessity of both sorting and the al-
location subschemes of MAPQ scheme by comparing MAPQ
with two reference cases, namely, allocation (modified PQ)
without sorting and sorting without allocation (classic PQ).
The proposed scheme outperforms both of the references
in terms of system throughput, packet dropping probability,
and unfairness probability with 2%–10% performance gains
(not shown in this work).
6.1.2. Unified voice/data framework (UF)
Individual performance gain of voice under the proposed
scheduling algorithm has been procured and illust rated
above in terms of system capacity/throughput, packet drop-
ping probability, and unfairness probability. Note that the
values of a, b,andc used in the simulation are obtained from
the estimation.
In this section, we focus on measurable performance of
hybrid voice/data traffic under the proposed unified frame-
work. Three reference algorithms are compared with our
algorithm, and evaluation is realized through several sig-
nificant criteria: system capacity, traffic throughput, outage
probability, average power utilization, and mean normalized
delay. the first reference algorithm employs SPS (static pri-
ority scheduling) [18] algorithm for either class, the sec-
ond reference algorithm employs STPD (scheduling with
Jin Yuan Sun et al. 15
30
25
20
15
System capacity
0.10.20.30.40.50.60.70.80.9
Voice ratio
UF
SPS
STPD
(a) System capacity comparison for UF
10
3
3.5
3
2.5
2
1.5
1
Traffic throughput (kbps)
0.10.20.30.40.50.60.70.80.9
Voice ratio
UF
SPS
RF
STPD
(b) Traffic throughput comparison for UF
Figure 10: Performance evaluation of UF.
transmission power and delay), and the third reference algo-
rithm employs data scheduling only, which is the popular RF
(rate fairness) algorithm as in [43, 44]. They represent three
typical simulation conditions.
Figures 10 and 11 show the comparison results in terms
of system capacity, traffic throughput, outage probability,
power utilization efficiency, and mean normalized delay, re-
spectively. The results are obtained by averaging over differ-
ent load situations. The proposed algorithm achieves better
performance in all cases in comparison with SPS and STPD.
The proposed framework illustrates an appropriate combi-
nation of individual performance sustentation as well as in-
tegrated optimization and robustness. Figure 10(a) exhibits
the capability of the proposed algorithm to explore the bursty
nature of the data traffic with a visible steep slope of the solid
square-marked curve under the variation of traffic ratio. This
capability benefits from discrepancy of voice/data schedul-
ing (i.e., different adaptive priority profiles, data reallocation
mechanism) in the framework. While SPS (dashed asterisk-
marked curve) appears mildest under the trafficstructure
change, as a result of limited capacity and resource utilization
capability. Solid square-marked curves of Figures 10(a) and
10(b) confirm the results in [45] in which system through-
put (Figure 10(b)) decreases with the reduction of data por-
tion, probably because of the fact that data traffichasmuch
more burst and much higher bit rate, thus is more susceptible
to load change and affects more on throughput and capacity
(Figure 10(a))behaviors.
Although RF has much higher traffic throughput (ob-
served in Figure 10(b), circle-marked dash-dot curve) be-
cause it distributes rate equally among all active users regard-
less of actual channel impairments, which comes at the ex-
pense of users being served with power below the minimum
acceptable target at most of the time (circle-marked dash-dot
curve in Figure 11(a)), this insufficient transmission power
fails to combat channel fading and causes transmission fail-
ure (SIR target unsatisfied). While the power baseline in SPS
is assured, because of the lack of sorting process, users are
served in a first-in-first-out mode where a user occupying
large power is possible to be al located before users request-
ing smaller power. Also, due to our allocation subalgorithm
which is based on an exhaustive search mechanism, system
capacity and traffic throughput of the proposed algorithm
outperform those of SPS as displayed in Figures 10(a), 10(b)
(solid versus dashed curves), respectively, without sacr ificing
QoS satisfaction degree (here defined by outage probability
as in Figure 11(a), solid versus dashed curve).
Aside from the exploitation and maintenance of individ-
ual behavior features, the capability of attaining overall op-
timization and robustness to var ious traffic structure, result-
ing from the consistent infrastructure of the framework, is
depicted in Figures 11(a), 11(b),and11(c), since in these fig-
ures the fluctuation of the trafficstructuredoesnotaffect UF
much.
Voice tra ffic has less burst, smaller range, and lower data
rate than data traffic. Wang et al. [19
] advocates that with
the same total offered load, a larger fraction of voice permits
better multiplexing and hence more efficient resource usage,
giving rise to the fluctuation of average power utility with
voice ratio, shown in their simulation results. On the con-
trary, Figure 11(b) convincingly illustrates that the UF guar-
antees power utilization efficiency at above 97% at all times
benefiting from data reallocation mechanism and is resistible
to a variety of offered traffic load and voice/data ratio. At the
same time, the obvious fluctuation of the dashed curve and
the dotted curve reflects the vulnerability of SPS and STPD
under the altered trafficstructure.
Further, the reallocation mechanism ensures “good”
users to be better and “poor” users to be ser ved, leading
to fairness protection as shown in Figure 11(c),lowand
16 EURASIP Journal on Wireless Communications and Networking
1
0.9
0.8
0.7
0.6
0.5
0.4
0.3
0.2
0.1
0
Outage probability
0.10.20.30.40.50.60.70.80.9
Voice ratio
UF
SPS
RF
(a) Outage probability comparison for UF
1
0.95
0.9
0.85
0.8
0.75
Average power utilization
0.10.20.30.40.50.60.70.80.9
Voice ratio
UF
SPS
STPD
(b) Power utilization efficiency evaluation for UF
0.9
0.8
0.7
0.6
0.5
0.4
0.3
0.2
0.1
0
Mean normalized delay
0.10.20.30.40.50.60.70.80.9
Voice ratio
UF
SPS
STPD
(c) Mean normalized delay (fairness) evaluation for UF
Figure 11: Performance evaluation of UF.
insensitive outage occurrence (solid curve in Figure 11(a),
reflecting high degree of QoS satisfaction) throughout var-
ied voice ratio.
Figure 11(c) shows the outstanding delay performance
of the UF scheme. In general, higher voice ratio yields bet-
ter delay performance since data packets may experience
much longer delay thus have larger impact on the delay be-
havior in the network. In fac t, the delay behavior of the
MAPQ scheme in Figure 8(b) does not show such striking
performance enhancement. We mentioned before that data
packet delay is usually much larger than voice packet de-
lay. The data packet delay performance determines the de-
lay performance of the entire network. Therefore, we can
conclude that the result in Figure 11(c) suggests that the
gain of the UF scheme comes largely from the desirable de-
lay performance of data users. Due to the dominant char-
acteristics of data packet delay in the network, this perfor-
mance gain also compensates for the voice packet delay per-
formance, observed as a nearly flat curve (the solid s quare-
marked curve) in Figure 11(c).Thisnonfluctuateddelayper-
formance curve further demonstrates the fairness assurance
among data users in the UF scheme. In addition, it implies
that, in the MAPQ scheme, the improved performance of
voice packets does not necessarily sacrifice the data packets
behavior (i.e., data packet delay).
We believe all of the above gains are acquired from the
unity of proposed framework and innovative sorting and al-
location (reallocation) mechanisms deployed within.
Jin Yuan Sun et al. 17
Table 2: Simulation parameters of the proposed handoff algorithm.
System parameters Value Handoff parameters Value
Bandwidth/chiprate 5 MHz/3.84 Mcps AS Th/AS Hyst/ΔT 2dB/2dB/0
Cell radius 1000 m (macrocell) W
t
, D
th
1s,2min
User locations/arrival type Uniformly/exp. distributed T
c
(exp. distributed) Mean 1 min
P
T
, P
t
20 W, 70% P
T
P
G
(for each neighbor) 4% P
t
Tra ffic model ON-OFF, 50% ON Prob. λ, μ 0.85, 0.8
User mobility/max speed 2-dimen. Rand. walk/100 Km/h a
2
0.5
R
v
set {64, 32, 16, 8} kbps Max. γ
d
6.2dB
α/σ
X
/γ
∗
4/8 dB/5 dB P
∗
out
0.1
6.2. Prioritizing handoff algorithm
Next, the performance of the network layer proposal is
evaluated. Table 2 displays the system and handoff param-
eters for our simulation senario. Handoff parameters such
as W
t
/λ/P
G
, μ (derived from normalized R
s
, the radius of
nonsoft handoff zone in [46]), and a
2
/γ
d
/P
∗
out
are obtained
from [19, 28, 46], respectively. In [19], a fixed guard capacity
reservation scheme is shown to have similar performance to
their dynamic ones in terms of new call blocking probability,
handoff dropping probability, and average power utilization
but with higher guard power waste at lighter load. Therefore,
we employ fixed reservation scheme for simplicity and gen-
erate heavier traffic load (50%–100%) to diminish the guard
power utilization discrepancy. Offered traffic load used in the
following figures is the actual amount of traffic normalized
bythefullyloadedamountoftraffic in the network. Heavier
traffic load imposes greater challenge on the success of the
proposed algorithm because of more severe dropping condi-
tion.
Figures 12(a)–12(c) demonstrate that the proposed pri-
oritizing algorithm outperforms the FG (fixed guard capac-
ity) scheme [19] in terms of handoff dropping probabil-
ity (P
d
), average guard power efficiency, and average guard
power utilization, under the same prediction scheme and
general handoff procedure proposed in Section 4.3. These
performance measures are defined below , where N
tho
, N
d
,
N
ssho
, P
rsv grd
,andP
sum ho
denote total number of received
handoff calls, the number of blocked (dropped) handoff
calls, the number of successful handoff users, total reserved
guard power, and total consumed guard power (sum of suc-
cessful handoff powers der ived from (10)), respectively.
(i) P
d
-N
d
/N
tho
.
(ii) The guard power efficiency-N
ssho
/P
rsv grd
. It indicates
the number of successful handoff users that can be
supported by consuming certain P
rsv grd
, thus clarifies
the efficiency of P
rsv grd
.
(iii) The guard power utilization-P
sum ho
/P
rsv grd
. It indi-
cates the utility of the reserved guard power. If it is too
low, that implies the underutilization and a waste of
system resources.
We run over 10 000 trials and get the averages of the
above performance indicators as seen in Figures 12(a), 12(b),
and 12(c).
The reason for the outperformance has two folds which
reflect the innovation of the proposed prioritizing algorithm.
(1) Handoff users demanding smaller powers are scheduled
first in general, contributing to a larger number of successful
handoff users with the same amount of guard power, thus P
d
is reduced (Figure 12(a))andpowerefficiency is enhanced
(Figure 12(b)).
(2) Handoff users who have been connected for a longer
call time (T
c
<D
th
) are more likely to cease and re-
lease resources shortly, before other concurrent handoffsare
dropped due to the lack of enough guard resources. It can be
interpreted as the resource borrowing (or reuse) mechanism
of earlier and faster handoffs from slower handoffs, giving
rise to higher guard power utilization (Figure 12(c)).
Note that an overlow λ triggers more frequent and false
predictions, because it extends the active set and may lead
to too weak potential BSs. While an overhigh one hinders
potential true predictions. Consequently, this parameter has
to be designed carefully. The authors [19] addressed similar
concerns on λ.Weuseλ
= 0.85 as indicated in [19].
From Figures 12(b) and 12(c) we observe that higher of-
fered load yields larger difference between the proposed algo-
rithm and the FG. Indeed, whether the guard capacity reser-
vation scheme is fixed or adaptive produces no distinc tion in
terms of average guard power utilization, as shown in [19].
However, the fixed and adaptive reservation schemes can af-
fect the handoff dropping probability to have very different
performances, which is verified also in the above research
work. Additionally, the authors show that the adaptive reser-
vation schemes exhibit greater difference between each other
as the offered trafficloadgrows.Butsinceweemployfixed
reservation schemes, the fixed guard power may fail to ex-
ploit or adapt to the dynamics of the handoff dropping prob-
ability when the system is highly loaded and has poorer drop-
ping behavior. This explains the reason for the nearly paral-
lel curves in Figure 12(a). In the future research, more per-
formance gains of dropping probability are expected with
the employment of the adaptive guard capacity reservation
scheme in the proposed handoff algori thm.
18 EURASIP Journal on Wireless Communications and Networking
10
2
2.6
2.4
2.2
2
1.8
1.6
1.4
1.2
1
0.8
Dropping probability
0.50.60.70.80.91
Offered trafficload
Proposed handoff algorithm
FG
(a) Handoff dropping probability
2.5
2.4
2.3
2.2
2.1
2
1.9
1.8
1.7
Average power efficiency
0.50.60.70.80.91
Offered trafficload
Proposed handoff algorithm
FG
(b) Average power efficiency for handoff algorithm
0.65
0.6
0.55
0.5
0.45
0.4
Average power utilization
0.60.70.80.91
Offered trafficload
Proposed handoff algorithm
FG
(c) Average power utilization for handoff algorithm
Figure 12: Performance evaluation of the proposed handoff algorithm.
6.3. TCP cwnd behaviors
Finally, the performance analysis of transport-layer TCP/
wireless is presented. This section is dedicated to the nu-
merical results for the feasibility of the proposed algorithm
(Proposal 1) for TCP performance improvement, in terms of
the evolution of TCP congestion window (cwnd) and TCP
throughput. With the reasonable analysis and implementa-
tion details, success and effectiveness of the proposed al-
gorithm is further confirmed in the simulation. While the
network simulator-version 2 (NS-2) [47]modelsdonot
support CDMA air interface or CDMA MAC implementa-
tions, there is difficulty to simulate the TCP p erformance
with the presence of the proposed scheduling schemes in NS-
2. In this paper, we provide the experimental results using
MATLAB and leave the simulations in NS-2 for future work.
We set up a simple network as shown in Figure 7(b),where
there are a FTP source (node 0) sending TCP (data) traffic
and a CBR source (node 1) sending UDP (voice/video, re-
ferred to as voice hereafter for simplicity) traffic. We create 5
nodes (nodes 3–7) at the wireless terminal as the receivers of
both TCP and UDP packets. The base station is modeled by
node 2 connecting the bottleneck link. Note that the simula-
tion for Proposal 1 does not include the UDP sender thus
studies the TCP performance based on a pure TCP-traffic
network. However, the simulation for the extended analy-
sis of the design parameters employs exactly the topology as
Figure 7(b).
The M Ss act as the TCP sinks. Assume that the TCP
sender always has data to transmit and can transmit as many
packets as its transmission window allows (bulk TCP data).
The TCP sinks receive TCP packets to deliver them to the user
and generate immediate ACKs for the TCP sender. The TCP
mechanism implemented for the experiment is only related
Jin Yuan Sun et al. 19
30
25
20
15
10
5
0
cwnd (packets)
300 350 400 450 500 550 600
Nominal simulation time
(a) Evolution of TCP cwnd for standard TCP
45
40
35
30
25
20
cwnd (packets)
300 350 400 450 500 550 600
Nominal simulation time
(b) Evolution of TC P cwnd for P roposal 1
Figure 13: Performance evaluation for TCP cwn d behaviors.
to dynamic congestion window evolution, according to the
slow start and congestion avoidance algorithms [31]. Other
mechanisms such as retransmission and recovery for error
control are not considered.
The data is transmitted using variable bit rate in the TCP
packets with a length of 1000 bytes/packet. Voice (only sim-
ulated later in the extended analysis for design parameters
analysis) is transmitted in the UDP packet with constant
bit rate selected from one of the following values: 8 kbps,
16 kbps, 32 kbps, and 64 kbps, as used in the scheduling
schemes in Section 3. The packet length of a UDP packet
is a design parameter in our research and will be demon-
strated later. The buffers proposed in the base station and the
TCP sender are per-TCP-connection and drop-tail, with the
size varied in the simulation. The bandwidth and propaga-
tion delay of the wired connections (node 0-node 2, node 1-
node 2) are 20 Mbps and 20 ms, while they are set to 1 Mbps
and 1 ms for the wireless connections (node 2-node i, i
=
3, 4, 5, 6, 7).
Since the scheduling cycle and interscheduling cutoff pa-
rameters vary depending on the complexity and execution
time of different scheduling schemes, no typical parame-
ters are found in the literature. In reality, wireless service
providers deploy real-time monitoring systems to obtain use-
ful statistics such as link activity, bandwidth utilization, link
occupation time, throughput, for internal and external uses.
Link activity makes the scheduling cycle easy to be measured
because the link will be idle if interscheduling cutoff hap-
pens. In our simulation, NS-2 provides real-time monitoring
mechanisms such as queue-monitor by which we can mea-
sure the scheduling cycle using the packet arrival-departure
statistics in the queue-monitor output. Interscheduling cut-
off happens at 0 departures.
6.3.1. Proposed TCP algorithm
The congestion window behavior of Proposal 1 is compared
to that of the standard TCP, TCP Reno [40] with standard
ACK (one ACK per TCP packet). The design parameter cho-
sen for this purpose is the buffer size/queue limit BU. We set
it to 40 (packets) based on the analysis in the extended sim-
ulations. Figures 13(a) and 13(b) illustrate the evolution of
cwnd in terms of the nominal simulation time, for standard
TCP and Proposal 1, respectively. Note that the nominal sim-
ulation t ime is used as the x-axis instead of the real simula-
tion time (s) because of the lack of the simulator. We run the
simulation created by algorithms in MATLAB for over 60 000
times, approximately every 10 000 times represents a 100 s in
a real simulator (i.e., NS-2). The curves in Figures 13(a) and
13(b) are plotted using the data obtained from every nominal
time (0.01 s in NS-2).
In order to distinguish the spurious timeout and the real-
loss-triggered timeout, we set the wireless link loss (due to
shadowing and fading) to be 0. The irregular fluctuation of
the cwnd in Figure 13(a) suggests only the spurious time-
out due to wireless scheduling intervals and implies the in-
competence of the standard TCP in the presence of wire-
less scheduling, which is implemented based on the MAPQ
and the UF schemes proposed in Section 3. We also observe
from Figure 13(b) that, compared to standard TCP, Proposal
1 performs much better in the cwnd evolution because it
avoids the spurious timeouts which largely degrade the cwnd
performance. We acquire the desired cwnd behavior from
Figure 13(b) that the congestion window keeps increasing
until the buffer overflows. Thus, the maximum window size
is always maintained which is approximate to the bu ffer size
(in our simulation 40 packets). While the congestion window
behavior in Figure 13(a) does not obey the sawtooth shape,
and the achievable window size is even less than 20.
In addition, we analyze the TCP throughput performance
for the standard TCP and Proposal 1, as displayed in Tabl e 3.
The throughput is calculated by
Thru
TCP
= L
TCP
N
TCP
/T
nom
, (16)
where Thru
TCP
, L
TCP
,andN
TCP
denote the TCP through-
put (bps), the TCP packet length (8000 bits/packet), and the
20 EURASIP Journal on Wireless Communications and Networking
Table 3: TCP throughput comparison.
TCP scheme Throughput (kbps) Number of TCP packets generated
Standard 54.216 89149
Proposal 1
70.217 90125
Table 4: Effects of design parameters on TCP cwnd behavior.
PS
(CBRR=64,BU=30)
Achievable
CBRR
(PS=80,BU=30)
Achievable
BU
(PS=80,CBRR=64)
Achievable
cwnd cwnd cwnd
80 5.9820.520 3.9
200 7.7 16 14 200 11.2
1000 16.832 8.2 400 21.1
total number of TCP packets generated (shown in Table 3),
respectively. T
nom
denotes the total nominal simulation time.
We may not see striking throughput gain from this ex-
ample since the network we built is relatively simple thus not
enough traffic is generated to test the throughput behavior.
But from the tendency one can clearly tell that Proposal 1 has
more desirable throughput performance than the standard
TCP. We believe that with heavy loaded network simulated
in the future, this throughput gain will be more apparent.
6.3.2. Extended analysis of the design parameters
Although the impacts of the network layer QoS profile, which
manages the queuing disciplines and the bandwidth alloca-
tion, are beyond the scope of this research, we analyze the ba-
sic role in the evolution of TCP congestion window since the
queuing mechanism for Proposal 1 at the base station makes
use of the network layer functions. We found through the
simulation by using NS-2 that, in general, the variations of
PS (voice packet size), CBRR (voice transmission rate), and
BU have great impacts on TCP cwnd. In the subsequent sim-
ulations, we employ standard TCP over the wired network
(topology shown in Figure 7(b)) with 0 loss rate to study the
effects of the design parameters. Table 4 illustrates the change
of cwnd as a result of the varying PS (in the simulation 80,
200, and 1000 bytes) with CBRR fixed at 64 kbps and BU 30
packets; the vary ing CBRR (8, 16, and 32) with fixed PS and
BU at 80 and 30, respectively; the varying BU (20, 200, and
400) with fixed PS 80 and fixed CBRR 64.
It is noticed that a smaller PS results in greater reduction
of congestion window size, which will largely affect the im-
provement of TCP throughput. The reason maybe that since
the wired links in the network have the same bandwidth,
the smaller voice packets produced by the CBR source arrive
faster and have a higher generation rate. They are of higher
probability to be queued in front of the bigger data packets
thus get transmitted first. On the other hand, data packets
are more likely to be dropped if the queue overflows. This
loss of TCP packets will further lead to the loss of the cor-
responding ACK. It will eventually t riggers the TCP timeout
and then the congestion window reduction. Note that we did
not configure queuing-related parameters (e.g., queuing dis-
ciplines) since they are not considered in this research. By
default the queue is FIFO and drop-tail.
The CBRR impacts present the rationale explicitly: the
higher the voice tr ansmission rate is, the more likely that
there is congestion in the network since the bandwidth re-
source becomes more demanding. The increasing contention
for the available bandwidth will induce more packet loss for
both traffic, and the timeouts will occur inevitably which de-
creases the congestion window size.
It makes sense from the BU effects that if the buffer is
designed to be small, the memory required for buffering is
low trading off the maximum attainable cwnd because the
buffer will be full rapidly. In other words, optimizing the con-
gestion window with a large buffer challenges the excessive
memory which can be costly. The buffer selection is hence
important as well as complicated and should be designed
carefully. Furthermore, we realize through the comparison of
16 kbps CBRR and 200 packets BU that a lower transmission
rate(16kbpsversus64kbps)requiresaconsiderablysmaller
buffer (30 versus 200), yielding similar or even better cwnd
performance. Analysis of the buffer size is the only issue in-
volved as the network-layer mechanism that we address in
this work. Taking the comparison and analysis of this sub-
section into account, we designed the simulation parameter
BU in the earlier simulation.
From the extended analysis of the design parameters, we
further conclude that for an algorithm or a protocol to work
appropriately, several key parameters (i.e., PS, CBRR, BU)
need to be tuned carefully.
The experiment and simulation for this subsection are
primarily operated for verifying the feasibility and effective-
ness of the proposed strategies. It is preparatory for our fu-
ture research which includes in-depth study of the impacts
of varying TCP/UDP traffic ratio on TCP behaviors in the
integrated wired/wireless environment which were somehow
demonstrated in the above simulations; a more realistic net-
work structure and traffic generation for overcoming prac-
tical problems, such as the existent “wireless” effect on TCP
performance, using NS-2.
Jin Yuan Sun et al. 21
7. CONCLUSIONS AND OPEN ISSUES
In this work, we analyzed and designed cross-layer algo-
rithms/schemes to improve overall performance across the
entire cellular CDMA network, specialized in downlinks. We
proposed a link-layer scheduling scheme MAPQ as a cross-
layer resource management issue for efficient resource alloca-
tion of underlying layer. Evaluation of the proposed scheme
has been performed with a reference scheme and superiori-
ties are verified. It should be noted that this scheme can also
be used for data scheduling w ith slight modification of wdp
(weight of delay over power) and QoS requirement of data
traffic.
Considering queuing delay as an important event trig-
ger and service indicator, together with required transmis-
sion power/rate, we also proposed an adaptive priority-based
scheduling algorithm for unified voice/data frameworking
and succeeded in fulfilling preset expectation through sim-
ulation.
By jointly considering downlink transmission power and
call holding time, we proposed an adaptive prioritizing algo-
rithm to control concurrent handoff events to the same des-
tination. The performance improvement was obtained in the
simulation.
At the transport layer, we studied its interaction with
wireless link layer, particularly, wireless link scheduling. We
proposed an algorithm to avoid TCP spurious timeouts, to
regulate the behavior of TCP congestion window, and to en-
hance the TCP throughput. These methods are claimed to
be reasonable by theoretical analysis as well as the simula-
tion verification. Extension of the simulation network and
the traffic load scale to obtain greater performance gain of
the proposed strategies is left to our future work.
Note that the complexity of our scheduling algorithms
is determined fully by the real-time monitoring system. The
computational part of the algorithms is simple. Once the pa-
rameters involved in the algorithms are procured from real-
time measuring, the rest of the work is just simple calcula-
tions. In our algorithms, power and delay are the key param-
eters to be obtained. The downlink transmission power for
each subscriber is monitored and adjusted frequently to en-
sure the quality of service. The buffering delay is another im-
portant QoS measure, especially where the system resource
needs to be allocated to support class-of-service. It is criti-
cal to ensure the delay bound for different classes. As men-
tioned above, wireless service providers are equipped with
such monitoring system to make the procurement of these
parameters in real time possible.
Although the results obtained are what we have expected
and are encouraging, there are some open issues and limita-
tions of this work which call for deeper investigation.
Further Considerations
(1) The performance of the unified voice/data scheduling
framework was studied in a 19-cell layout. However, we can
further consider the effects of the load variations in the outer
cells on the performance in a target cell.
(2) In Section 3, further details pertaining to the choice
of the parameters (a, b,andc) will be provided.
(3) Another aspect which is not covered in this algorithm
is the additional handoff execution time caused by the intro-
duction of the priority queuing. This can be important when
signals from cells in the active set are dropping quite fast.
(4) To import dynamic or adaptive guard capacity reser-
vation scheme to the proposed handoff prioritizing algo-
rithm would be an interesting topic.
(5) More results will be shown on the role of λ (the de-
sign parameter that alters the prediction threshold in the pro-
posed handoff algorithm) and the capacity of base stations.
(6) For the TCP proposals, we will build up a larger scaled
network where more subscribers and application sources will
be generated for deeper understanding of the TCP behaviors.
(7) In-depth study of the impacts of varying TCP/UDP
traffic ratio on TCP behaviors in the integrated wired/wire-
less environment.
REFERENCES
[1] A. J. Goldsmith and S. B. Wicker, “Design challenges for
energy-constrained ad hoc wireless networks,” IEEE Wireless
Communications, vol. 9, no. 4, pp. 8–27, 2002.
[2] L. Alonso and R. Agusti, “Automatic rate adaptation and
energy-saving mechanisms based on cross-layer information
for packet-switched data networks,” IEEE Communications
Magazine, vol. 42, no. 3, pp. S15–S20, 2004.
[3] F. Yu and V. Krishnamurthy, “Cross-layer QoS provisioning in
packet wireless CDMA networks,” in Proceedings of IEEE Inter-
national Conference on Communications (ICC ’05), vol. 5, pp.
3354–3358, Seoul, Korea, May 2005.
[4] J. Price and T. Javidi, “Cross-layer (MAC and transport) opti-
mal rate assig nment in CDMA-based wireless broadband net-
works,” in Proceedings of the 38th Asilomar Conference on Sig-
nals, Systems and Computers, vol. 1, pp. 1044–1048, Pacific
Grove, Calif, USA, November 2004.
[5] V. Friderikos, L. Wang, and A. H. Aghvami, “TCP-aware power
and rate adaptation in DS/CDMA networks,” IEE Proceedings:
Communications, vol. 151, no. 6, pp. 581–588, 2004.
[6] E. Hossain and V. K. Bhargava, “Cross-layer performance in
cellular WCDMA/3G networks: modelling and analysis,” in
Proceedings of IEEE International Symposium on Personal, In-
door and Mobile Radio Communications (PIMRC ’04), vol. 1,
pp. 437–443, Barcelona, Spain, September 2004.
[7]J.Yao,T.C.Wong,andY.H.Chew,“Cross-layerdesignon
the reverse and forward links capacities balancing in cellular
CDMA systems,” in Proceedings of IEEE Wireless Communi-
cations and Networking Conference (WCNC ’04), vol. 4, pp.
2004–2009, New Orleans, La, USA, March 2004.
[8] Y. S. Chan, Y. Pei, Q. Qu, and J. W. Modestino, “On cross-layer
adaptivity and optimization for multimedia CDMA mobile
wireless networks,” in Proceedings of the 1st IEEE-EURASIP
International Symposium on Control, Communications, and
Signal Processing (ISCCSP ’04), pp. 579–582, Hammamet,
Tunisia, March 2004.
[9] S. Singh, V. Krishnamurthy, and H. V. Poor, “Integrated
voice/data call admission control for wireless DS-CDMA sys-
tems with fading,” IEEE Transactions on Signal Processing,
vol. 50, no. 6, pp. 1483–1495, 2002.
[10] C.ComaniciuandH.V.Poor,“Jointlyoptimalpowerandad-
mission control for delay sensitive trafficinCDMAnetworks
22 EURASIP Journal on Wireless Communications and Networking
with LMMSE receivers,” IEEE Transactions on Signal Process-
ing, vol. 51, no. 8, pp. 2031–2042, 2003.
[11] S. A. Ghorashi, L. Wang, F. Said, and A. H. Aghvami, “Im-
pact of macrocell-hotspot handover on cross-layer interfer-
ence in multi-layer W-CDMA networks,” in Proceedings of
the 5th European Personal Mobile Communications Conference
(EPMCC ’03), pp. 580–584, Glasgow, UK, April 2003.
[12] W. C. Jakes, Microwave Mobile Communications, John Wiley &
Sons, New York, NY, USA, 1993.
[13] M. K. Karakayali, R. Yates, and L. Razumov, “Throughput
maximization on the downlink of a CDMA system,” in Pro-
ceedings of IEEE Wireless Communications and Networking
Conference (WCNC ’03), vol. 2, pp. 894–901, New Orleans, La,
USA, March 2003.
[14] D. Zhao, X. Shen, and J. W. Mark, “Effect of soft handoff on
packet transmissions in cellular CDMA downlinks,” in Pro-
ceedings of the International Symposium on Parallel Architec-
tures, Algorithms and Networks (I-SPAN ’04), pp. 42–47, Hong
Kong, May 2004.
[15] D. Kitazawa, L. Chen, H. Kayama, and N. Umeda, “Down-
link packet-scheduling considering transmission power and
QoS in CDMA packet cellular systems,” in Proceedings of the
4th IEEE International Workshop on Mobile and Wireless Com-
munications Network (MWCN ’02), pp. 183–187, Stockholm,
Sweden, September 2002.
[16] W H. Sheen, I K. Fu, and K. Y. Lin, “New load-based re-
source allocation algorithms for packet scheduling in CDMA
uplink,” in Proceedings of IEEE Wireless Communications and
Networking Conference (WCNC ’04), vol. 4, pp. 2268–2273,
New Orleans, La, USA, March 2004.
[17] D. M. Novakovic and M. L. Dukic, “Evolution of the power
control techniques for DS-CDMA toward 3G wireless com-
munication systems,” IEEE Communications Surveys and Tu-
torials, vol. 3, no. 4, fourth quarter, pp. 2–15, 2000.
[18] J H. Yoon, M J. Sheen, and S C. Park, “Scheduling methods
with transmit power constraint for CDMA packet services,” in
Proceedings of the 57th IEEE Semiannual Vehicular Technology
Conference (VTC ’03), vol. 2, pp. 1450–1453, Jeju, Korea, April
2003.
[19] X. Wang, R. Ramjee, and H. Viswanathan, “Adaptive and pre-
dictive downlink resource management in next generation
CDMA networks,” in Proceedings of the 23rd Annual Joint Con-
ference of the IEEE Computer and Communications Societies
(INFOCOM ’04), vol. 4, pp. 2754–2765, Hong Kong, March
2004.
[20] J. W. Chang and D. K. Sung, “Adaptive channel reservation
scheme for soft handoff in DS-CDMA cellular systems,” IEEE
Transactions on Vehicular Technology, vol. 50, no. 2, pp. 341–
353, 2001.
[21] J. Y. Sun, L. Zhao, and A. Anpalagan, “Soft handoff priori-
tizing algor ithm for downlink call admission control of next-
generation cellular CDMA networks,” in Proceedings of 16th
IEEE International Symposium on Personal, Indoor and Mo-
bile Radio Communications (PIMRC ’05), Berlin, Germany,
September 2005.
[22] 3GPP TR 25.922 v3.6.0, “Radio resource management strate-
gies,” 2001.
[23] V. K. Garg, IS-95 CDMA and CDMA 2000: Cellular/PCs Sys-
tems Implementation, Prentice Hall, Englewood Cliffs, NJ,
USA, 1999.
[24] A. Viterbi, CDMA Principles of Spread Spectrum Communica-
tions, Addison-Wesley, Reading, Mass, USA, 1995.
[25] 3GPP TS 25.331, “RRC protocol specification,” 2000.
[26] D. Wong and T. J. Lim, “Soft handoffs in CDMA mobile sys-
tems,” IEEE Personal Communications
, vol. 4, no. 6, pp. 6–17,
1997.
[27] 3GPP TS 25.214, “Physical layer procedures (FDD) v3.1.0,”
1999.
[28] A. Viterbi, A. M. Viterbi, K. S. Gilhousen, and E. Zehavi, “Soft
handoff extends CDMA cell coverage and increases reverse
link capacity,” IEEE Journal on Selected Areas in Communica-
tions, vol. 12, no. 8, pp. 1281–1288, 1994.
[29] K. M. Rege, S. Nanda, C. F. Weaver, and W C. Peng, “Analysis
of fade margins for soft and hard handoffs,” in Proceedings of
the 6th IEEE International Symposium on Personal, Indoor and
Mobile Radio Communications (PIMRC ’95), vol. 2, pp. 829–
835, Toronto, Canada, September 1995.
[30] J. Y. Sun, Y. F. Peng, and L. Zhao, “A novel packet scheduling
scheme based on adaptive power/delay for efficient resource
allocation in downlink CDMA systems,” in Proceedings of IEEE
Canadian Conference on Electrical and Computer Engineering
(CCECE ’05), Saskatoon, Canada, May 2005.
[31] V. Jacobson, “Congestion avoidance and control,” in Proceed-
ings of ACM SIGCOMM, pp. 273–288, Stanford, Calif, USA,
August 1988.
[32] P. Karn and C. Partridge, “Improving round-trip time esti-
mates in reliable transport protocols,” ACM Transactions on
Computer Systems, vol. 9, no. 4, pp. 364–373, 1991.
[33] A. Bakre and B. R. Badrinath, “I-TCP: indirect TCP for mobile
hosts,” in Proceedings of IEEE International Conference on Dis-
tributed Computing Systems (ICDCS ’95), pp. 136–146, Van-
couver, BC, Canada, May-June 1995.
[34] S. Floyd, “TCP and explicit congestion notification,” ACM
Computer Communication Review, vol. 24, no. 5, pp. 10–23,
1994.
[35] S. Lin and D. J. Costello, Error Cont rol Coding: Fundamentals
and Applications, Prentice-Hall, Englewood Cliffs, NJ, USA,
1983.
[36] H. Balakrishnan, V. N. Padmanabhan, S. Seshan, and R. H.
Katz, “A comparison of mechanisms for improving TCP per-
formance over wireless links,” IEEE/ACM Transactions on Net-
working, vol. 5, no. 6, pp. 756–769, 1997.
[37]Y.Wu,Z.Niu,andJ.Zheng,“Anetwork-basedsolutionfor
TCP in wireless systems with opportunistic scheduling ,” in
Proceedings of IEEE International Symposium on Personal, In-
door and Mobile Radio Communications (PIMRC ’04), vol. 2,
pp. 1241–1245, Barcelona, Spain, September 2004.
[38] H. Balakrishnan, S. Seshan, and R. H. Katz, “Improving re-
liable transport and handoff performance in cellular w ireless
networks,” ACM Wireless Networks, vol. 1, no. 4, pp. 469–482,
1995.
[39] T. E. Klein, K. K. Leung, and H. Zheng, “Improved TCP per-
formance in wireless IP networks through enhanced oppor-
tunistic scheduling algorithms,” in Proceedings of IEEE Global
Telecommunications Conference (GLOBECOM ’04), vol. 5, pp.
2744–2748, Dallas, Tex, USA, November-December 2004.
[40] W. Stevens, “TCP Slow Start, Congestion Avoidance, Fast Re-
transmission, and Fast Recovery Algorithms,” RFC-2001,Jan-
uary 1997.
[41] “WCDMA (UMTS): FDD technical summary,” http://www.
umtsworld.com/technology/wcdma.htm.
[42] W.E.A 3GPP 2, “1xEV-DV evaluation methodology-adden-
dum (v6),” 2001.
Jin Yuan Sun et al. 23
[43] F. Xu, M H. Ye, P. Zhao, and H M. Zhang , “The research
on the service rate adaptation in mobile network,” in Proceed-
ings of International Conference on Communication Technology
(ICCT ’03), vol. 2, pp. 970–976, Beijing, China, April 2003.
[44] M. Kazmi and N. Wiberg, “Power and rate assignment policies
for best-effort services in WCDMA,” in Proceedings of the 13th
IEEE International Symposium on Personal, Indoor and Mobile
Radio Communications (PIMRC ’02), vol. 4, pp. 1601–1605,
Lisbon, Portugal, September 2002.
[45] Y. Chen and L. G. Cuthbert, “Downlink performance of dif-
ferent soft handover algorithms in 3G multi-service environ-
ments,” in Proceedings of the 4th IEEE International Workshop
on Mobile and Wireless Communications Network (MWCN
’02), pp. 406–410, Stockholm, Sweden, September 2002.
[46] Y. Chen and L. Cuthbert, “Optimum size of soft handover zone
in power-controlled UMTS downlink systems,” IEE Electronics
Letters, vol. 38, no. 2, pp. 89–90, 2002.
[47] “The network simulator - ns-2,” />JinYuanSunreceived the M.A.S. degree
in computer networks from Ryerson Uni-
versity, Canada, in 2005. She received the
B.S. degree in computer information sys-
tems from Beijing Information Technology
Institute, China, in 2003. Since 2005, she has
been working as a Network Test Developer
at RuggedCom Inc., Ontario, Canada. Her
research interests are in wireless commu-
nications, computer networks, mobile net-
works, and sensor networks. She is a student Member of IEEE.
Lian Zhao received the Ph.D. degree in elec-
trical and computer engineering from the
University of Waterloo, Canada, in 2002.
Before she joined Ryerson University in
2003, she worked as a postdoctoral fellow
with the Center for Wireless Communica-
tions, University of Waterloo. Since 2003,
she has been working as an Assistant Pro-
fessor at the Department of Electrical and
Computer Engineering, Ryerson University,
Toronto, Canada. She is a cofounder of the Optic Fiber Sensing
Wireless Network Laboratory in 2004. Her research interests are in
the areas of wireless communications, radio resource management,
power control, as well as design and applications of the energy ef-
ficient wireless sensor networks. She is an IEEE Senior Member
and a Registered Professional Engineer in the province of Ontario,
Canada.
Alagan Anpalagan received the B.A.S.,
M.A.S., and Ph.D. degrees in electrical en-
gineering from the University of Toronto,
Canada in 1995, 1997, and 2001, respec-
tively. Since August 2001, he has been with
the Ryerson University, Toronto, Canada,
where he cofounded WINCORE laboratory
in 2002 and has been leading the WAN
(wireless access and networking) R&D
Group. Currently, he is an Associate Profes-
sor and Program Director for Graduate Studies. His research inter-
ests are, in general, wireless communication, mobile networks, and
system performance analysis; and in particular, QoS-aware radio
resource management, joint study of wireless physical/link-layer
characteristics, cross-layer resource optimization, and wireless sen-
sor networking. He has published more than 40 papers and articles
in international conferences and journals in his research areas. He
currently serves as IEEE Toronto Section Chair, previously served
as Chair, Communications Chapter—IEEE Toronto Section (2004-
2005) and Technical Program Cochair of IEEE Canadian Confer-
ence on Electrical and Computer Engineering (2004). His current
editorial duties include Guest Editor on special issue on Radio Re-
source Management in 3G+ Wireless Systems (2005-2006) and As-
sociate Editor in EURASIP Journal of Wireless Communications
and Networking. He is an IEEE Senior Member and a Registered
Professional Engineer in the province of Ontario, Canada.