Báo cáo hóa học: " Research Article Wireless Sensor Networks: Performance Analysis in Indoor Scenarios" ppt
Bạn đang xem bản rút gọn của tài liệu. Xem và tải ngay bản đầy đủ của tài liệu tại đây (1.77 MB, 14 trang )
Hindawi Publishing Corporation
EURASIP Journal on Wireless Communications and Networking
Volume 2007, Article ID 81864, 14 pages
doi:10.1155/2007/81864
Research Article
Wireless Sensor Networks: Performance Analysis
in Indoor Scenarios
G. Ferrari, P. Medagliani, S. Di Piazza, and M. Martal
`
o
Wireless Ad-Hoc and Sensor Networks (WASN) Laboratory, Depar tment of Information Engineering,
University of Parma, 43100 Parma, Italy
Received 1 July 2006; Revised 8 December 2006; Accepted 2 January 2007
Recommended by Marco Conti
We evaluate the performance of realistic wireless sensor networks in indoor scenarios. Most of the considered networks are formed
by nodes using the Zigbee communication protocol. For comparison, we also analyze networks based on the proprietary standard
Z-Wave. Two main groups of network scenarios are proposed: (i) scenarios with direct transmissions between the remote nodes and
the network coordinator, and (ii) scenarios with routers, which relay the packets between the remote nodes and the coordinator.
The sensor networks of interest are evaluated considering different performance metrics. In particular, we show how the received
signal strength indication (RSSI) behaves in the considered scenarios. Then, the network behavior is characterized in terms of end-
to-end delay and throughput. In order to confirm the experiments, analytical and simulation results are also derived.
Copyright © 2007 G. Ferrari et al. This is an open access article distributed under the Creative Commons Attribution License,
which permits unrestricted use, distribution, and reproduction in any medium, provided the original work is properly cited.
1. INTRODUCTION
Sensor networks have been a fertile research area, during the
last years [1], for military applications, for example, remote
monitoring, surveillance of reserved areas, and so forth. In a
war scenario, in fact, cables may be damaged either by bombs
or by enemies, and therefore, wireless technologies have been
exploited in order to make the networks more robust against
communication problems. First examples of military wire-
less sensor networks were the SOund SUrveillance System
(SOSUS) [2] and the Airborne Warning And Control System
(AWACS) [3]. In the last years, an increasing number of civil-
ian applications of wireless sensor networks have been devel-
oped [4], especially for environmental monitoring [5]. The
increasing interest in wireless sensor networks is driven by
the current technologies, which guarantee the availability of
low power consumption and low-cost devices.
The most attractive standard for wireless sensor networks
is the IEEE 802.15.4 standard [6], w hich provides low-rate
and energy-efficient data transmissions. The corresponding
network architecture can be considered as a good compro-
mise between hierarchical networks (e.g., those based on the
IEEE 802.11 standard [7])andnetworkswithlowerpower
consumption (e.g., those based on the IEEE 802.15.1 stan-
dard [8]). All these systems operate in the 2.4 GHz band:
a comparison and a study of coexistence among them and
other wireless networks are presented in [9]. Other issues
about wireless sensor networks have also been considered.
Besides coexistence, in [10] the authors analyze the problem
of time synchronization in wireless sensor networks and pro-
pose an optimized flooding protocol for master-slave scenar-
ios. In particular, different functionalities for real-time sup-
port have been analyzed and proposed for the Zigbee stack.
Moreover, in [11] the authors show an experimental evalua-
tion of a wireless sensor network using the Zigbee standard.
In [12], instead, the author proposes a complete analysis of
the main design parameters of wireless sensor networks, such
as the received signal strength indication (RSSI), throughput,
and packet deliver y ratio. Finally, in [13] the authors analyze
the path capacity of an IEEE 802.15.4 network, through Sen-
Probe, a new path capacity estimation tool specifically de-
signed for carrier-sense multiple-access with collision avoid-
ance (CSMA/CA)-based wireless ad hoc networks.
In this paper, we analyze the performance of realistic
wireless sensor networks in various indoor scenarios. Similar
to [11, 12], we use common performance indicators (such
as RSSI, throughput, and delay) in order to characterize the
network behavior. Unlike [11, 12], we use the wireless sensor
networking technologies developed by microchip [14](open
standard,Zigbee)andZensys[15](proprietary standard,
2 EURASIP Journal on Wireless Communications and Networking
Z-Wave [16]), respectively. We try to highlight similar ities
and differences between the considered technologies, refer-
ring also to other possible choices, such as those described
in [11, 12]. Moreover, we show how different performance
metrics, such as packet error rate (PER) and delay, strongly
depend on the distribution of the sensors in the indoor en-
vironment. In particular, our results show that the network
connectivity has a bimodal behavior [17].
In order to validate the experimental results, the perfor-
mance of Zigbee networks is evaluated using Opnet network
simulator [18], in a scenario where remote nodes commu-
nicate directly to the network coordinator. Finally, a sim-
ple asymptotic (for a large number of sensors) performance
analysis is provided, confirming further the experimental re-
sults.
The rest of this paper is structured as follows. In
Section 2, we describe the functionalities provided by Zig-
bee (Section 2.1)andZ-Wave(Section 2.2) networking tech-
nologies. In Section 3, the wireless sensor network scenarios
of interest are described. In Section 4, the obtained results,
in terms of the chosen performance indicators (i.e., RSSI,
throughput, and delay) are presented. In Section 5,simula-
tion results are shown and a simple analy tical framework,
valid in an asymptotic (for large numbers of sensors) regime,
is derived. Finally, Section 6 concludes the paper.
2. PRELIMINARIES ON SENSOR NETWORKS
2.1. Zigbee networks
The increasing need for applications where nodes can send
data without the constraints imposed by the presence of
power and t ransmission cables have led to the creation of
low-rate wireless personal networks (LR-WPANs). This is the
case, for example, of remote monitoring of natural events,
such as landslides, earthquakes, and so forth [5, 19]. One
of the newest standards for wireless sensor networks, with
significant power savings, has been called Zigbee [20]. More
precisely, the Zigbee alliance provides instructions only for
the upper layers (i.e., from the third to the seventh layer)
of the ISO/OSI stack [21]. At the first layers levels of the
ISO/OSI stack (physical, PHY, and medium access control,
MAC), the Zigbee technology is based on the IEEE 802.15.4
standard and guarantees (theoretically) a transmission data
rate equal to 250 kpbs in a wireless communication link.
Three transmission bands are allowed by the Zigbee stan-
dard: (i) 2.4 GHz, (ii) 868 MHz, and (iii) 916 MHz. While
the first transmission band is available worldwide, the second
and third are available only in Europe and USA, respectively.
Three different kinds of nodes can be used in a wireless
network, according to the Zigbee specifications: (i) a router,
(ii) a coordinator, (iii) and an end device. The coordinator
can create the network, exchange the parameters used by the
other nodes to communicate (e.g., network ID, beginning of
a transmitted frame, etc.), relay packets received from remote
nodes towards the correct destination, and collect data from
the sensors. Only a single coordinator can be used in a net-
work. A router, instead, relays the received packets and the
control messages (in order to increase the network diameter),
manages the routing tables and, if required, can also collect
data from a sensor. The main d ifference between a coordi-
nator and a router is that the former can create the network,
while the latter cannot. Both these types of nodes are referred
to as full function devices (FFDs): they can develop all the
functions required by the Zigbee standard in order to set up
and manage the communications. On the other hand, end
devices, also referred to as reduced function dev ices (RFDs),
can act only as remote peripherals, which collect values from
sensors and send them to the coordinator or other remote
nodes. However, RFDs are not involved in network man-
agement, and therefore, cannot send or relay control mes-
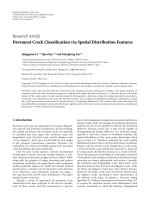
sages. According to the Zigbee standard, three different kinds
of network topologies are possible, as shown in Figure 1:(i)
star, (ii) cluster-tree, and (iii) mesh.
(i) In a
star network, there are a coordinator and one
or many RFDs (end nodes) or FFDs (routers) which
send messages directly to the coordinator (up to 65536
RFDs or FFDs).
(ii) In a cluster-tree topology, instead, there are a coordi-
nator which acts as a root and either RFDs or routers
connected to it, in order to increase the network di-
mension. The RFDs can only be the leaves of the tree,
whereas the routers can also act as branches. In a
cluster-tree topology, a beacon structure can be em-
ployed in order to obtain an improved battery conser-
vation.
(iii) In a mesh network, any source node can talk directly
to any destination. The routers and the coordinator, in
fact, are connected to each other, within their trans-
mission ranges, in order to ease packet routing. The
radio receivers at the coordinator and routers must be
“on” all the time.
In a wireless mesh sensor network, a routing technique must
be used. The Zigbee standard employs a simplified version
of the ad hoc on-demand distance vector (AODV) routing
protocol [22].TheAODVprotocolisareactiveprotocolin
whichtherouteisformeduponarouterequestgenerated
by a (source) node. Through an exchange of messages be-
tween source and destination, the route can be reserved by
intermediate nodes just updating their routing tables, so that
communications can be guaranteed.
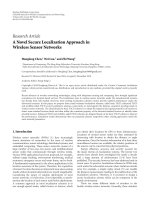
Since the main goal of a Zigbee network is data transmis-
sion under the constraint of maximum power saving, a bea-
con frame structure can be employed, as shown in Figure 2
[23]. The b eacon frame is divided into two main periods, re-
ferred to as active and inactive, respectively. While in the lat-
ter period all nodes go to the sleeping state to preserve their
battery energy,
1
in the former period all nodes can transmit
their data packets. In order to prevent collisions, two differ-
ent access techniques can be employed. In the contention ac-
cess period (CAP), every node can transmit according to the
1
In the sleeping state, nodes can reach energy savings which are three or-
ders of magnitude higher than those in the active phase [24].
G. Ferrari et al. 3
PAN
coordinator
Link
Coordinator
Router
RFD
(a)
Link
Coordinator
Router
RFD
(b)
Link
Coordinator
Router
RFD
(c)
Figure 1: Possible typologies for a Zigbee network: (a) star,(b)cluster-tree, and (c) mesh.
SD (superframe duration)
BI (beacon interval)
Beacon
CAP CFP
Inactive period
Beacon
GTS GTS
0 1 2 3 4 5 6 7 8 9 10 11 12 13 14 15
Figure 2: Frame structure of the beacon signal in a Zigbee network.
CSMA/CA MAC protocol [25], with the use of a proper back-
off algorithm [21], as required by the IEEE 802.15.4 stan-
dard. In the contention-free period (CFP), instead, only nodes
with a reserved time slot can try to transmit data packets,
so that collisions can be avoided. In order to allow safe data
transmission, a guaranteed time slot (GTS) may be reser ved
to nodes which require it [26, 27]. In this portion of time,
only these nodes can transmit, finding , therefore, the channel
free. The dimensions of the beacon frame and the durations
of the active phase (also called superframe duration, SD) and
the GTS are defined by two parameters which are exchanged
within the beacon signal. This signal is per iodically sent by
the coordinator in order to synchronize a ll remote nodes in
the network and signal the beginning of the beacon frame, as
shown in Figure 2.
Another feature of the Zigbee standard is the end device
binding, similar to an association between two logical units
residing in different nodes. For example, this is the case for
the connections between lights and switches in a room. Var-
ious types of links are possible: (i) one-to-one, (ii) one-to-
many, and (iii) many-to-many. Through end device bind-
ing, communications can be simplified and accelerated. In
order to transmit data, the two binded nodes communicate
through a 2-byte address given by the coordinator, instead
of using the 8-byte address of the MAC level. This leads to a
reduction of (i) the overhead in packet transmission, (ii) the
processing time and, consequently, (iii) the energy consump-
tion. The end device binding scheme is shown in Figure 3.
2.2. Z-Wave networks
Z-Wave is a proprietary wireless communication protocol
designed for home control by Zensys [15], with special atten-
tion to commercial and residential applications such as dis-
tance measurements, light control, anti-intrusion detection,
and so forth. The Z-Wave technology allows to create a high-
efficiency network at a very low cost, especially if compared
with other technologies currently available. In fact, a single
Z-Wave chip, the basic entity which allows data exchange,
costs less than 4 USD [16].
The transmission bands used by Z-Wave devices are the
868 MHz band in Europe and the 908 MHz band in USA. The
Z-Wave communication protocol is a low-bandwidth half-
duplex protocol designed to guarantee reliable wireless com-
munications in a low-cost control network. The main pur-
pose of this protocol is to send short control messages in a
reliable manner from a control unit to one or more nodes in
the network. In fact, the protocol is not designed to transfer
large amounts of data or streaming/time-critical data.
The Z-Wave communication protocol consists of four
layers: (1) the MAC layer (based on the CSMA/CA proto-
col), which includes the PHY layer of the ISO/OSI stack
4 EURASIP Journal on Wireless Communications and Networking
Zigbee
device
object
Coordinator
Switch
control
EP 1
EP 2
EP 1
EP 2
Zigbee
device
object
End device
Switch
Figure 3: End device binding scheme of a Zigbee network.
and controls the radio frequency (RF) media; (2) the trans-
fer layer, which controls the transmission and reception of
frames; (3) the routing layer, which controls the routing of
frames in the network; and (4) the application layer,which
controls the payload in the transmitted and received frames
[28]. The Z-Wave protocol includes t wo basic types of de-
vices: controllers and slaves. Controlling devices are nodes
that initiate control commands and send them out to other
nodes, whereas slave nodes reply to these instructions and
execute the required operations. Slave nodes can also for-
ward the commands to other nodes, allowing the controller
to communicate with nodes out of direct reach. The proto-
col employs a unique identifier number, referred to as home
ID, to separate a network from another network near by.
A unique 32-bit identifier is preprogrammed on each con-
troller node [29].
The Z-Wave communication protocol allows a maximum
number of hops in the network. Because of the protocol de-
sign, it has to handle communications in a home environ-
ment, and consequently, it does not need to communicate
data over long distances. The communication range in a free
line-of-sight scenario is about 70 m, but it can fall down to
15
÷20 m in an indoor environment. However, Z-Wave nodes
belonging to the series 100 and series 200 allow a maximum
of four hops, so that the overall communication distance
which can be covered in an indoor scenario is about 100 m.
The controller has the function of a master in the net-
work. A Z-Wave network has always a mesh topology, and the
maximum number of nodes which can be included is 232.
The Z-Wave protocol is a low-rate (9.6 kbps) communication
protocol. In the base module ZW0201 (Series 200), nodes
that allow RF communications at 40 kbps have been intro-
duced to reduce the latency period. The adopted solution
guarantees compatibility, in the same network and without
adaptors, between nodes that support 9.6 kbps communica-
tion and nodes that support 40 kbps communication. More-
over, no variation at the application layer is required.
A typical application of the Z-Wave protocol is the cre-
ation of a home control network, which consists of a com-
plex set of nodes: battery-powered, DC-powered, fixed, and
mobile. All these types of nodes need to be handled in dif-
ferent manners and are supported by the Z-Wave protocol.
In particular, special attention is devoted to reduce the en-
ergy consumption and there are four different statuses for a
battery-powered node: sleep, normal (no RF activity), trans-
mit,andreceive, with energy consumptions equal to 2.5 μA,
5 mA, 39 mA (at maximum transmission power), and 21 mA,
respectively.
3. EXPERIMENTAL SETUP
3.1. Zigbee networks
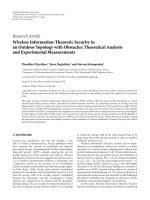
InordertocreateanexperimentalsetupforaZigbeenet-
work, we consider PICDEM Z nodes belonging to the Mi-
crochip family. The PICDEM Z demonstration board is
shown in Figure 4. This board has an embedded tempera-
ture sensor (referred to as TC77) and a radio frequency in-
terface (referred to as Chipcon CC2420 chip). All nodes are
completely reprogrammable through a programmer called
MPLAB ICD 2. The Zigbee protocol stack is implemented
through a code developed by Microchip, compiled through
the MPLAB software packet, and downloaded on the node
through the ICD 2 programmer. In fact, Zigbee is an open
protocol and, in order to create a wireless sensor network
based on the Zigbee standard, one has only to implement the
desired version of the standard, adhering to the imposed con-
straints. The transmission range allowed by the PICDEM Z
nodes is around 100 m in outdoor scenarios and 20 m in in-
door scenarios. Each experimental trial considered for this
work is repeated 500 times, in order to eliminate possible
statistical fluctuations due to the instability inherent to the
internal oscillator of the RF interface and possible measure-
ment errors due to reflection and multipath phenomena. All
the experiments are conducted in an indoor environment, so
that there are reflections due to walls and furniture. The pos-
sible network topologies employed in our tests are shown in
Figure 5. For every test, the number of nodes employed in
the network and their roles are indicated. In particular, cases
without routers (Figures 5(a) and 5(d)) and with interme-
diate routers (Figures 5(b) and 5(c)) are considered. All the
experiments are performed using the 2.4 GHz band, since the
actual version of the stack supports only this frequency band.
The distances between the nodes in the considered experi-
ments are a few meters, so that the attenuation phenomena
can be neglected in the delay measurements. In addition, all
the experiments have been performed in a beacon-disabled
mode, because the current version of the Zigbee stack pro-
vided by Microchip does not support the use of beacon in
operative conditions.
We point out that we were not able to obtain any exper-
imental result considering the network topology in Figure
5(c). In fact, in all the considered network topologies of this
type, we have observed processing problems: the first router
manages almost always to connect directly to the coordinator
before the second router could rely the received packets. This
will be described in more detail at the and of Section 4.1.3,
with particular reference to the results presented in Figure 11.
G. Ferrari et al. 5
Figure 4: PICDEM Z demonstration board.
Link
Coordinator
Router
RFD
(a)
(b)
(c)
(d)
Figure 5: Network topologies employed for the measurements in
Zigbee networks. Four p ossible scenarios are considered: (a) direct
transmission between RFD and coordinator, transmissions through
(b) one router or (c) two routers, and (d) transmission from two
RFDs to the coordinator.
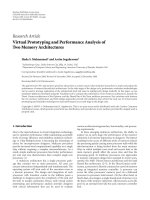
3.2. Z-Wave networks
The nodes employed in our Z-Wave experimental setup be-
long to the ZW0201 family: an illustrative node is shown in
Figure 6. As previously mentioned, the use of the Z-Wave
technology leads to the creation of mesh networks. The net-
work scenario used in our experiments is shown in Figure 7:
one controller (tester) and three slaves, referred to as devices
under test (DUTs), are placed inside our department rooms.
As shown in Figure 7, the tester node is placed in a room and
DUTs are placed in different rooms. The direct distances be-
tween tester and DUTs are about 10 m and 21
÷ 22 m, respec-
tively, for DUT 1 and for DUTs 2 and 3. Two network topolo-
gies are implemented in our tests, as shown in Figure 8 :(a)
the three slaves talk directly to the coordinator, or (b) two
slaves talk to the coordinator through a router. The measure-
ments carried out with a Z-Wave network are obtained by
averaging over 10 000 experimental trials. The measurements
are carried out in terms of network connectivity,whichwillbe
characterized as a proper function of the PER.
Figure 6: Z-Wave node with interface module.
3
2
1
Tester
Figure 7: Experimental set up for Z-Wave network. The position of
sensors (both tester and slaves) inside our department are pictured.
4. EXPERIMENTAL MEASUREMENTS
4.1. Zigbee networks
4.1.1. RSSI measurements
In the first set of experiments, the RSSI value detected by a
node is stored. In particular, the impact of the distance be-
tween the two employed nodes is evaluated. The RSSI is a
very important indicator for wireless networks, since it can
be used to characterize the channel status. According to the
CSMA/CA protocol, the node measures the received signal
intensity, and if this intensity is higher than a fixed threshold,
it waits for the end of the ongoing transmissions. In addition,
the RSSI value has a key role also during the network cre-
ation phase. In fact, when the first node sets up the network,
it must sense the channel to be used, in order to avoid the
busy ones.
2
The other nodes, instead, must sense the channel
to determine which channel the first node is transmitting in,
so that a correct association process can start.
In order to obtain experimental measurements, the
topology in Figure 5(a) has been considered, using two nodes
directly connected: a coordinator and an RFD. The RFD, af-
ter the joining phase with the coordinator, starts transmit-
ting. At the same time, the coordinator receives data packets
and sends back an acknowledgment (ACK). At the network
layer of the ISO/OSI stack (namely, layer 3) there is a param-
eter, denoted as RSSI, originating from the power detection
2
When a coordinator sets up a new network, it starts sensing all the chan-
nels in order to find the first channel free and avoid other already created
wireless networks.
6 EURASIP Journal on Wireless Communications and Networking
Controller
Slave
(a)
Controller
Slave
(b)
Figure 8: Network topologies for experimental measurements with
a Z-Wave network. Two cases are considered: (a) direct transmission
between slaves and controller, and (b) where one slave acts as an
intermediate router.
20 40 60 80
Distance (cm)
−90
−80
−70
−60
−50
−40
−30
−20
RSSI (dBm)
P
t
= 0 dBm (measurements)
P
t
=−10 dBm (measurements)
P
t
=−25 dBm (measurements)
P
t
= 0 dBm (interpolation)
P
t
=−10 dBm (interpolation)
P
t
=−25 dBm (interpolation)
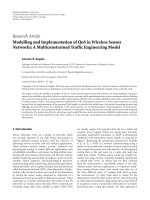
Figure 9: RSSI as a function of the distance between nodes. Three
different values of the transmitted power are considered: (i) P
t
=
0 dBm, (ii) P
t
=−10 dBm and (iii) P
t
=−25 dBm.
performed by the CC2420 at the physical layer, used to per-
form the actions discussed above. The physical layer, in fact,
is responsible for all the tasks related to power management
and medium access. The r adio interface embedded on the
PICDEM Z board (CC2420) mounts a directional antenna,
and several antenna configurations can be considered. In this
paper, we consider a 180-degree orientation between the two
interfaces.
In Figure 9, the measured RSSI is shown as a func tion
of the distance between the two nodes. Solid lines represent
the effective values measured by the coordinator, whereas
the dashed lines are obtained by linearly interpolating the
collected experimental values. Three different values for the
transmit power P
t
are considered: (i) 0 dBm, (ii) −10 dBm,
and (iii)
−25 dBm. The difference between experimental val-
ues and dashed lines can be associated with the presence of
reflection phenomena (due to walls and furniture) and ob-
struction phenomena (due to people crossing the rooms). In
logarithmic scale, the RSSI decreases linearly, as expected, as
a function of the distance. Obviously, increasing the transmit
power leads to a better performance, since the environmental
conditions are the same for all the measurements.
4.1.2. Throughput measurements with a point-to-point link
The goal of this experiment is to measure the throughput
as a function of the number of nodes in the network and
the packet length. We consider the topology shown in Figure
5(a), that is, a network where an RFD is transmitting directly
to a coordinator. Various measurements are carried out,
in correspondence to different values of the packet length.
According to the Zigbee standard, the maximum possible
packet length is 128 bytes at the MAC layer of the ISO/OSI
stack. In order to avoid problems with the communication
protocol, we use a lower value (e.g., 90 bytes). In fact, the
Zigbee standard does not provide any fragmentation func-
tion for the packets. The throughput in this case is show n,
as a function of the packet length, in Figure 10 (solid line).
The throughput is calculated, over 50 received packets, as the
ratio between number of bits received correctly a nd the total
transmission time. This experimental procedure is repeated
ten times.
3
The results in Figure 10 show that the throughput
increases less than linearly as a function of the packet length.
The goal of the standard is to guarantee a transmission data
rate of 250 kpbs, but our tests show that a prac tical network
performance is still far from this performance level. In fact,
only a throughput of 32 kpbs can be achieved in the presence
of the maximum offered trafficload.
4.1.3. Throughput measurements in the presence of routers
We consider the topologies where the packets transmitted
from the RFD to the coordinator are relayed by one router
(see Figure 5(b)) or two routers (see Figure 5(c)). The
throughput measurements in these scenarios are shown, as
solid and dashed lines, respectively, in Figure 10. The pres-
ence of a router influences heavily the data rate. In fact, ac-
cording to the CSMA/CA protocol, a node can send data only
if it finds the channel free. In the presence of a single RFD (as
considered in Section 4.1.2), since the coordinator does not
send data except for the ACK message to the RFD, the chan-
nel is always free for a transmission. In the configuration in
Figure 5(b), instead, when the router retransmits its pack-
ets to the coordinator the medium is busy, so that the RFD
must wait in order to transmit new data. In the presence of
two hops, the throughput with the CSMA/CA protocol is re-
duced by a factor of two (because one of the nodes of a link is,
3
Our experiments show that a Zigbee wireless network is very sensitive
to channel impairments (reflections, etc.). In fact, communication errors
appear very often, especially at the beginning of the transmission.
G. Ferrari et al. 7
0 20 40 60 80 100
Packet length (bytes)
0
1
2
3
4
×10
4
Throughput (bit/s)
1 coordinator, 1 router, 1 RFD
1 coordinator, 1 RFD
Figure 10: Throughput measurements results for the Zigbee net-
work configurations shown in Figure 5(a) (circles) and Figure 5(b)
(squares), respectively.
alternatively, silenced). In genera l terms, the throughput de-
creases as O(1/n
hops
), where n
hops
is the number of hops tra-
versed by a packet to reach its destination. As a matter of fact,
the practical throughput is lower than that expected from the
theoretical analysis, because of control messages exchanged
by the nodes in order to notify the network of their presence.
In order to evaluate the impact of the environmental
interference, we repeat the measurements carried out for
Figure 10, the only difference being the presence of a much
larger number of people moving across the sensor network
laid in our depart ment. The obtained results are shown in
Figure 11. From these results, it is immediate to realize how
deleterious the presence of walking people is. This is due to
the fac t that people introduce more reflection and fading ef-
fects, which are detrimental for the communication quality.
It is therefore very important to reduce these effects, in order
for wireless sensors to be used for h ome control applications.
In addition, the router itself is not very stable. If some control
messages are not correctly delivered, the router stops work-
ing, instead of recovering from the occurred errors and going
on wi th its tasks. This is probably due to the “young age” of
the standard, which was first proposed only in 2004.
The second topology of interest for throughput evalua-
tion contains two routers, which relay the packets towards
the destination (topology (c) in Figure 5). In this case, ac-
cording to the theoretical analysis, the network throughput
should be smaller by a factor of three with respect to that
in the ideal case (topology (a) in Figure 5). However, the
obtained experimental results are very similar to those rel-
ative to a topology with only one router, that is, the results
shown in Figure 10. The Zigbee protocol, as explained in
0 20406080100
Packet length (bytes)
0
1
2
3
4
×10
4
Throughput (bit/s)
1 coordinator, 1 router, 1 RFD
1 coordinator, 2 routers, 2 RFDs
Figure 11: Throughput measurements results for the Zigbee net-
work configurations shown in Figure 5(b) (circles) and Figure 5(c)
(diamonds), respectively. The presence of interference due to people
is taken into account.
Section 2.1, implements the AODV routing protocol. This
means that the nodes, which are not placed far from each
other, tend to route the packets through a path with the low-
est possible number of hops. In other words, the first router
communicates directly to the coordinator, rather than mak-
ing an intermediate hop with the second router.
4.1.4. Throughput in the presence of two RFDs
The last experimental test consists in measuring the net-
work throughput in the presence of two RFDs which trans-
mit simultaneously to the coordinator. This is the network
topology shown in Figure 5(d). Unlike the scenario with one
router and one RFD (i.e., the topology in Figure 5(b)), in this
case there are two remote nodes transmitting directly to the
coordinator which, in turn, has to send back the ACK to the
correct node. Moreover, in a network with a topology as in
Figure 5(b), the coordinator has to send back an ACK only if
the message from the router is directed to the coordinator it-
self. In the scenario shown in Figure 5(b), the coordinator has
to send back an ACK whenever it receives a message. There-
fore, the number of collisions increases and a throughput re-
duction is expected. Since the nodes send data at the high-
est possible rate, when a node takes control of the channel, it
tends to keep it for a long time. In fact, as soon as a node stops
its transmission, it generates a new packet and tries immedi-
ately to send it: it is very likely that the channel will still be
free, because it has just been released by the node itself. An-
alyzing the data collected from the measurements, the num-
ber of tra nsmitted packets which reach the destination is un-
balanced in favor of one of the two RFDs, confirming our
8 EURASIP Journal on Wireless Communications and Networking
0 20 40 60 80 100
Packet length (bytes)
0
1
2
3
4
×10
4
Throughput (bit/s)
1 coordinator, 2 RFDs
Figure 12: Throughput measurements for the Zigbee network con-
figuration shown in Figure 5(b), that is, w ith two RFDs talking di-
rectly to the coordinator.
intuition. In Figure 12, the throughput results are obtained
by averaging over the throughputs of each RFD, considering
500 experimental trials. In this scenario as well, the exper-
imental measurements are influenced by occasional events,
like people crossing a link during a transmission.
These results have been obtained in a scenario where two
RFDs are in the same carrier-sensing range. Otherwise, in
fact, the hidden terminal problem (no RTS/CTS mechanism
is provided by the Zigbee standard) occurs. In order to make
a fair comparison, the packet generation rate must be suffi-
ciently low for the number of collisions to be negligible. In
fact, for high packet generation rate a node, which sends a
packet, is likely to reutilize the channel at its subsequent at-
tempt. The other node, in fact, due to the delay introduced
by the backoff algorithm,maynotbeabletotransmitatall
or, at most, transmits only a few packets. If the packet gener-
ation rate is reduced, instead, the probability that one trans-
mitting node finds the channel available increases. Therefore,
data transmission can be considered balanced.
4.1.5. Delay performance in a Zigbee network
Another important indicator of network performance is the
average delay between two consecutive packets correctly re-
ceived by the coordinator. Consider now a scenario like that
in Figure 5(a), that is, with direct transmission between an
RFD and a coordinator. From a theoretical viewpoint, the
transmission delay D
direct
can be written as
D
direct
=
L
R
b
+ T
prop
+ T
proc
,(1)
where T
prop
is the propagation delay, T
proc
is the processing
time at the node, L is the packet length, and R
b
is the trans-
0 20 40 60 80 100
Packet length (bytes)
1
2
3
4
×10
−2
D (s)
1 coordinator, 1 RFD
1 coordinator, 1 router, 1 RFD
Figure 13: Delay measurement with direct transmission (scenario
in Figure 5(a)) and 1-hop transmission (scenario in Figure 5(b)) in
a Zigbee network.
mission data rate. The time T
proc
includes both the process-
ing delay introduced by the node and the delay introduced
by the backoff algorithm. Since the average distance between
nodes is around 3 m, the propagation delay is T
prop
10
nanoseconds, and therefore, can be neglected. Finally, one
obtains
D
direct
L
R
b
+ T
proc
. (2)
In Figure 13, the experimental results, in the cases with
direct transmission from a remote sensor to the coordina-
tor (solid line) and indirect transmission through a router
(dashed line), are shown. Since in the case with a router there
is a retransmission, the average delay almost doubles. Ex-
tending expression (2), the delay can be approximated as
D
router
2
L
R
b
+ T
proc
(3)
since retransmission of the packet to the coordinator (includ-
ing a double processing time) has to be considered. Note that
expression (3)forD
router
should also take into account the
delay introduced by retransmission of packets after a trans-
mission error, but we neg lect this term because the nodes
are placed close to each other—the distance between nodes
is around 3 m. Therefore, as will be more clearly shown in
Figure 16, at this distance the packet error rate is almost 0,
then there is no increase of the total delay due to lost pack-
ets. A low interference scenario has been considered. This as-
sumption is also motivated from the results in [ 30].
In Figure 14, the delay is shown as a function of the
packet length, in terms of experimental, simulation, and the-
oretical results. The square symbols in Figure 14 are asso-
ciated with the point-to-point experimental measurements
G. Ferrari et al. 9
0 20 40 60 80 100
Packet length (bytes)
1
1.5
2
2.5
3
×10
−2
D (s)
Opnet simulation
Theoretical analysis (with R
b
= 250 kbps)
Theoretical analysis (with experimental R
b
= 10.9kbps)
Experimental
Figure 14: Delay analysis in a Zigbee network. Experimental, theo-
retical, and simulation results are shown.
described in Section 4.1.2. Then, we apply a first-order
polynomial interpolation of these values, in order to de-
rive the theoretical curve of delay (2) (curve with circular
symbols). In addition, the curves associated with the maxi-
mum transmission rate provided by the standard (line with
crosses) and with the estimated processing time of the node
(line with circles) are also shown. The last curve (dashed line)
in Figure 14 is obtained through the use of Opnet network
simulator [18]—more details on the Opnet simulator will be
given in Section 5. In order to make the comparison between
simulations and experiments meaningful, the average delay
calculated in the experiments is used as the packet interar-
rival time for the simulations. Therefore, with small packet
lengths, the obtained delay is quite large (in fact, the real
packet interarrival time is rather short). On the other hand,
with larger packet sizes, the simulated delay is lower than the
experimental delay. Note that the Opnet simulation c urve
shown in Figure 14 is obtained by adding to the exact sim-
ulation output an offset equal to the experimental processing
time. The measured offset is equal to 13.7 milliseconds. This
value can be interpreted as the processing time of the node,
which includes data processing and input/output operations
on serial registers.
4.1.6. Packet error rate
The PER corresponds to the r a tio between the number of er-
roneous received packets and the total number of transmit-
ted packets. However, the Zigbee communication protocol
is equipped with an error control mechanism, to reduce the
loss of data. This mechanism is based on the use of automatic
repeat request (ARQ) techniques. More precisely, the Zigbee
protocol requires up to three packet retransmissions in the
absence of an ACK from the destination node. This technique
guarantees a correct data delivery.
The first experiment is about the measurement of the
PER, as a function of the distance, in a short communica-
tion range. Considering distances between 10 cm and 1 m, in
order to make a comparison with the experiments described
in Section 4.1.1, it turns out that the performance of the sys-
tem remains practically unchanged. The experimental setup
is basically the same, except for the precision of the mea-
surements, obtained by averaging over 5000 transmissions.
4
The average PER is around 0.165. This high PER value is
mainly due to synchronization problems of the nodes and
internal exchange of messages at the control level of nodes.
This confirms that the first version of the stack developed by
Microchip suffers of “youth” problems.
The same experiment is repeated placing the two nodes
in different rooms of the department, as shown in Figure 15.
The results of our PER measurements at the coordinator,
shown in the same picture, highlight the impact of attenu-
ation (due to the walls) and reflections (due to the furniture)
on the network performance. RFD 2 is a few meters closer
to the coordinator than RFD 3, but it has worse PER perfor-
mance than the other node, because its signal has to cross a
larger number of walls to reach the coordinator. Besides, the
presence of a metallic cabinet on the transmission path of
RFD2degradestheoverallperformance.EvenifRFD2and
RFD 3 are a few meters behind RFD 1 (with respect to the
coordinator), the performance falls down quickly, because of
the limitations introduced by the indoor environment.
In order to overcome the aforementioned problems of
stability, a new version of the stack has been developed by
Microchip. The current experimental setup consists of three
RFDs placed in the same room, sending messages to the co-
ordinator at the highest possible rate, avoiding the sleep pe-
riod introduced by the beacon frame. The coordinator replies
to these messages with an ACK, in order to confirm correct
packet delivery. In these conditions, the results of our exper-
iment show that it is possible to perform data transmission
with a PER equal to 10
−2
÷ 10
−3
.ThisfeaturemakesaZig-
bee network suitable for applications with quality of service
(QoS) not too stringent requirements, like transmission of
uncoded voice signals.
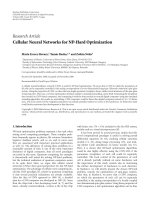
The results of the last performance analysis of a Zig-
bee network, in terms of PER, is shown in Figure 16,where
the “connectivity indicator,” defined as 1-PER, is shown as a
function of the distance between the two transmitting nodes.
The network topology adopted in this experiment corre-
sponds to that in Figure 5(a). According to the Zigbee pro-
tocol, two communication str ategies, in the presence of mes-
sage delivery errors, are considered: (i) 4 retransmissions
(solid line) and (ii) no retransmission (dashed line with dia-
monds).
4
In order to obtain accurate measurements, at low PERs, the number of
trials should be larger, but the chosen value is a compromise between pre-
cision of analysis and total duration of the test.
10 EURASIP Journal on Wireless Communications and Networking
RFD 3
0.3624
RFD 2
0.4740
0.1686
RFD 1
Coordinator
Figure 15: Scenario for packet er ror rate measurements.
According to theoretical results, an ad hoc wireless net-
work has a bimodal behavior [17, 31, 32]. At short dis-
tances, there is full connectivity and communication can be
sustained. When the distance between the two nodes in-
creases beyond a threshold value, instead, connectivity falls
down rapidly and the two nodes can no longer communi-
cate. Looking at Figure 16, it can be observed that there is no
difference between the performance in the presence or ab-
sence of retransmissions. This means that if there is connec-
tivity between nodes in a Zigbee network, then packet deliv-
ery to destination is guaranteed regardless of the number of
retransmissions. Finally, one should observe that the critical
maximum distance for connectivity in indoor environment
is around 20 m. This value is radically different from that ex-
pected from the Zigbee standard in an open-space scenario,
corresponding to approximately 100 m. The connectivity in-
dicator (1-PER) in Figure 16 has a sharp bimodal behavior.
We believe that this is due to strong multipath phenomena
in our indoor scenario. In fact, our measurement environ-
ment differs substantially from typical (outdoor) simulation
assumptions [33].
4.2. Z-Wave networks
4.2.1. Packet error rate
The communication system can be characterized in terms
of connectivity or, equivalently, PER. The connectivity has
been calculated for three different scenarios, depending on
the presence of routing in the communication and the packet
retransmission mechanism to recover from tr ansmission er-
rors. The transmission power has been set to 0 dBm for all
the cases. The three considered scenarios are
(1) the scenario in Figure 8(a), with no routing and no re-
transmission;
(2) the scenario in Figure 8(a), with retransmission and
no routing;
(3) the scenario in Figure 8(b), with retransmission and
routing.
The retransmission mechanism works as follows: if a packet
is lost or is not acknowledged by the slave, the controller re-
transmits the same packet twice, waiting an interval, between
consecutive retransmissions, given by a backoff counter (as
described in the CSMA/CA protocol [25]). If packet trans-
mission fails after the retransmissions, the packet is de-
0 5 10 15 20 25 30
Distance (m)
0
0.2
0.4
0.6
0.8
1
1.2
1-PER
Z-Wave: 3 reTx
Z-Wave: no reTx
Zigbee: 4 reTx
Zigbee: no reTx
Figure 16: Connectivity, as a function of the distance, in an in-
door environment for a Zigbee and Z-Wave networks. Two cases are
considered for the Zigbee standard: (i) absence of retransmissions
(dashed line with triangles) and (ii) four retransmissions (solid line
with squares). Two scenarios are considered also for the Z-Wave
standard: (i) absence of retransmissions (dashed line with circles)
and (ii) three retransmissions (solid line with diamonds).
clared lost. The experimental setup is shown in Figure 7.The
tester node (controller) sends test packets to the other nodes
(slaves), which reply with an ACK packet. If the ACK ar-
rives correctly to the controller, the transmission is consid-
ered successful and the tester sends the next packet, increas-
ing the counter associated with the transmitted packet. Oth-
erwise, the tester waits a backoff time and retransmits the
packet. Two possible network topologies, shown in Figure 8,
are considered: in the first one there is a direct link from the
tester to the DUTs, whereas in the second one node 1 acts as
a router to connect nodes 2 and 3.
The results of these tests are shown in Table 1. The dif-
ference between node 2 and node 3 resides only on the type
of the antennas, but the results obtained are not very d iffer-
ent in the two considered cases (the maximum deviation is
around 5
÷ 10%). As for Zigbee networks, in this case as well
it has been observed that the interference generated by peo-
ple passing in front of a node or placing themselves in front
of the tester might break the connection.
In order to better describe the connectivity behavior of a
Z-Wave network, the connectivity indicator, that is, 1-PER,
is shown, as a function of the distance, in Figure 16.Inpar-
ticular, the presence or absence of retransmission mecha-
nisms is considered. These curves are obtained by averag-
ing over 1000 repetitions of the experiment. In these condi-
tions, attenuation due to walls and doors, reflections due to
metallic furniture, and link breakage due to people passing
through or stopping in correspondence to the direct radio
G. Ferrari et al. 11
Table 1: PER results in a Z-Wave network.
Scenario Distance (m) PER
1
10 1.1 × 10
−1
21 3.65 × 10
−1
23 7.28 × 10
−1
2
10 9.8 × 10
−3
21 1.33 × 10
−1
23 2.6 × 10
−1
3
10 7 × 10
−3
21 4.3 × 10
−2
23 5 × 10
−2
link increase considerably the variance of the measurements.
However, the Z-Wave communication protocol guarantees
good connectivity in a 1-hop link in an indoor ( laboratory )
environment, for a distance longer than 20 m.
4.2.2. Delay
The second set of measurements carried out with a Z-Wave
network is relative to the delay. The delay per packet is cal-
culated as the average (over the measurements) time inter-
val between the beginning of a transmission of a packet and
the beginning of the transmission of the following packet.
This time is normally necessary for transmitting the packet,
receiving the ACK (from all slaves connected to the tester),
and processing the packet at the controller and the slaves.
At high network traffic loads, or at low signal-to-noise ra-
tios at the receivers, this delay is strongly affected by colli-
sions (lost packets), and the consequent retransmissions by
the controller. Referring to the three scenarios described at
the beginning of Sec tion 4.2.1 and recalled in Ta ble 1, the
measured delays can be summarized as follows:
(1) 39 milliseconds, w hen the transmitted value is fixed
(fixed value);
40 milliseconds, when the transmitted value is variable
(variable value);
(2) 43 milliseconds, with fixed value;
43 milliseconds, with variable value;
(3) 61 milliseconds, with fixed value;
86 milliseconds, with variable value.
More precisely, fixed value indicates that the transmitted
value is always the same and there is no need to write it ev-
ery time into the flash memory, whereas variable value indi-
cates that the transmitted value needs to be written into the
flash memory every time, with a consequent loss of time for
the transmissions. These measurements are obtained by av-
eraging over 1000 repetitions of the same experiment. One
can see that writing into the flash memory has no relevance
in a network scenario with low traffic load. In fact, with a
higher load (due to routing and retransmissions), that is,
in the third case in Section 4.2.1 and above, node 1 has to
manage all packets in the network and writing into the flash
memory leads to a loss of time and busy waiting for the pack-
Monitor wpan
Sensor
wpan
Figure 17: Opnet scenario for performance evaluation of Zigbee
networks. An example with 10 RFDs (Sensor
wpan nodes) and 1
coordinator (Monitor
wpan node) is pictured.
ets. Therefore, the delay when the transmitted value is vari-
able increases.
5. SIMULATION RESULTS
In order to verify the experimental results obtained in
Section 4, we also present simulation results of Zigbee net-
works using the commercial simulator Opnet Modeler 11.5
[18] and a built-in Opnet model provided by the National
Institute of Standards and Technology (NIST) [34]. We note
that only simulations for Zigbee networks are carried out,
since Z-Wave is a proprietary protocol and the protocol stack
is known only at the application level. The Zigbee model pro-
vided by the NIST implements only the first two levels of the
ISO/OSI stack—that is, the levels corresponding to the IEEE
802.15.4 standard—and only a few functions of the upper
layer. Therefore, the major part of the control messages re-
quired by the Zigbee standard is not transmitted in the con-
sidered network simulation model.
In Figure 17, the Opnet scenario used for performance
evaluation of Zigbee networks is shown. In particular, an ex-
ample with 10 RFDs (referred to as “Sensor
wpan”) and 1
coordinator (referred to as “Monitor
wpan”) is pictured. The
task of the monitor is to receive packets and, then, compute
the average tra nsmission delay between two consecutively re-
ceived packets. In this case, the delay corresponds to the dif-
ference between the last backup instant and the reception in-
stant. The RFD, instead, sends data packets with a data rate
R
b
= 250 kbps and a constant generation interval g = 0.02
second. All packets have fixed length equal to 720 bits/pck.
All nodes in the network implement the protocol stack de-
scribed in Section 2.1. In particular, the channel access with
the CSMA/CA protocol is unslotted, that is, the GTSs are not
used in the SD. Moreover, the following backoff algorithm is
implemented when a collision is verified.
(i) The node tries to send its packet when the actual trans-
mission ends.
5
5
Note that the CSMA/CA algorithm uses a 1-persistent strategy [21].
12 EURASIP Journal on Wireless Communications and Networking
0 20 40 60 80 100 120
N
0
0.02
0.04
0.06
0.08
0.1
D (s)
n
max
BO
= 2
n
max
BO
= 3
n
max
BO
= 4
n
max
BO
= 5
n
max
BO
= 6
20 40 60 80 100 120
20
40
60
80
100
Figure 18: Simulation values of delay in a Zigbee network varying
the maximum backoff. The box contains a zoom of the curves asso-
ciated with n
max
BO
= 5andn
max
BO
= 6 at high values of the delay.
(ii) If a new collision happens, the node tries to transmit
again after a time
T
1
= αT
pck
,(4)
where α is randomly chosen in the interval [0, 2
B−1
),
T
pck
= L/R
b
,andB is a suitable integer constant.
(iii) When a new collision happens, the new backoff time is
given by
T
j
= 2T
j−1
, j = 2, , n
max
BO
,(5)
where n
max
BO
is the maximum backoff number chosen by
the user.
(iv) From the n
max
BO
th iteration on, the backoff time remains
fixed to
T
max
= 2
n
max
BO
−1
T
pck
. (6)
The simulation results are collected as a function of the num-
ber of nodes in the network, varying the maximum backoff
counter number n
max
BO
.InFigure 18, the delay is shown, as a
function of the number of nodes, for various values of the
maximum backoff number n
max
BO
.Ifn
max
BO
is small, the delay
remains low, regardless of the number of nodes. When a high
value of n
max
BO
is used, the delay increases abruptly for increas-
ing number of nodes. This is due to the higher trafficload
offered to the network. While, in the first case, the retrans-
mission occurs quickly, in the second case the node has to
wait for a longer time before attempting to retransmit. All the
curves shown in the figure have a floor. This value depends
only on the maximum backoff number n
max
BO
in the network.
The delay value for larger number of nodes is, in fact, dom-
inated by the maximum backoff value, given by (6). Note
0 20 40 60 80 100 120
N
0
5
× 10
4
1 × 10
5
1.5 × 10
5
Throughput (bit/s)
n
max
BO
= 2
n
max
BO
= 3
n
max
BO
= 4
n
max
BO
= 5
n
max
BO
= 6
Figure 19: Simulation values of throughput in a Zigbee network
varying the maximum backoff.
that inside Figure 18, another small figure is inserted. This
figure represents a “zoom” of the two curves associated with
n
max
BO
= 5andn
max
BO
= 6 at high values of the delay, in corre-
spondence to which they saturate. The choice of inserting a
zoomed figure inside Figure 18 is an expedient to show that
the delay saturates for any value of n
max
BO
.However,onecan
observe that increasing n
max
BO
from 4 to 5 causes an explosion
of the delay. In fact, n
max
BO
= 4 is the maximum backoff value
adopted in the standard [6], probably because it had already
been verified that higher values of n
max
BO
make the system un-
stable.
In Figure 19, the throughput at the coordinator is shown,
as a function of the number of transmitting nodes, for var-
ious values of the maximum backoff counter number n
max
BO
(as in Figure 18). All simulation results are obtained using
a packet length of 720 bits and a packet interarrival time of
g
= 0.02 second. Since a larger number of transmitting nodes
correspond to a higher trafficloadoffered to the network, we
obtain the typical throughput curve of a network which em-
ploys the CSMA/CA protocol [21]. In addition, we can ob-
serve that if the maximum backoff counter b ecomes higher,
the throughput at the monitor increases. This can be easily
explained considering (6).Ifweuseasmallbackoff value,
all the nodes which sense a collision try to retransmit after a
short interval, and consequently, the collision probability is
high. With a higher backoff value, instead, the retransmission
interval is longer, and therefore, the total number of success-
ful transmissions increases.
Our last simulation results, shown in Figure 20,areas-
sociated with a throughput-delay analysis. The same setup
of the previous experiments is employed. The curves shown
in Figure 20 are parameterized curves, obtained by combin-
ing the throughput curves in Figure 19 and the delay curves
in Figure 18, through the parameter g iven by the number
of transmitting nodes. The network behavior evidenced by
G. Ferrari et al. 13
5 × 10
4
1 × 10
5
1.5 × 10
5
Throughput (bit/s)
0
1
2
3
4
5
×10
−2
D (s)
n
max
BO
= 2
n
max
BO
= 3
n
max
BO
= 4
n
max
BO
= 5
n
max
BO
= 6
5 ×10
4
1 ×10
5
1.5 ×10
5
2 ×10
5
0
20
40
60
80
100
Figure 20: Simulation values of throughput-delay in a Zigbee net-
work varying the maximum backoff. The box contains a zoom of
the curve for high values of delay and throughput.
Table 2: Experimental and simulation results for a Zigbee network.
Results D (s) Throughput (bit/s)
Experimental 0.02237 21527
Simulation
0.004636 32186
the curves in Figure 20 is typical of a network adopting the
CSMA/CA protocol. For a given maximum backoff counter,
the corresponding curve presents an optimal working point,
corresponding to a critical throughput. If one could use a dy-
namic backoff, one could guarantee, at the minimum pos-
sible delay, a maximum throughput approximately equal to
1.5
× 10
5
bit/s. The inner small box in Figure 20 has been in-
cluded to show the throughput-delay behavior at high values
of the delay—this is consistent with the results in Figure 18.
As previously mentioned, because of problems in the Zig-
bee stack developed by Microchip, we had not been able to
perform an experimental analysis with more than 2 RFDs
connected directly to the coordinator. Therefore, a direct
comparison between simulation and experimental results
is possible only for a scenario with 1 RFD. The results of
this comparison are shown in Tab le 2 .Asonecansee,the
network performance predicted by the simulation is bet-
ter than that observed in the experimental analysis. This is
due to the absence of signal control in the Opnet model.
In an experimental wireless sensor network, in fact, nodes
have to exchange a lot of control messages (such as routing
and application layer messages). In the Opnet scenario, in-
stead, since only the first two levels of the ISO/OSI stack are
implemented, none of these messages are sent, and therefore,
the throughput is higher and the delay is lower.
6. CONCLUDING REMARKS
In this paper, we have considered two communication proto-
cols for wireless sensor networks: Zigbee and Z-Wave. They
have similar characteristics, but differ in some relevant as-
pects. In particular, since a Zigbee network is based on an
open communication protocol, it is more “flexible” than a Z-
Wave network, which, instead, is based on a proprietary pro-
tocol. The Zigbee communication protocol allows s impler
interfacing between sensors, whereas the Z-Wave commu-
nication protocol, originally designed for control networks
and not for monitoring, has more complicated connection
features. We have analyzed the network performance using
common indicators, such as throughput, delay,andconnec-
tivity. In particular, Zigbee networks have been studied using
all performance indicators, and experimental measurements
have been supported also by simulation results (using Opnet
network simulator) and with the use of a simple analytical
framework. The experimental results are in good agreement
with simulation and analytical results. Z-Wave networks, in-
stead, have been analyzed only in terms of connectivity ex-
perimental results (the Z-Wave protocol can be accessed only
at the application level). A simulation or theoretical perfor-
mance analysis of a Z-Wave network is, therefore, problem-
atic. The obtained results, in terms of network connection,
are similar for the two considered protocols. More precisely,
in both cases the connectivity behavior is bimodal, that is, the
connectivity is either full or basically inexistent.
REFERENCES
[1] I. F. Akyildiz and X. Wang, “A survey on wireless mesh net-
works,” IEEE Communications Magazine,vol.43,no.9,pp.
S23–S30, September 2005.
[2] R. Abileah and D. Lewis, “Monitoring high-seas fisheries
with long-range passive acoustic sensors,” in Proceedings
of MTS/IEEE ‘Prospects for the 21st Century’ Conference
(OCEANS ’96), vol. 1, pp. 378–382, Fort Lauderdale, Fla, USA,
September 1996.
[3] S. Barberis, E. Gaiani, B. Melis, and G. Romano, “Performance
evaluation in a large environment for the AWACS system,” in
Proceedings of IEEE International Conference on Universal Per-
sonal Communications (ICUPC ’98), vol. 1, pp. 721–725, Flo-
rence, Italy, October 1998.
[4] C Y. Chong and S. P. Kumar, “Sensor networks: evolution, op-
portunities, and challenges,” Proceedings of the IEEE, vol. 91,
no. 8, pp. 1247–1256, August 2003.
[5] S. N. Simic and S. Sastry, “Distributed environmental mon-
itoring using random sensor networks,” in Proceedings of the
2nd International Workshop on Information Processing in Sen-
sor Networks ( IPSN ’03), pp. 582–592, Palo Alto, Calif, USA,
April 2003.
[6] “IEEE 802.15.4 Std: Wireless Medium Access Control (MAC)
and Physical L ayer (PHY) Specifications for Low-Rate Wire-
less Personal Area Networks (LR-WPANs),” IEEE Computer
Society Press, pp. 1–679, October 2003.
[7] “IEEE 802.11 Std: Wireless LAN Medium Access Control
(MAC) and Physical Layer (PHY) Specifications,” IEEE Com-
puter Society Press, pp. 1–459, June 1997.
[8] “IEEE 802.15.1 Std: Wireless Medium Access Control (MAC)
and Physical Layer (PHY) Specifications for Wireless Personal
14 EURASIP Journal on Wireless Communications and Networking
Area Networks (WPANs),” IEEE Computer Society Press,pp.
1–1169, June 2002.
[9] A. Sikora and V. Groza, “Coexistence of IEEE 802.15.4 with
other systems in the 2.4 GHz-ISM-band,” in Proceedings of
IEEE Instrumentation and Measurement Technology Conference
(IMTC ’05), vol. 3, pp. 1786–1791, Ottawa, Canada, May 2005.
[10] D. Cox, E. Jovanov, and A. Milenkovic, “Time synchronization
for Zigbee networks,” in Proceedings of the 37th Annual South-
eastern Symposium on System Theory (SSST ’05), pp. 135–138,
Tuskegee, Ala, USA, March 2005.
[11] O. Hyncica, P. Kacz, P. Fiedler, Z. Bradac, P. Kucera, and R.
Vrba, “The Zigbee experience,” in Proceedings of the 2nd Inter-
national Symposium on Communications, Control, and Signal
Processing (ISCCSP ’06), Marrakech, Morocco, March 2006.
[12] J S. Lee, “An experiment on performance study of IEEE
802.15.4 wireless networks,” in Proceedings of the 10th IEEE
Conference on Emerging Technologies and Factory Automation
(ETFA ’05), vol. 2, pp. 451–458, Catania, Italy, September
2005.
[13] T. Sun, L J. Chen, C C. Han, G. Yang, and M. Gerla, “Mea-
suring effective capacity of IEEE 802.15.4 beaconless mode,” in
Proceedings of IEEE Wireless Communications and Networking
Conference (WCNC ’06), vol. 1, pp. 493–498, Las Vegas, Nev,
USA, April 2006.
[14] Microchip, />[15] Zensys, />[16] “ZW0201 Z-Wave Single Chip,” Z-Wave technical documenta-
tion, pp. 1–24, December 2005.
[17] O. K. Tonguz and G. Ferrari, Ad Hoc Wireless Networks:
A Communication-Theoretic Perspective,JohnWiley&Sons,
Chichester, UK, 2006.
[18] Opnet, />[19] A. Anandarajah, K. Moore, A. Terzis, and I. J. Wang , “Sensor
networks for landslide detection,” in Proceedings of the 3rd In-
ternational Conference on Embedded Networked Sensor Systems
(SenSys ’05), pp. 268–269, San Diego, Calif, USA, November
2005.
[20] Zigbee Alliance, />[21] A. S. Tanenbaum, Computer Networks, Prentice-Hall, Upper
Saddle River, NJ, USA, 4th edition, 2003.
[22] C. E. Perkins and E. M. Royer, “Ad-hoc on-demand distance
vector routing,” in Proceedings of the 2nd IEEE Workshop on
Mobile Computing Systems and Applications (WMCSA ’99),pp.
90–100, New Orleans, La, USA, February 1999.
[23] M. Neugebauer, J. Pl
¨
onnigs, and K. Kabitzsch, “A new beacon
order adaptation algorithm for IEEE 802.15.4 networks,” in
Proceedings of the 2nd European Workshop on Wireless Sensor
Networks (EWSN ’05), pp. 302–311, Istanbul, Turkey, January-
February 2005.
[24] Datasheet for CC2420 2.4 GHz IEEE 802.15.4/Zigbee Tran-
sceiver, />Data Sheet 1
3.pdf.
[25] L. Kleinrock and F. A. Tobagi, “Packet switching in radio chan-
nels: part I—carrier sense multiple-access modes and their
throughput-delay characteristics,” IEEE Transactions on Com-
munications, vol. 23, no. 12, pp. 1400–1416, December 1975.
[26] J. Zheng and M. J. Lee, “Will IEEE 802.15.4 make ubiqui-
tous networking a reality?: a discussion on a potential low
power, low bit rate standard,” IEEE Communications Maga-
zine, vol. 42, no. 6, pp. 140–146, June 2004.
[27] E. Callaway, P. Gorday, L. Hester, et al., “Home networking
with IEEE 802.15.4: a developing standard for low-rate wire-
less personal area networks,” IEEE Communications Magazine,
vol. 40, no. 8, pp. 70–77, August 2002.
[28] “Z-Wave ZW0102/ZW0201 Appl. Prg. Guide,” Z-Wave techni-
cal documentation, pp. 1–242, December 2005.
[29] “ZW0102/ZW0201 Developer’s Kit v4.10—Software Release
Note,” Z-Wave technical documentation, pp. 1–27, December
2005.
[30] N. Golmie, D. Cypher, and O. Rebala, “Performance evalu-
ation of low rate WPANS for medical applications,” in Pro-
ceedings of IEEE Military Communications Conference (MIL-
COM ’04), vol. 2, pp. 927–933, Monterey, Calif, USA, October-
November 2004.
[31] R. Meester and R. Roy, Continuum Percolation, Cambridge
University Press, Cambridge, UK, 1996.
[32] Y C. Cheng and T. G. Robertazzi, “Critical connectivity phe-
nomena in multihop radio models,” IEEE Transactions on
Communications, vol. 37, no. 7, pp. 770–777, July 1989.
[33]D.Kotz,C.Newport,R.S.Grey,J.Liu,Y.Yuan,and
C. Elliott, “Experimental evaluation of wireless simula-
tion assumptions,” Tech. Rep. TR2004-507, Dartmouth
Computer Science Department, Hanover, NH, USA, 2004,
/>[34] National Institute of Standards and Technology (NIST),
/>