Báo cáo hóa học: " Analysis of Free Energy Signals Arising from Nucleotide Hybridization between rRNA and mRNA Sequences during Translation in Eubacteria" docx
Bạn đang xem bản rút gọn của tài liệu. Xem và tải ngay bản đầy đủ của tài liệu tại đây (1 MB, 9 trang )
Hindawi Publishing Corporation
EURASIP Journal on Bioinformatics and Systems Biology
Volume 2006, Article ID 23613, Pages 1–9
DOI 10.1155/BSB/2006/23613
Analysis of Free Energy Signals Arising from Nucleotide
Hybridization between rRNA and mRNA Sequences during
Translation in Eubacteria
Lalit Ponnala,
1
Anne-Marie Stomp,
2
Donald L. Bitzer,
3
and Mladen A. Vouk
3
1
Department of Electrical and Computer Engineering, North Carolina State University, Raleigh, NC 27695, USA
2
Department of Forestry, North Carolina State University, Raleigh, NC 27695, USA
3
Depar tment of Computer Science, North Carolina State University, Raleigh, NC 27695, USA
Received 14 April 2006; Revised 20 September 2006; Accepted 3 October 2006
Recommended for Publication by Yidong Chen
A decoding algor ithm that mechanistically models the progressive alignments that arise as the mRNA moves past the rRNA tail
during t ranslation elongation is tested. Each of these alignments provides an opportunity for hybridization between the single-
stranded, 3
-terminal nucleotides of the 16S rRNA and the spatially accessible window of mRNA sequence, from which a free
energy value can be calculated. Using this algorithm, we show that a periodic energetic pattern of frequency 1/3 is revealed. This
periodic signal exists in the majority of coding regions of eubacterial genes, but not in the noncoding regions encoding the 16S
and 23S rRNAs. Signal analysis reveals that the population of coding regions of each bacterial species has a mean phase that is
correlated in a statistically significant way with species (G+C) content. These results suggest that the periodic signal could function
as a synchronization signal for the maintenance of reading frame and that codon usage provides a mechanism for manipulation of
signal phase.
Copyright © 2006 Lalit Ponnala et al. This is an open access article distributed under the Creative Commons Attribution License,
which permits unrestricted use, distribution, and reproduction in any medium, provided the original work is properly cited.
1. INTRODUCTION
The complexity of living organisms makes them informa-
tion-rich systems. As such, many processes are available for
the application of signal processing analysis to reveal under-
lying mechanisms of information encoding and decoding.
The mathematical methods of signal processing are well es-
tablished and are used to extract encoded information from
energetic patterns. These methods yield estimates of pa-
rameters that characterize the signal. Examples of the most
basic parameters include frequency, phase, and magnitude.
Through the study of system response to signal parameter
change, the information content of signal parameters can be
identified and the encoding and decoding rules can be de-
fined. The application of signal processing analysis to a bi-
ological process requires the identification of a sig nal that
could arise fol lowed by characterization of signal par a meters
that correlate with process behavior.
It is well established that nucleic acid molecules, that is,
DNA and RNA, encode information in their nucleotide se-
quences that is essential to a number of cellular processes.
Therefore, it is reasonable to use a signal processing approach
to further our understanding of the rules and mechanisms
of information encoding and decoding. The process of pro-
tein synthesis, or translation, is the most-studied biological
process in which information encoded in the nucleotide se-
quence of mRNA is decoded into the correct sequence of
amino acids in a polypeptide. Nucleic acids are long poly-
mers of four nucleotide bases: adenine (A), guanine (G), cy-
tosine (C), and thymidine (T, DNA) or uracil (U, mRNA).
The chemical structure of the nucleotides provides for the
formation of hydrogen bonds (hybridization) between pairs
of nucleotide bases following specific rules. In Watson-Crick-
type hybridization, the rules are that adenine forms two hy-
drogen bonds with either thymidine or uracil and guano-
sine forms three hydrogen bonds with cytosine. If two single-
stranded nucleic acid sequences can spatially align such that
the hybridization can occur, they will form a stable, dou-
ble helical structure and are said to be complementary. Hy-
bridization of t wo nucleic acid molecules results in a change
in free energy that is proportional to the number of hydro-
gen bonds formed between the two molecules. Watson-Crick
2 EURASIP Journal on Bioinformatics and Systems Biology
hybridization can be thought of as a signal generating process
in which the signal is the free energy change associated with
nucleic acid alignment. Variation in the signal arises from the
sequence variation which determines the degree to which the
two sequences are complementary.
There are a number of biological processes that in-
volve Watson-Crick hybridization and in which nucleic acids
participate including tRNA hybridization to mRNA dur-
ing tr anslation, recognition of the correct site for Okazaki
fragment polymerization by primase during DNA replica-
tion [1], snRNA hybridization to pre-mRNA sequences dur-
ing intron splicing [2], and siRNA hybridization to mRNAs
during gene silencing [3]. In translation, the precision of
hybridization b etween the anticodon sequence of a tRNA
molecule, carrying a specific amino acid, and the codon se-
quence of an mRNA molecule determines if that amino acid
is polymerized into the polypeptide chain.
Two more examples of RNA-RNA hybridization encod-
ing translation process information also exist. Shine and Dal-
garno [4] observed sequence complementarity between the
3
-terminal single-stranded nucleotide sequence of the 16S
rRNA (rRNA tail) and a window of mRNA sequence up-
stream of the start codon and they hypothesized that the
resulting hybridization could stabilize the mRNA/30S ribo-
some subunit complex. This observation w as confirmed ex-
perimentally [5, 6] and established 30S ribosome subunit re-
cruitment as a role for the rRNA tail in translation initia-
tion. More than a decade later, Weiss et al. [7, 8] showed
that hybridization between the rRNA tail and the mRNA
was a critical component regulating a shift of reading frame
during bacterial translation of the mRNA encoding the RF2
protein in E. coli. This was the first direct evidence of a
role for hybridization of the rRNA tail with the mRNA dur-
ing translation elongation. The requirements for exact se-
quence and exact spacing of sequence lead the investigators
to conclude that the rRNA tail “ scans the mRNA during
elongation ”[8].
The idea of one nucleic acid molecule, the rRNA tail,
“scanning” a second nucleic a cid molecule, the mRNA, sug-
gested to us the structure of a decoding algorithm from
which a signal could arise. Each scanning alignment step
would produce a free energy of hybridization value whose
magnitude would be proportional to the degree of sequence
complementarity. The linear series of these free energy val-
ues could constitute a signal indexed by nucleotide position
on the mRNA molecule. The work of Weiss et al. [8] sug-
gested to us that such a signal could encode information that
the translation process utilizes for the maintenance of read-
ing frame.
In considering this hypothesis, two expectations seemed
critical. If information for the maintenance of the reading
frame exists in the rRNA tail signal, such an information
signal would be expected to a rise in the coding regions of a
majority, if not all mRNA sequences. Additionally, if the sig-
nal did supply information for the maintenance of reading
frame, it could exist across many species of bacteria if they
employed the same mechanisms as E. coli. If the signal was
found to exist across species, it would need to be maintained
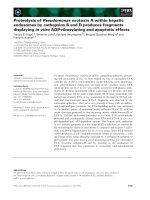
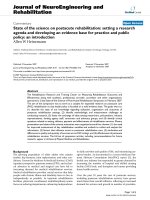
Position 0. Free energy value = 0.0
rRNA: auuccuccacuag
mRNA: GGUAAAAGAAUAAUGGC
Position 1. Free energy value
= 0.0
rRNA: auuccuccacuag
mRNA: GGUA AAAG AAUA AUGG C
.
.
.
Position 63. Free energy value
= 1.7
rRNA: auuccuccacuag
mRNA: UCACCGAGAUCCUGGUC
.
.
.
Position N-2. Free energy value
= 0.0
rRNA: auuccuccacuag
mRNA: GCCG UCUG GUGA UGUA A
Position N-1. Free energy value
= 0.7
rRNA: auuccuccacuag
mRNA: GCCG UCUG GUGA UGUA A
Figure 1: Alignment of the 16S rRNA tail with the mRNA sequence
of gene aceF in E. coli. Free energ y values of 0 indicate unfavorable
binding. T he length of the gene is N
= 1893 nucleotides.
regardless of (G+C) content, known to vary across bac terial
species. The purpose of this study was to rigorously estab-
lish that a free energy signal can be decoded from mRNA
sequences utilizing an algorithm that models the mechani-
cal movement of the mRNA through the ribosome during
translation. Our study then characterizes this signal in terms
of frequency, phase, and magnitude. Our results indicate that
coding regions of species tend to a mean species phase. Fi-
nally, we show that the signal phase is a function of sequence
(G+C) content, an indirect measure of codon bias. This last
finding suggests the possibility that regulation of transla-
tional efficiency through codon usage could be mediated by
signal phase.
2. FREE ENERGY CALCULATIONS
A simple algorithm has been developed by Starmer et al. [9,
10] and utilized for this study which generates a free energy
signal as a function of nucleotide position (the decoding al-
gorithm). Briefly, the algorithm requires a short nucleic acid
sequence as the “decoder” that is successively aligned with a
longer “message” sequence in which information is encoded
(Figure 1). At each alignment, the algorithm calculates a free
energy of nucleotide hybridization, ΔG
, for the optimal he-
lical structure between the “decoder,” for this study the 3
-
terminal, single-stranded, nucleotides of the 16S rRNAs of
bacterial species (16S rRNA tails), and the “message,” the
mRNA sequence that would be aligned with the 16S rRNA
tail as the mRNA moves through the ribosomal complex as it
is translated. The actual free energy calculation utilizes dy-
namic programming extended to allow for internal loops,
to identify the minimal free energy conformation and the
Individual nearest-neighbor hydrogen bond model [11]to
Lalit Ponnala et al. 3
Table 1: List of eubacteria used in our study.
Species name GenBank accession number 16S tail (G+C) percentage
Buchnera aphidicola NC 004545 auuccuccacuag 26
Borrelia burgdorfer i NC
001318 uuuccuccacuag 28
Bacillus licheniformis NC
006322 uuuccuccacuag 46.2
Clostridium perfringens NC
003366 uuuccuccacuag 27
Deinococcus radiodurans NC
001263 uuuccuccacuag 66.6
Escherichia coli K-12 NC
000913 auuccuccacuag 50
Mycoplasma hyopneumoniae NC
006360 uuuccuccacuag 28.6
Pseudomonas syringae NC
005773 auuccuccacuag 55.6
Rhodobacter sphaeroides NC
007493 uuuccuccacuag 68.8
Shigella boydii NC
007613 auuccuccacuag 47.4
Salmonella enterica NC
006511 auuccuccacuag 52.2
Thermus thermophilus NC
005835 uuuccuccacuag 69.4
estimate the associated free energy value for that conforma-
tion. Adjustments to the free energy values for loop penal-
ties [12] and for G/U mismatches [13] are also incorporated.
Bulges, more complex secondary structures involving only
one of the two strands of RNA, are not considered in the
calculation. This assumption was made based on structural
models of the 70S ribosomal complex [14, 15] in which the
estimated space of the mRNA channel is thought to be insuf-
ficient for bulges and secondary structures to exist. The algo-
rithm assigns the free energy value to an mRNA nucleotide.
The alignment is then shifted one nucleotide downstream
(in the 3
direction along the mRNA) and the free energy
value of the new alignment is calculated and assigned. This
approach generates a set of free energy values for an entire
mRNA sequence indexed by nucleotide position. Our analy-
sis assumes that the linear array of free energy values consti-
tutes a discrete signal. This signal was examined using meth-
ods of time-series analysis, with signal points indexed by nu-
cleotide position, instead of time.
Sequence information and the genome databases used
for this study are given in Tabl e 1.Genesequencesfor
12 eubacterial species, including E. coli K-12, were ob-
tained from the NCBI GenBank database (i.
nlm.nih.gov/). Using GenBank annotation, the coding se-
quences were sorted into two categories: (1) verified se-
quences, that is, genes with a clearly annotated function and
(2) hypothetical sequences, that is, genes listed as hypotheti-
cal or putative. For E. coli, sequences encoding the 16S and
23S rRNAs were also used, designated as “noncoding” se-
quences to indicate that they do not encode amino acid se-
quence information. The 3
-terminal nucleotide sequences
of the 16S rRNA (16S rRNA tails) for each species are also
presented in Tab le 1. When calculating the free energy sig-
nals from a species population of mRNAs, the species’ own
16S rRNA tail was used. These tails are the 3
-single-stranded
rRNA sequences that are potentially available for hybridiza-
tion to the mRNA as it moves across the ribosome during
translation.
30 25 20 15 10 50 510
Base position
8
6
4
2
0
(a)
200 205 210 215 220 225 230
Base position
3.5
3
2.5
2
1.5
1
0.5
0
(b)
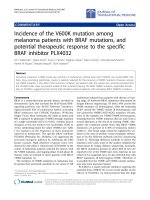
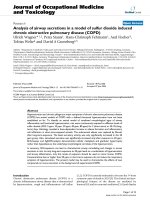
Figure 2: Free energy signal for aceF (a) upstream region and (b)
downstream region.
A sample free energy signal, computed using the gene
aceF sequence in E. coli, is shown in Figure 2. The estimated
free energy for the alignment of the 5
-terminal nucleotide
of the tail with the first base of the start codon is plotted at
position 0 on the horizontal axis. The free energy estimates
calculated for downstream alignments are plotted at positive
indices while negative indices on the horizontal axis indicate
free energy estimates for upstream alignments.
Two features of this variable free energy pattern are of
note. There is a t rough of negative free energy a t nucleotide
position
6. Earlier studies have identified the presence of an
upstream free energy trough in genes of E. coli [16] and other
bacteria [17]. This trough is interpreted as the signal feature
4 EURASIP Journal on Bioinformatics and Systems Biology
00.05 0.10.15 0.20.25 0.30.35 0.40.45 0.5
Cycles/base
0
2
4
6
8
10
12
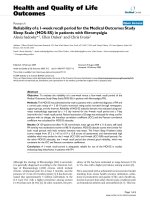
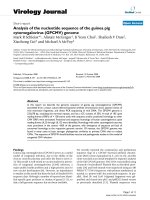
Figure 3: Periodogram for aceF.
for the Shine-Dalgarno reg ion [16–22]. The other n otewor-
thy feature is the pattern of negative free energy troughs that
occur roughly every third nucleotide throughout the coding
sequence. The suggestion of periodicity can be quantitatively
confirmed using signal processing methodology.
3. SIGNAL ANALYSIS
The set of free energy estimates are assumed to be a discrete
signal, denoted as
x
=
x
0
, x
1
, , x
N 1
. (1)
The periodog ram is defined as [23]
I
k
=
1
N
X
k
2
, k = 0 (N 1), (2)
where
X
k
=
N 1
n=0
x
n
e
j2πkn/N
, k = 0 (N 1). (3)
The periodigram of the free energy signal for a sample
gene aceF reveals a dominant frequency of 1/3 cycles/base
(Figure 3). The absence of other strong periodic components
suggests that this signal can be modeled as the sum of a sine
wave of frequency f
= 1/3 and noise. A model for the sig nal
can be written as
x
n
= μ + A sin(2πfn+ φ)+e
n
,(4)
where A is the amplitude, φ is the phase, f
= 1/3 is the spec-
ified frequency, and e
n
is Gaussian white noise with variance
σ
2
. As per this model, if a periodic component of frequency
f
= 1/3 does not exist, the signal would be interpreted as
600 700 800 900 1000 1100 1200 1300 1400 1500
Length of signal
0.75
0.8
0.85
0.9
0.95
1
Power
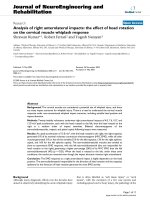
Figure 4: Power versus length at SNR = 18 dB.
Table 2: E. coli signal parameters.
Parameter Mean Std. dev.
Phase (degrees) 14.53 23.26
SNR (dB)
18.35 1.84
white noise. To test the hypothesis that a free energy signal
can be modeled from the var iable free energy pattern arising
from hybridization of the rRNA tail with the mRNA, the as-
sumption is made that such a signal exists in the majority of
coding regions. However, coding regions v ary in length and
signal length will affect the power of the statistical test. To en-
sure that the statistical test has sufficient power, the relation-
ship between signal length, defined as nucleotide sequence
length, and power was determined for an SNR of
18 dB,
the mean SNR for E. coli K-12 coding regions (Ta ble 2). As
shown in Figure 4,apowerof0.92 can be achieved using
a signal length of greater than or equal to 900 nucleotides.
Therefore, only coding regions of 900 nucleotides or greater
were used to insure a robust statistical test.
The statistical test was performed with the null hypoth-
esis that the free energy pattern contains only white noise,
versus the alternate hypothesis that a signal does exist and it
contains a dominant frequency component of f
= 1/3[24].
The signal model can be written in the equivalent form
x
n
= μ + C
1
sin(2πfn)+C
2
cos(2πfn)+e
n
,(5)
where C
1
= A cos(φ)andC
2
= A sin(φ) are nonrandom con-
stants.
The signal sum-of-squares
x
2
can be partitioned by pe-
riodic components, allowing the construction of a test of hy-
pothesis [24]. Our null hypothesis is
H
0
: C
1
= C
2
= 0(6)
Lalit Ponnala et al. 5
Table 3: Detection results.
Species Sequence type Sample size Passed
Buchnera aphidicola
Verified 206 197
Hypothetical 34 32
Borrelia burgdorfer i
Verified 265 242
Hypothetical 140 99
Bacillus licheniformis
Verified 1318 1068
Hypothetical 375 272
Clostridium perfringens
Verified 489 484
Hypothetical 679 648
Deinococcus radiodurans
Verified 577 573
Hypothetical 490 475
Escherichia coli
Verified 1193 1144
Hypothetical 758 685
Mycoplasma hyopneumoniae
Verified 186 173
Hypothetical 164 131
Pseudomonas syringae
Verified 1919 1888
Hypothetical 472 440
Rhodobacter sphaeroides
Verified 977 972
Hypothetical 359 357
Shigella boydii
Verified 875 838
Hypothetical 715 653
Salmonella enterica
Verified 995 952
Hypothetical 771 684
Thermus thermophilus
Verified 654 654
Hypothetical 197 194
and our alternate hypothesis is
H
1
: C
1
and C
2
are both not zero. (7)
From [24], we know that under H
0
,
2I
N/3
∼ σ
2
χ
2
(2) (8)
and I
N/3
is independent of
N 1
i=0
x
2
i
I
0
2I
N/3
∼ σ
2
χ
2
(N 3). (9)
We may reje ct H
0
in favor of H
1
at level α if
(N
3)I
N/3
N 1
i
=0
x
2
i
I
0
2I
N/3
>F
1 α
(2, N 3). (10)
The results of this test for the verified and hypothetical
sequences greater than 900 nucleotides in various eubacteria
are given in Tabl e 3. The test is perfor med at level α
= 0.05.
“Sample size” indicates the number of sequences in each cat-
egory. “Passed” indicates the number of sequences whose
free energy signal shows only one periodic component of
the assumed frequency for the hidden periodicity statistical
test, that is, f
= 1/3. We observe that 95.9% of the selected
verified sequences and 90.4% of the chosen hypothetical se-
quences in E. coli demonstrate strong periodicity at f
= 1/3
in their free energy signals. For the other bacterial species in
our study, whose genomic (G+C) contents ranged from 26%
to 69.4% (Tabl e 1), the majority of their verified and hypo-
thetical sequences were also found to demonstrate strong pe-
riodicity at f
= 1/3.
If the information encoded by the periodic signal is rel-
evant to translation, we might expect that it would only be
present in the coding sequences and not in the sequences
that are not translated. Testing this hypothesis would require
applying our algorithm to noncoding sequences minimally
750 to 900 nucleotides in length, based on estimated relation-
ship of statistical power and SNR, to have sufficient statisti-
cal power (Figure 4). In bacteria, the rRNA sequences are the
only sequences that are sufficiently long to satisfy these con-
siderations. Therefore, we used the 16S and 23S rRNA gene
sequences, of which there are 7 each in E. coli, to test the hy-
pothesis. The free energy patterns calculated using these se-
quences did not show periodicity at f
= 1/3, consistent with
the correlation between signal presence and periodicity and
6 EURASIP Journal on Bioinformatics and Systems Biology
00.05 0.10.15 0.20.25 0.30.35 0.40.45 0.5
Cycles/base
0
2
4
6
8
10
12
14
Figure 5: Periodogram calculated using the free energ y signal for a
23S rRNA sequence in E. coli.
sequences that are translated. Figure 5 shows an example of
the periodogram of a noncoding sequence, 23S rRNA.
For those free energy signals for which our model (4)
is valid, we can evaluate the power of the 1/3 harmonic
and estimate the noise variance using trigonometric regres-
sion [25, 26]. The regression procedure performs a least-
squares fit of the model described by (5) to the free energy
signal x.
The best-fit values of C
1
and C
2
,denotedby
C
1
and
C
2
,
respectively, can be used to estimate the magnitude and phase
of the signal using (11)and(12). It can be shown that the re-
gression procedure is equivalent to maximum-likelihood es-
timation, under the assumption that the i.i.d. noise, e
n
,fol-
lows a normal distribution [25]:
A =
C
2
1
+
C
2
2
, (11)
φ = arctan
C
2
C
1
. (12)
The power of the sinusoidal component can be calculated
using ( 13 ). The mean-squared error (MSE) from regression
yields an estimate of the noise variance
σ
2
. The power of the
noise and the signal-to-noise ratio (SNR) are calculated us-
ing (14)and(15), respectively:
P
signal
= 10 log
10
A
2
2
dB (13)
P
noise
= 10 log
10
σ
2
dB, (14)
SNR
=
P
signal
P
noise
dB. (15)
Histograms for signal phase and SNR for verified genes in
E. coli are shown in Figures 6 and 7, respectively. The mean
and standard deviation of the estimated parameter values are
shown in Table 2. These values are calculated using verified
genes in E. coli that pass our detection test (1144 in number).
100 80 60 40 20 0 20 40
Phase (degrees)
0
5
10
15
20
25
30
35
Number of genes
Figure 6: Histogram of phase of verified sequences.
26 24 22 20 18 16 14 12
SNR (dB)
0
5
10
15
20
25
30
35
Number of genes
Figure 7: Histogram of SNR of verified sequences.
The revelation of a free energy signal embedded in coding
regions provides the foundation for further studies to deter-
mine if the signal could provide information for the main-
tenance of reading frame. If this is its function, it would be
reasonable to expect the signal to be present in coding re-
gions of eubacterial species in general. To determine if this
is true, we selected 12 eubacteria of varying (G+C) content,
listed in Table 1. The verified genes that passed the detec-
tion test for each species were used for analysis. The free en-
ergy signals for each species were calculated using its specific
16S tail, shown in Table 1. We found that a periodic signal is
present in the coding regions of genes in all the species tested
and that the mean phase of these signals is roughly propor-
tional to the (G+C) content (Figure 8).AnANOVAtestin-
dicated a significant effect of (G+C) content on the signal
phase.
Lalit Ponnala et al. 7
25 30 35 40 45 50 55 60 65 70
Percent (G+C) content
100
80
60
40
20
0
20
40
Mean phase angle (degrees)
Mean phase
Mean+std. dev.
Mean
std. dev.
Regression line
Figure 8: Phase as a function of (G+C) across eubacterial species.
4. DISCUSSION
Our algorithm models the movement of the ribosome rel-
ative to the mRNA during translation. This model assumes
that a continual series of mRNA sequence w indows is acces-
sible for hydrogen bond formation to occur between the 16S
rRNA tail and the mRNA as they move by each other dur-
ing the translation process. The free energy associated with
each of these windows is a function of the degree of com-
plementarity between the 16S rRNA tail and the mRNA se-
quence window. Using this model, it is clear that a periodic
signal is encoded in the free energy variation. Standard signal
processing and statistical analyses show that this signal has a
dominant frequency 1/3 and that it is encoded in the major-
ity of protein-encoding sequences of genes in a diverse g roup
of eubacterial species, including E. coli. This periodic signal is
not present in genomic sequences that encode rRNAs which
do not participate in translation. Although this result is con-
sistent with the signal being present only in sequences that
are translated, the limited sample size (there are only 7 rRNA
encoding genes in E. coli) prevents meaningful statistical con-
firmation of the hypothesis that the signal exists only in se-
quences encoding proteins. These results reveal a signal and
provide a signal decoding mechanism, however they do not
explain what parameters contribute to sig nal structure and
what role it could play in translation.
In our model, the energetic variation of the signal arises
from the variation in mRNA nucleotide sequence. That the
signal has a frequency 1/3 implies that the mRNA nucleotide
sequence has a frequency 1/3. Periodicity in the coding re-
gions of genes has been observed prior to our results us-
ing statistical correlation analysis of coding regions. Lio et
al. [27] have investigated prokaryotic and eukaryotic DNA
sequences for the presence of subcodes following a peri-
odicity rule based on the ideas of several investigators [28,
29]. The analysis of individual gene sequences from b oth
prokaryotes and eukaryotes revealed period-three recurrence
of (G+C) bases in the codon third position, coherent with
the reading frame for the gene ((G+C)
3
periodicity). This
period-three recurrence was found in some translated se-
quences in both prokaryotes and eukaryotes but was not
found in introns, repetitive DNA, or sequences encoding
rRNAs or tRNAs [27]. These results are consistent with ours.
The analysis of Lio et al. also identified translated sequences
in which (G+C)
3
periodicit y could not be resolved, how-
ever they did not exclude the possibility that a weaker period-
three signal could be present. This result is consistent with a
relatively low SNR for their signal, impairing resolution of all
but the strongest signals.
The new observation of a mean phase for E. coli genes
suggested the subsequent study to determine if the presence
of coding region periodicity with constant phase is a feature
peculiar to E. coli or that is a more general feature of prokary-
otic genomes. Our results indicate that each bacterial genome
does have a distribution of s ignal phase, however, the mean
phaseforeachspeciesisdifferent. Knowing that the (G+C)
content of genomes varies, and that this variation is a reflec-
tion of the species preference for certain codons (generally
referred to as synonymous codon bias [30]), we hypothe-
sized that the signal phase is a function of (G+C) content.
Our regression results indicate that phase is a function of
(G+C) content and that there is a significant difference in
the signal phase of species that are widely dist ributed across
(G+C) content. The functional relationship between phase
and (G+C) content means that the signal phase can be ma-
nipulated through codon selection.
The role of Watson-Crick hybridization between 16S
rRNA sequences, including the tail, and the mRNA during
translation has long been the subject of investigation. Tri-
fonov [31] suggested that this hybridization could play a role
in maintenance of reading frame during translation. The ele-
gant work of Weiss et al. [7, 8] using mutant analysis of both
the mRNA and the 16S rRNA clearly showed that hybridiza-
tion between these two molecules was critical in the shift of
reading frame that regulates the production of RF2 protein in
E. coli. Our results suggested that parameters of the energetic
signal, that is, phase, could supply the translational process
information for maintenance of reading frame.
Our findings are consistent with this hypothesis. To
maintain the correct reading frame, the ribosome must
translocate three nucleotides after each amino acid is incor-
porated into the polypeptide product of the translation pro-
cess. Therefore, it would be expected that a signal encoding
reading-frame information would h ave a dominant 1/3fre-
quency, as our signal does. In addition, using a robust sta-
tistical test, we found the sig nal to be present in genomic se-
quences that encode proteins, again an expected result. Our
results also imply that specific manipulation of codon us-
age, which would modify (G+C) content, could locally adjust
phase and potentially impact reading frame fidelity.
The next step in establishing a role for our signal in main-
tenance of reading frame is a critical test of the hypothesis.
Such a test is underway in our group, using the sequence en-
coding the RF2 protein, prfB, a sequence known to harbor a
programmed +1 frameshift. If the free energy signal was sup-
plying information that maintains or regulates the reading
8 EURASIP Journal on Bioinformatics and Systems Biology
frame of translation, we would expect that changes in reading
frame during translation elongation would be accompanied
by changes in the phase of the free energy signal. Preliminary
results [32] indicate that an abrupt phase shift occurs in the
prfB sequence at the location of the programmed frameshift.
This result has encouraged us to refine and further develop
our model of reading frame maintenance, confirming the
value and utility of the signal processing approach.
ACKNOWLEDGMENT
This work is supported in part by NC State DURP Funds.
REFERENCES
[1] D. N. Frick and C. C. Richardson, “DNA primases,” Annual
Review of Biochemistry, vol. 70, pp. 39–80, 2001.
[2] B. C. Rymond and M. Rosbash, “Yeast pre-mRNA splicing,” in
The Molecular and Cellular Biolog y of the Yeast Saccharomyces:
Vol. II. Gene Expression,E.Jones,J.Pringle,andJ.Broach,Eds.,
vol. 2, pp. 143–192, New York, NY, USA, 1992.
[3] J. G. Doench, C. P. Petersen, and P. A. Sharp, “siRNAs can
function as miRNAs,” Genes and Development,vol.17,no.4,
pp. 438–442, 2003.
[4] J. Shine and L. Dalgarno, “The 3
-terminal sequence of Es-
cherichia coli 16S ribosomal RNA: complementarity to non-
sense triplets and ribosome binding sites,” Proceedings of the
National Academy of Sciences of the United States of America,
vol. 71, no. 4, pp. 1342–1346, 1974.
[5] J. A. Steitz and K. Jakes, “How ribosomes select initiator re-
gions in mRNA: base pair formation between the 3
terminus
of 16S rRNA and t he mRNA during initiation of protein syn-
thesis in Escherichia coli,” Proceedings of the National Academy
of Sciences of the United States of America, vol. 72, no. 12, pp.
4734–4738, 1975.
[6] A. Hui and H. A. de Boer, “Specialized ribosome system: pref-
erential translation of a single mRNA species by a subpopula-
tion of mutated r ibosomes in Escherichia coli,” Proceedings of
the National Academy of Scie nces of the United States of Amer-
ica, vol. 84, no. 14, pp. 4762–4766, 1987.
[7] R. B. Weiss, D. M. Dunn, J. F. Atkins, and R. F. Gesteland,
“Slippery runs, shifty stops, backward steps, and forward hops:
2, 1, +1, +2, +5, and +6 ribosomal frameshifting,” Cold
Spring Harbor Symposia on Quantitative Biology, vol. 52, pp.
687–693, 1987.
[8] R. B. Weiss, D. M. Dunn, A. E. Dahlberg, J. F. Atkins, and R.
F. Gesteland, “Reading frame switch caused by base-pair for-
mation between the 3
endof16SrRNAandthemRNAdur-
ing elongation of protein synthesis in Escherichia coli,” EMBO
Journal, vol. 7, no. 5, pp. 1503–1507, 1988.
[9] J. D. Starmer, “Free2Bind: tools for computing minimum
free energy binding between two separate RNA molecules,”
/>[10] J.Starmer,A M.Stomp,M.A.Vouk,andD.L.Bitzer,“Pre-
dicting Shine-Dalgarno sequence locations exposes genome
annotation errors,” PLoS Computational Biology, vol. 2, no. 5,
pp. 454–466, 2006.
[11] T. Xia, J. SantaLucia Jr., M. E. Burkard, et al., “Thermody-
namic parameters for an expanded nearest-neighbor model
for formation of RNA duplexes with Watson-Crick base pairs,”
Biochemistry, vol. 37, no. 42, pp. 14719–14735, 1998.
[12] J. A. Jaeger, D. H. Turner, and M. Zuker, “Improved pre-
dictions of secondary structures for RNA,” Proceedings of the
National Academy of Sciences of the United States of America,
vol. 86, no. 20, pp. 7706–7710, 1989.
[13] D. H. Mathews, J. Sabina, M. Zuker, and D. H. Turner, “Ex-
panded sequence dependence of thermodynamic parameters
improves prediction of RNA secondar y structure,” Journal of
Molecular Biology, vol. 288, no. 5, pp. 911–940, 1999.
[14] F. Schluenzen, A. Tocilj, R. Zarivach, et al., “Structure of func-
tionally activated small ribosomal subunit at 3.3 angstroms
resolution,” Cell, vol. 102, no. 5, pp. 615–623, 2000.
[15] G.Z.Yusupova,M.M.Yusupov,J.H.D.Cate,andH.F.Noller,
“The path of messenger RNA through the ribosome,” Cell,
vol. 106, no. 2, pp. 233–241, 2001.
[16] T. Schurr, E. Nadir, and H. Margalit, “Identification and char-
acterization of E.coli ribosomal binding sites by free energy
computation,” Nucleic Acids Research, vol. 21, no. 17, pp.
4019–4023, 1993.
[17] Y. Osada, R. Saito, and M. Tomita, “Analysis of base-pairing
potentials between 16S rRNA and 5
UTR for translation ini-
tiation in various prokaryotes,” Bioinformatics,vol.15,no.7-8,
pp. 578–581, 1999.
[18] T. A. Thanaraj and M. W. Pandit, “An additional ribosome-
binding site on mRNA of highly expressed genes and a bi-
functional site on the colicin fr a gment of 16S rRNA from
Escherichia coli: important determinants of the efficiency of
translation-initiation,” Nucleic Ac ids Research, vol. 17, no. 8,
pp. 2973–2985, 1989.
[19] G. Lithwick and H. Margalit, “Hierarchy of sequence-
dependent features associated with prokaryotic translation,”
Genome Research, vol. 13, no. 12, pp. 2665–2673, 2003.
[20] K. Lee, C. A. Holland-Staley, and P. R. Cunningham, “Genetic
analysis of the Shine-Dalgar n o interaction: selection of alter-
native functional mRNA-rRNA combinations,” RNA, vol. 2,
no. 12, pp. 1270–1285, 1996.
[21] A. V. Komarova, L. S. Tchufistova, E. V. Supina, and I. V. Boni,
“Extensive complementarity of the Shine-Dalgarno region and
3
-end of 16S rRNA is inefficient for translation in vivo,” Rus-
sian Journal of Bioorganic Chemistry, vol. 27, no. 4, pp. 248–
255, 2001.
[22] J. Ma, A. Campbell, and S. Karlin, “Correlations between
Shine-Dalgarno sequences and gene features such as predicted
expression levels and operon structures,” Journal of B acteriol-
ogy, vol. 184, no. 20, pp. 5733–5745, 2002.
[23] A. V. Oppenheim and R. W. Schafer, DigitalSignalProcessing,
Prentice-Hall, Englewood Cliffs, NJ, USA, 1st edition, 1975.
[24] P. J. Brockwell and R. A. Davis, Time Series: Theory and Meth-
ods, Springer, New York, NY, USA, 2nd edition, 1991.
[25] S. M. Kay, Fundamentals of Statistical Signal Processing, Vol. I:
Estimation Theory, Prentice-Hall, Englewood Cliffs, NJ, USA,
1993.
[26] J. C. Brocklebank and D. A. Dickey, SAS for Forecasting Time
Series, John Wiley & Sons, New York, NY, USA, 2nd edition,
2003.
[27] P.Lio,S.Ruffo, and M. Buiatti, “Third codon G+C periodicity
as a possible signal for an “Internal” selective constraint,” Jour-
nal of Theoretical Biology, vol. 171, no. 2, pp. 215–223, 1994.
[28] G. D’Onofrio and G. Bernardi, “A universal compositional
correlation among codon positions,” Gene, vol. 110, no. 1, pp.
81–88, 1992.
[29] G. Cocho and J. L. Rius, “Structural constraints and gene dy-
namics,” Rivista di Biologia - Biology Forum,vol.82,no.3-4,
pp. 344–345, 416–417, 1989.
[30] M. Gouy and C. Gautier, “Codon usage in bacteria: correlation
with gene expressivity,” Nucleic Acids Research, vol. 10, no. 22,
pp. 7055–7074, 1982.
Lalit Ponnala et al. 9
[31] E. N. Trifonov, “Translation framing code and frame-moni-
toring mechanism as suggested by the analysis of mRNA and
16S rRNA nucleotide sequences,” Journal of Molecular Biology,
vol. 194, no. 4, pp. 643–652, 1987.
[32] L. Ponnala, T. Barnes, D. L. Bitzer, M. A. Vouk, and A M.
Stomp, “A signal processing-based model for analyzing pro-
grammed frameshifts,” in Proceedings of IEEE International
Workshop on Genomic Signal Processing and Statistics (GEN-
SIPS ’05), Newport, RI, USA, May 2005.
Lalit Ponnala is currently a Ph.D. candi-
date in the Department of Electrical and
Computer Engineering at North Carolina
State University (NCSU), Raleigh, NC. He
obtained the M.S. degree in electrical en-
gineering from NCSU, in 2003, and the
B.Tech. degree in electronics and commu-
nication engineering from the National In-
stitute of Technology Karnataka (NITK),
Surathkal, India, in 2001. His research inter-
ests include systems biology, statistical signal processing, and con-
trol theory. He is currently using signal processing techniques to
model posttr anscriptional regulation in bacteria.
Anne-Marie Stomp received her B.S. and
M.S. degrees in biochemistry and biophys-
ics from the University of Connecticut and
the Ph.D. degree in botany from North
Carolina State University (NCSU), in 1973,
1981, and 1985, respectively. She is cur-
rently an Associate Professor in the Depart-
ment of Forestry at NCSU and is affiliated
with the NCSU Biotechnology Program. In
1998, she developed the first procedure to
genetically engineer duckweed, a common aquatic weed, to pro-
duce therapeutic proteins like insulin; and she launched Biolex Inc.,
the first plant biotechnology company from NC State. Her current
research is focused on continuing development of technologies to
enhance gene expression for protein and energy production.
Donald L. Bitzer received his Ph.D . degree
in electrical engineering from the Univer-
sity of Illinois, in 1960. He was Professor of
electrical and computer engineering at the
University of Illinois from 1960 to 1989. He
retired from the University of Illinois to be-
come a Distinguished University Research
Professor in the Computer Science Depart-
ment at North Carolina State University.
His work has involved applying signal pro-
cessing and coding theory to a variety of areas from radar signals
and speech processing to the development of software and hard-
ware required for large computer networks, and, more recently, to
look for genomic information that controls the translation process
in protein production. In 1967, he received the Industrial Research
100 Award; and in 1973, he received the prestigious Vladimir K.
Zworykin Award for outstanding achievement in the field of elec-
tronics applied in the service of mankind. He has been a Member
of the National Academy of Engineering since 1974. In 1982, he
was named Laureate of the Lincoln Academy by the State of Illinois
for contributions made “for the betterment of human endeavor.”
In 2002, he received the National Academy of Television Arts
and Sciences Emmy Award for his invention and development of
plasma displays.
Mladen A. Vouk received a Ph.D. degree
from King’s College, University of London,
the United Kingdom. He is the Department
Head and Professor of computer s cience
and the Associate Vice Provost for infor-
mation technology at North Carolina State
University, Raleigh. He has extensive expe-
rience in both commercial software produc-
tion and academic computing. He is the au-
thor/coauthor of over 180 publications. His
research and development interests include software engineering,
scientific computing (including application of engineering meth-
ods to genetics, bioinformatics, and biophysics), information tech-
nology, assisted education, and high-performance networks. He is
a Member, former Chairman, and former Secretary of the IFIP
Working Group 2.5 on Numerical Software, and a recipient of the
IFIP Silver Core Award. He is an IEEE Fellow, and a Member of
IEEE Reliability, Communications, Computer, and Education So-
cieties, and of the IEEE Technical Committee on Software Engi-
neering. He is a Member of ACM, ASQ, and Sigma Xi. He is an
Associate Editor of IEEE Transactions on Reliability, a Member of
the Editorial Board for the Journal of Computing and Information
Technology, and a Member of the Editorial Board for the Journal
of Parallel and Distributed Computing Practices.