Báo cáo hóa học: " Sector-Based Detection for Hands-Free Speech Enhancement in Cars" ppt
Bạn đang xem bản rút gọn của tài liệu. Xem và tải ngay bản đầy đủ của tài liệu tại đây (1.51 MB, 15 trang )
Hindawi Publishing Corporation
EURASIP Journal on Applied Signal Processing
Volume 2006, Article ID 20683, Pages 1–15
DOI 10.1155/ASP/2006/20683
Sector-Based Detection for Hands-Free
Speech Enhancement in Cars
Guillaume Lathoud,
1, 2
Julien Bourgeois,
3
and J
¨
urgen Freudenberger
3
1
IDIAP Research Institute, 1920 Martig ny, Switzerland
2
´
Ecole Polytechnique F
´
ed
´
erale de Lausanne (EPFL), 1015 Lausanne, Switzerland
3
DaimlerChrysler Research and Technology, 89014 Ulm, Germany
Received 31 January 2005; Revised 20 July 2005; Accepted 22 August 2005
Adaptation control of beamforming interference cancellation techniques is investigated for in-car speech acquisition. Two efficient
adaptation control methods are proposed that avoid target cancellation. The “implicit” method varies the step-size continuously,
based on the filtered output signal. The “explicit” method decides in a binary manner whether to adapt or not, based on a novel
estimate of target and interference energies. It estimates the average delay-sum power within a volume of space, for the same cost
as the classical delay-sum. Experiments on real in-car data validate both methods, including a case with 100 km/h background
road noise.
Copyright © 2006 Hindawi Publishing Corporation. All rights reserved.
1. INTRODUCTION
Speech-based command interfaces are becoming more and
more common in cars, for example in automatic dialog
systems for hands-free phone calls and navigation assis-
tance. The automatic speech recognition performance is cru-
cial, and can be greatly hampered by interferences such as
speech from a codr iver. Unfortunately, spontaneous multi-
party speech contains lots of overlaps between participants
[1].
A directional microphone oriented towards the driver
provides an immediate hardware enhancement by lowering
the energy level of the codriver interference. In the Mer-
cedes S320 setup used in this article, a 6 dB relative differ-
ence is achieved (value measured in the car). However, an
additional software improvement is required to fully cancel
the codriver’s interference, for example, with adaptive tech-
niques. They consist in a time-varying linear filter that en-
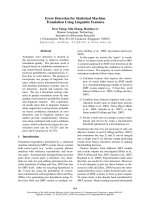
hances the signal-to-interference ratio (SIR), as depicted by
Figure 1.
Many beamforming algorithms have been proposed,
with various degrees of relevance in the car environment [2].
Apart from differential array designs, superdirective beam-
formers [3] derived from the minimum variance distortion-
less response principle (MVDR) apply well to our hardware
setup, such as the generalized sidelobe canceller (GSC) struc-
ture. The original adaptive versions assume a fixed, known
acoustic propagation channel. This is rarely the case in prac-
tice, so the target signal is reduced at the beamformer output.
Asolutionistoadapt,onlywhentheinterfererisdominant,
by varying the adaptation speed in a binary manner (explicit
control), or in a continuous manner (implicit control).
Existing explicit methods detect when the target is dom-
inant by thresholding an estimate of the input SIR,
SIR
in
(t),
or a related quantity. During those periods, adaptation is
stopped [4] or the acoustic channel is tracked [5, 6](and
related self-calibration algorithms [7]). Typically,
SIR
in
(t)
can be the ratio of the delay-and-sum beamformer and the
blocking matrix output powers [7–9]. If the blocking matrix
is adapted, as in [8], speaker detection errors are fed back
into the adapted parts and a single detection error may have
dramatical effects. Especially for simultaneous speakers, it is
more robust to decouple detection from adaptation [9, 10].
Most existing explicit methods rely on prior knowledge of the
target location only. There are few implicit methods, such as
[11], which varies the adaptation speed based on the input
signal itself.
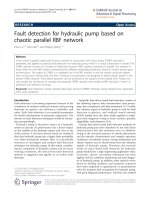
The contribution of this paper is twofold. First, an ex-
plicit method (Figure 2(a)) is proposed. It relies on a novel
input SIR estimate, which extends a previously proposed
sector-based frequency-domain detection and localization
technique [12]. Similarly to some multispeaker segmentation
works [13, 14], it uses phase information only. It introduces
the concept of phase domain met ric (PDM). It is closely re-
lated to delay-sum beamforming, averaged over a sector of
space, for no additional cost. Few works investigated input
2 EURASIP Journal on Applied Signal Processing
Emitted
signals
Captured
signal
Enhanced
signal
Directional
microphone
Target
s(t)
i(t)
0dB
–6 dB
Interference
x(t)
h(t)
adaptive
filtering
z(t)
Improvement
SIR
imp
(t) =
SIR
out
(t)
SIR
in
(t)
x(t)
= x
s
(t)+x
i
(t)
SIR
in
(t) =
σ
2
[x
s
(t)]
σ
2
[x
i
(t)]
z(t)
= z
s
(t)+z
i
(t)
SIR
out
(t) =
σ
2
[z
s
(t)]
σ
2
[z
i
(t)]
Figure 1: Entire acquisition process from emitted signals to the enhanced signal. This paper focuses on the adaptive filtering block h(t),
so that SIR
imp
(t) is maximized when the interference is active (interference cancellation). The s and t subscripts designate contributions of
target and interference, respectively. The whole process is supposed to be linear. σ
2
[x(t)] is the variance or energy of a speech signal x(t),
estimated on a short-time frame (20 or 30 millisecond) around t, on which stationarity and ergodicity are assumed.
(Binary decision)
Input SIR
SIR
in
(t)
estimation
x(t)
h(t) z(t)
(a) Proposed explicit approach.
(Continuous)
Step-size
control
x(t)
h(t)
z(t)
(b) Proposed implicit approach.
Figure 2: Proposed explicit and implicit adaptation control. x(t) = [x
1
(t) ···x
M
(t)]
T
are the signals captured by the M microphones, and
h(t)
= [h
1
(t) ···h
M
(t)]
T
are their associated filters. Double arrows denote multiple signals.
SIR estimation for nonstationary, wideband signals such as
speech. In [9, 15], spatial information of the target only is
used, represented as a single direction. On the contrary, the
proposed approach (1) defines spatial locations in terms of
sectors, (2) uses both target’s and interference’s spatial loca-
tion information. This is particularly relevant in the car envi-
ronment, where both locations are known, but only approx-
imately.
The second contribution is an implicit a daptation meth-
od, where the speed of adaptation (step-size) is determined
from the output signal z(t)(Figure 2(b)), with theoretically-
proven robustness to target cancellation issues. Estimation
of the input SIR is not needed, and there is no additional
computational cost.
Experiments on real in-car data validate both contribu-
tions on two setups: either 2 or 4 directional microphones.
In both cases, the sector-based method reliably estimates the
input SIR (
SIR
in
(t)). Both implicit and explicit approaches
improve the output SIR (SIR
out
(t)) in a robust manner, in-
cluding in 100 km/h background noise. The explicit control
yields the best results. Both adaptation methods are fit for
real-time processing.
The rest of this paper is organized as follows. Section 2
summarizes, extends, and interprets the recently proposed
[12] sector-based activity detection approach. Section 3 de-
scribes the two in-car setups and defines the sectors in each
case. Section 4 derives a novel sector-based technique for in-
put SIR estimation, based on Section 2, and validates it with
experiments. Section 5 describes both implicit and explicit
approaches and validates them with speech enhancement ex-
periments. Section 6 concludes. This paper is a detailed ver-
sion of an abstract presented in [16].
2. SECTOR-BASED FREQUENCY-DOMAIN
ACTIVITY DETECTION
This section extends the SAM-SPARSE audio source de-
tection and localization approach, previously proposed and
tested on multiparty speech in the meeting room context
[12]. The space around a microphone array is divided into
volumes called “sectors.” The frequency spectrum is also dis-
cretized into frequency bins. For each sector and each fre-
quency bin, we determine whether or not there is at least one
active audio source in the sector. This is done by comparing
measured phases between the various microphone pairs (a
vector of angle values) with a “centroid” for each sector (an-
other vector). A central feature of this work is the sparsity
assumption: within each frequency bin, at most one speech
source is supposed to be active. This simplification is sup-
ported by statistical analysis of real two-speaker speech sig-
nals [17 ], which shows that most of the time, within a given
frequency bin, one speech source is dominant in terms of en-
ergy and the other one is negligible.
Sections 2.1 and 2.2 generalize the SAM-SPARSE ap-
proach. An extension is proposed to allow for a “soft” de-
cision within each frequency bin, as opposed to the “hard
Guillaume Lathoud et al. 3
decision” taken in [12].Notethateachtimeframeispro-
cessed fully independently, without any temporal integra-
tion over consecutive frames. Section 2.3 gives a low-cost
implementation. Physical and topological interpretations are
found in Section 2.4 and Appendix A,respectively.
2.1. A Phase domain metric
First, a few notations are defined. All frequency domain
quantities are estimated through the discrete Fourier trans-
form (DFT) on short finite windows of samples (20 to 30
millisecond), on which speech signals can be approximated
as stationary.
M is the number of microphones. One time frame of
N
samples
multichannel samples is denoted by x
1
, , x
m
, ,
x
M
,withx
m
∈ R
N
samples
. The corresponding positive fre-
quency Fourier coefficients obtained through DFT are de-
noted by X
1
, , X
m
, , X
M
,withX
m
∈ C
N
bins
.
f
∈ N is a discrete f requency (1 ≤ f ≤ N
bins
), Re(·)
denotes the real part of a complex quantity, and
G
(p)
( f )is
the estimated frequency-domain cross-correlation for micro-
phone pair p (1
≤ p ≤ P):
G
(p)
( f )
def
= X
i
p
( f ) · X
∗
j
p
( f ), (1)
where (
·)
∗
denotes complex conjugate and i
p
and j
p
are in-
dices of the 2 microphones: 1
≤ i
p
<j
p
≤ M. Note that the
total number of microphone pairs is P
= M(M − 1)/2.
In all this work, the sector-based detection (and in par-
ticular, estimation of the cross-correlation
G
(p)
( f )) does not
use any time averaging between consecutive frames: each
frame is treated fully independently. This is consistent with
the work that we are building on [12], and avoids smoothing
parameters that would need to be tuned (e.g., forgetting fac-
tor). Experiments in Section 4.2 show that this is sufficient to
obtain a decent SIR estimate.
Phase values measured at frequency f are denoted:
Θ( f )
def
=
θ
(1)
( f ), ,
θ
(p)
( f ), ,
θ
(P)
( f )
T
where
θ
(p)
( f )
def
= ∠
G
(p)
( f ),
(2)
where ∠(
·) designates the argument of a complex value. The
distance between two such vectors, Θ
1
and Θ
2
in R
P
,isde-
fined as
d
Θ
1
, Θ
2
def
=
1
P
P
p=1
sin
2
θ
(p)
1
− θ
(p)
2
2
,(3)
d(
·, ·) is similar to the Euclidean metric, except for the sine,
which accounts for the “modulo 2π” definition of angles. The
1/P normalization factor ensures that 0
≤ d(·, ·) ≤ 1. Two
reasons motivate the use of sine, as opposed to a piecewise
linear function such as arg min
k
|θ
(p)
1
− θ
(p)
2
+ k2π|:
(i) the first reason is that d(
·, ·) is closely related to delay-
sum beamforming, as shown by Section 2.4;
e
jθ
3
e
jθ
2
e
jθ
1
Figure 3: Illustration of the triangular inequality for the PDM in
dimension 1: each point on the unit circle corresponds to an angle
value modulo 2π. From the Euclidean metric
|e
jθ
3
− e
jθ
1
|≤|e
jθ
3
−
e
jθ
2
| + |e
jθ
2
− e
jθ
1
|.
(ii) the second reason is that d
2
(·, ·) is infinitely derivable
in all points, and its derivates are simple to express.
This is not the case of “arg min.” It is related to par a m-
eter optimization work not presented here.
Topological interpretation
d(
·, ·) is a true PDM, as defined in Appendix A.1. This is
straightforward for P
= 1 by representing any angle θ with a
point e
jθ
on the unit circle, as in Figure 3, and observing that
|e
jθ
1
−e
jθ
2
|=2|sin((θ
1
− θ
2
)/2)|=2d(θ
1
, θ
2
). Appendix A.2
proves it for higher dimensions P>1.
2.2. From metric to activity: SAM-SPARSE-MEAN
The search space around the microphone array is partitioned
into N
S
connected volumes called “sectors,” as in [12, 18]. For
example, the space around a horizontal circular microphone
array c an be partitioned in “pie slices.” The SAM-SPARSE-
MEAN approach treats each frequency bin separately. Thus,
a parallel implementation is straightforward.
For each (sector, frequency bin), it defines and estimates
a sector activity measure (SAM), which is a posterior proba-
bility that at least one audio source is active within that sec-
tor and that frequency bin. “SPARSE” stands for the sparsity
assumption that was discussed above: at most one sector is
active per frequency bin. It was shown in [12]tobebothnec-
essary and efficient to solve spatial leakage problems.
Note that only phase information is used, but not the
magnitude information. This choice is inspired by (1) the
GCC-PHAT weighting [19 ], which is well adapted to rever-
berant environments, and (2) the fact that interaural level
difference (ILD) is in practice much less reliable than time-
delays, as far as localization is concerned. In fact, ILD is
mostly useful in the case of binaural analysis [20].
SAM-SPARSE-MEAN is composed of two steps.
(i) The first step is to compute the root mean-square dis-
tance (“MEAN”) between the measured phase vector
Θ( f ) and theoretical phase vectors associated with all
points within a given sector S
k
,atagivenfrequency f ,
4 EURASIP Journal on Applied Signal Processing
using the metric defined in (3):
D
k, f
def
=
v∈S
k
d
2
Θ( f ), Γ(v, f )
P
k
(v)dv
1/2
,(4)
where
Γ(v, f )
= [γ
(1)
(v, f ), , γ
(p)
(v, f ), , γ
(P)
(v, f )]
T
(5)
is the vector of theoretical phases associated with loca-
tion v and frequency f and P
k
(v) is a weighting term.
P
k
(v) is the prior knowledge of the distribution of ac-
tive source locations within sector S
k
(e.g., uniform or
Gaussian distribution). v can be expressed in any co-
ordinate system (Euclidean or spherical) as long as the
expression of dv is consistent with this choice. Each
component of the Γ vector is given by
γ
(p)
(v, f ) = π
f
N
bins
τ
(p)
(v), (6)
where τ
(p)
(v) is the theoretical time-delay (in samples)
associated with spatial location v
∈ R
3
and micro-
phone pair p. τ
(p)
(v)isgivenby
τ
(p)
(v) =
f
s
c
v −m
(p)
2
−
v −m
(p)
1
,(7)
where c is the speed of sound in the air (e.g., 342 m/s
at 18 degrees Celsius), f
s
is the sampling frequency in
Hz and m
(p)
1
and m
(p)
2
∈ R
3
are spatial locations of
microphone pair p.
(ii) The second step is to determine, for each frequency bin
f , the sector to which the measured phase vector is the
closest:
k
min
( f )
def
= arg min
k
D
k, f
. (8)
This decision does not require any threshold. Finally, the pos-
terior probability of having at least one active source in sector
S
k
min
( f )
and at frequency f is modeled with
P
sector S
k
min
( f )
active at frequency f |
Θ( f )
=
e
−λ(D
k
min
( f ), f
)
2
,
(9)
where λ controls how “soft” or “hard” this decision should
be. The sparsity assumption implies that all other sectors are
attributed a zero posterior probability of containing activity
at frequency f :
∀k=k
min
( f ) P
sector S
k
active at frequency f |
Θ( f )
=
0.
(10)
In previous work [12], only “hard” decisions were taken
(λ
= 0) and the entire spec trum was supposed to be ac-
tive, which lead to attribution of inactive frequencies to ran-
dom sectors. Equation (9) represents a generalization (λ>0)
that allows to detect inactivity at a given frequency and thus
avoids the random effect. For example, in the case of a sin-
gle microphone pair P
= 1, for λ = 10, any phase difference
between θ
1
and θ
2
larger than about π/3givesaprobability
of activity e
−λd
2
(θ
1
,θ
2
)
less than 0.1. λ can be tuned on some
(small) development data, as in Section 4.2.Analternative
can be found in [21].
2.3. Practical implementation
In general, it is not possible to derive an analytical solution
for (4). It is therefore approximated with a discrete summa-
tion:
D
k, f
≈
D
k, f
,where
D
k, f
def
=
1
N
N
n=1
d
2
Θ( f ), Γ
v
k,n
, f
,
(11)
where v
k,1
, , v
k,n
, , v
k,N
are locations in space (R
3
)drawn
from the prior distribution P
k
(v)andN is the number of
locations used to approximate this continuous distribution.
The sampling is not necessarily random, for example, a reg-
ular grid for a uniform distribution.
The rest of this section expresses this approximation in a
manner that does not depend on the number of points N.
D
k, f
2
=
1
N
N
n=1
1
P
P
p=1
sin
2
θ
(p)
( f ) − γ
(p)
v
k,n
, f
2
.
(12)
Using the relation sin
2
u = (1/2)(1 − cos 2u), we can write
D
k, f
2
=
1
2P
P
p=1
1 −
1
N
N
n=1
cos
θ
(p)
( f ) − γ
(p)
v
k,n
, f
,
D
k, f
2
=
1
2P
P
p=1
1 − Re
1
N
N
n=1
e
j(
θ
(p)
( f )−γ
(p)
(v
k,n
, f ))
,
D
k, f
2
=
1
2P
P
p=1
1 − Re
e
j
θ
(p)
( f )
1
N
N
n=1
e
−jγ
(p)
(v
k,n
, f )
,
D
k, f
2
=
1
2P
P
p=1
1 − Re
e
j
θ
(p)
( f )
A
(p)
k
( f )e
−jB
(p)
k
( f )
,
D
k, f
2
=
1
2P
P
p=1
1 − A
(p)
k
( f )cos
θ
(p)
( f ) − B
(p)
k
( f )
,
(13)
where A
(p)
k
( f )andB
(p)
k
( f ) are two values in R that do not
depend on the measured phase
θ
(p)
( f ):
A
(p)
k
( f )
def
=
Z
(p)
k
( f )
, B
(p)
k
( f )
def
= ∠Z
(p)
k
( f ),
Z
(p)
k
( f )
def
=
1
N
N
n=1
e
jγ
(p)
(v
k,n
, f )
.
(14)
Hence, the approximation is wholly contained in the A
and B parameters, which need to be computed only once.
Any large number N can be used, so the approximation
D
k, f
canbeasclosetoD
k, f
as desired. During runtime, the
cost of computing
D
k, f
does not depend on N: it is directly
proportional to P, which is the same cost as for a point-
based measure d(
·, ·). Thus, the proposed approach (D
k, f
)
does not suffer from its practical implementation (
D
k, f
)con-
cerning both numerical precision and computational com-
plexity. Note that each Z
(p)
k
( f ) value is nothing but a com-
ponent of the average theoretical cross-correlation matrix
Guillaume Lathoud et al. 5
over all points v
k,n
for n = 1, , N. A complete Matlab
implementation can be downloaded at: ap
.ch/lathoud/2005-SAM-SPARSE-MEAN.
The SAM-SPARSE-C method defined in a previous work
[12] is strictly equivalent to a modification of
D
k, f
, where all
A
(p)
k
( f ) parameters would be replaced with 1.
2.4. Physical interpretation
This section shows that for a given triplet (sector, frequency
bin, pair of microphones), if we neglect the energy difference
between microphones, the PDM proposed by (4)isequiva-
lent to the delay-sum power averaged over all points in the
sector.
First, let us consider a point location v
∈ R
3
, a pair of
microphones (m
(p)
1
, m
(p)
2
), and a frequency f .Infrequency
domain, the received signals are:
X
i
p
( f )
def
= α
(p)
1
( f )e
jβ
(p)
1
( f )
, X
j
p
( f )
def
= α
(p)
2
( f )e
jβ
(p)
2
( f )
,
(15)
where for each microphone m
= 1, , M, α
m
( f )andβ
m
( f )
are real-valued, respectively, magnitude and phase of the re-
ceived signal X
m
( f ). The observed phase is
θ
(p)
( f ) ≡ β
(p)
1
( f ) − β
(p)
2
( f ), (16)
where the
≡ symbol denotes congruence of angles (equality
modulo 2π).
The delay-sum energy for location v,microphonepairp
and frequency f , is defined by aligning the two signals, with
respect to the theoretical phase γ
(p)
(v, f ):
E
(p)
ds
(v, f )
def
=
X
i
p
( f )+X
j
p
( f )e
jγ
(p)
(v, f )
2
. (17)
Assuming the received magnitudes to be the same α
i
p
≈
α
j
p
≈ α,(17) can be rewritten:
E
(p)
ds
(v, f ) =
αe
jβ
(p)
1
( f )
1+e
j(−
θ
(p)
( f )+γ
(p)
(v, f ))
2
= α
2
1+cos
−
θ
(p)
( f )+γ
(p)
(v, f )
2
+sin
2
−
θ
(p)
( f )+γ
(p)
(v, f )
=
α
2
2+2cos
−
θ
(p)
( f )+γ
(p)
(v, f )
.
(18)
On the other hand, the square distance between observed
phase and theoretical phase, as defined by (3), is expressed as
d
2
θ
(p)
( f ), γ
(p)
(v, f )
def
= sin
2
θ
(p)
( f ) − γ
(p)
(v, f )
2
(19)
=
1
2
1 − cos
θ
(p)
( f ) − γ
(p)
(v, f )
.
(20)
From (18)and(20),
1
4α
2
E
(p)
ds
(v, f ) = 1 − d
2
θ
(p)
( f ), γ
(p)
(v, f )
. (21)
Thus, for a given microphone pair, (1) maximizing the delay-
sum power is strictly equivalent to minimizing the PDM,
(2) comparing delay-sum powers is strictly equivalent to
comparing PDMs. This equivalence still holds when averag-
ing over an entire sector, as in (4). Averaging across micro-
phone pairs, as in (3), exploits the redundancy of the signals
in order to deal with noisy measurements and get around
spatial aliasing effects.
The proposed approach is thus equivalent to an aver-
age delay-sum over a sector, which differs from a classi-
cal approach that would compute the delay-sum only at a
point in the middle of the sector. For sector-based detec-
tion, the former is intuitively more sound because it incor-
porates the prior knowledge that the audio source may be
anywhere within a sector. On the contrary, the classical p oint-
based approach tries to address a sector-based task without
this knowledge; thus, errors can be expected when an audio
source is located far from any of the middle points. The ad-
vantage of the sector-based approach was confirmed by tests
on more than one hour of real meeting room data [12]. The
computational cost is the same, as shown by Section 2.3.
The assumption α
i
p
≈ α
j
p
is reasonable for most setups,
where microphones are close to each other and, if directional,
oriented to the same direction. Nevertheless, in practice, the
proposed method can also be applied to other cases, as in
Setup I, described in Section 3.1.
3. PHYSICAL SETUPS, RECORDINGS,
AND SECTOR DEFINITION
The rest of this paper considers two setups for acquisition of
the driver’s speech in a car. The general problem is to sepa-
rate speech of the driver from interferences such as codriver
speech.
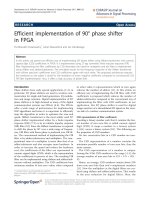
3.1. Physical setups
Figure 4 depicts the two setups, denoted I and II.
Setup I has 2 directional microphones on the ceiling, sep-
arated by 17 cm. They point to different directions: driver
and codriver, respectively .
Setup II has 4 directional microphones in the rear-view
mirror, placed on the same line with an interval of 5 cm. All
of them point towards the driver.
3.2. Recordings
Data was not simulated, we opted for real data instead. Three
10-seconds long recordings sampled at 16 kHz, made in a
Mercedes S320 vehicle, are used in experiments reported in
Sections 4.2, 5.5,and5.6
Train: mannequins playing prerecorded speech. Parameter
values are selected on this data.
6 EURASIP Journal on Applied Signal Processing
Driver (target)
Codriver (interference)
I
II
x
1
x
2
x
1
x
2
x
3
x
4
Figure 4: Physical Setups I (2 mics) and II (4 mics).
Test: real human speakers, used for testing only: all param-
eters determined on tr ain were “frozen.”
Noise: both persons silent, the car running at 100 km/h.
For both train and test, we first recorded the driver, then
the codriver, and added the two waveforms. Having separate
recordings for driver and codriver permits to compute the
true input SIR at microphone x
1
, as the ratio between the
instantaneous frame energies of each signal. The tru e input
SIR is the reference for evaluations presented in Sections 4
and 5.
The noise waveform is then added to repeat speech en-
hancement experiments in a noisy environment, as reported
in Section 5.6.
3.3. Sector definition
Figures 5(a) and 5(b) depict the way we defined sectors for
each setup. We used prior knowledge of the locations of the
driver and the codriver with respect to the microphones. The
prior distribution P
k
(v)(definedinSection 2.2)waschosen
to be a Gaussian in Euclidean coordinates, for the 2 sectors
where the people are, and uniform in polar coordinates for
the other sectors (P
k
(v) ∝v
−1
). Each distribution was ap-
proximated with N
= 400 points.
The motivation for using Gaussian distr ibutions is that
we know where the people are on average, and we allow
slight motion around the average location. The other sectors
have uniform distributions because reverberations may come
from any of those directions.
4. INPUT SIR ESTIMATION
This section describes a method to estimate the input SIR
SIR
in
(t), which is the ratio between driver and codriver ener-
gies in signal x
1
(t) (see Figure 1). It relies on SAM-SPARSE-
MEAN, defined in Section 2.2, and it is used by the “explicit”
adaptation control method described in Section 5.2. As dis-
cussed in introduction, it is novel, and a priori well adapted
to the car environment, as it uses approximate knowledge of
both driver and codriver locations.
4.1. Method
From a given frame of samples at microphone 1,
x
1
(t) =
x
1
t −N
samples
, x
1
t −N
samples
+1
, , x
1
(t)
T
.
(22)
DFT is applied to estimate the local spectral representation
X
1
∈ C
N
bins
. T he energy spect rum for this frame is then de-
fined by E
1
( f ) =|X
1
( f )|
2
,for1≤ f ≤ N
bins
.
In order to estimate the input SIR, we propose to estimate
the proportion of the overall frame energy
f
E
1
( f ) that be-
longs to the driver and to the codriver, respectively. Then the
input SIR is estimated as the ratio between the two. Within
the sparsity assumption context of Section 2, the following
two estimates are proposed:
SIR
1
def
=
f
E
1
( f )·P
sector S
driver
active at frequency f |
Θ( f )
f
E
1
( f )·P
sector S
codriver
active at frequency f |
Θ( f )
,
SIR
2
def
=
f
P
sector S
driver
active at frequency f |
Θ( f )
f
P
sector S
codriver
active at frequency f |
Θ( f )
,
(23)
where P(
·|Θ( f )) is the posterior probability given by (9)
and (10). Both
SIR
1
and
SIR
2
are a ratio between two math-
ematical expectations over the whole spectrum.
SIR
1
weights
each frequency with its energy, while
SIR
2
weights all fre-
quencies equally. In the case of a speech spectrum, which is
wideband but has most of its energy in low frequencies, this
means that
SIR
1
gives more weights to the low frequencies,
while
SIR
2
gives equal weights to low and high frequencies.
From this point of view, it can be expected that
SIR
2
pro-
vides better results as long as microphones are close enough
to avoid spatial aliasing effects.
Note that
SIR
2
seems less adequate than
SIR
1
in theory: it
is a ratio of numbers of frequency bins, while the quantity to
estimate is a ratio of energies. However, in practice, it follows
the same trend as the input SIR: due to the wideband nature
of speech, whenever the target is louder than the interference,
there will be more frequency bins where it is dominant, and
vice-versa. This is supported by experimental evidence in the
meeting room domain [12]. To conclude, we can expect a
biased relationship between
SIR
2
and the true input SIR, that
needs to be compensated (see the next section).
4.2. Experiments
On the entire recording train, we ran the source detection al-
gorithm described in Section 2 and compared the estimates
SIR
1
or
SIR
2
with the true input SIR, which is defined in
Section 3.2.
First, we noted that an additional affine scaling in log do-
main (fit of a first order polynomial) was needed. It consists
in choosing two parameters Q
0
, Q
1
that are used to correct
Guillaume Lathoud et al. 7
Table 1: RMS error of input SIR estimation calculated in log domain (dB). Percentages indicate the r atio between RMS error and the
dynamic range of the true input SIR (max-min). Values in brackets indicate the correlation between true and estimated input SIR.
(a) Results on train. The best result for each setup is in bold face.
Setup Dynamic Method Hard decision Soft decision
range (λ
= 0) (λ>0)
I(2mics) 87.8dB
SIR
1
10.5% (0.90) λ = 12.8: 10.2% (0.91)
SIR
2
16.0% (0.75) λ = 22.7: 12.5% (0.86)
II (4 mics) 88.0dB
SIR
1
12.0% (0.86) (λ = 0)
SIR
2
13.1% (0.83) λ = 10.7: 11.2%(0.89)
(b) Results on test and test + noise. Methods and parameters were selected on train.
Setup Dynamic Method Results on test
range clean test+ noise
I71.6dB
SIR
1
, soft All frames 14.0% (0.77) 15.1% (0.73)
True input SIR > 6dB 16.1% (0.25) 17.8% (0.27)
True input SIR <
−6dB 12.4% (0.71) 16.3% (0.63)
II 70.2dB
SIR
2
, soft All frames 9.3% (0.90) 11.4% (0.84)
(a) Setup I.
0
0.5
(Meters)
−0.6 −0.4 −0.20 0.20.40.6
(Meters)
S
3
:codriver S
1
:driver
S
3
S
1
S
2
X
2
X
1
Microphones
(b) Setup II.
0
0.5
1
(Meters)
−0.6 −0.4 −0.20 0.20.40.6
(Meters)
S
4
:codriver S
2
:driver
S
1
S
2
S
3
S
4
S
5
X
4
X
1
Microphones
Figure 5: Sector definition. Each dot corresponds to a v
k,n
location,asdefinedinSection 2.3.
the SIR estimate: Q
1
· log
SIR + Q
0
. It compensates for the
simplicity of the function chosen for probability estimation
(9), as well as a bias in the case of
SIR
2
.Thisaffine scaling
is the only post-processing that we used: temporal filtering
(smoothing), as well as calibration of the average signal lev-
els, were not used. For each setup and each method, we tuned
the 3 parameters (λ, Q
0
, Q
1
) on train in order to minimize
the RMS error of input SIR estimation, in log domain (dB).
Results are reported in Tabl e 1a. In all cases, an RMS error of
about 10 dB is obtained, and soft decision (λ>0) is benefi-
cial. In Setup I,
SIR
1
gives the best results. In Setup II,
SIR
2
gives the best results. This confirms the above-mentioned ex-
pectation that
SIR
2
yields better results when microphones
are close enough. For both setups, the correlation between
true SIR and estimated SIR is about 0.9.
For each setup, a time plot of the results of the best
method is available, see Figures 6(a) and 6(b).Theestimate
follows the true value very accurately most of the time. Er-
rors happen sometimes when the true input SIR is high. One
possible explanation is the directionality of the microphones,
which is not exploited by the sector-based detection algo-
rithm. Also the sector-based detection gives equal role to all
microphones, while we are mostly interested in x
1
(t). In spite
of these limitations, we can safely state that the obtained SIR
curve is very satisfying for triggering the adaptation, as veri-
fied in Section 5.
As it is not sufficient to evaluate results on the same data
that was used to tune the 3 parameters (λ, Q
0
, Q
1
), results
on the test recording are also reported in Table 1bandFig-
ures 6(c) and 6(d) . Overall, all conclusions made on train
still hold on test, which tends to prove that the proposed
approach is not too dependent on the training data. How-
ever, for Setup I, a degradation is observed, mostly on regions
with high input SIR, possibly because of the low coherence
8 EURASIP Journal on Applied Signal Processing
(a)
−50
0
50
Input SIR (dB)
00.511.522.53
Time (s)
Tru e
sir db
Sir1
soft db
Tra in Se tup I (be st met hod )
(b)
−50
0
50
Input SIR (dB)
00.511.522.53
Time (s)
Tru e
sir db
Sir2
soft db
Train Setup II (best method)
(c)
−40
−30
−20
−10
0
10
20
30
40
Input SIR (dB)
00.511.522.53
Time (s)
Tru e
sir db
Sir1
soft db
TestSetupI(bestmethodon“train”)
(d)
−40
−30
−20
−10
0
10
20
30
40
Input SIR (dB)
00.511.522.53
Time (s)
Tru e
sir db
Sir2
soft db
Test Setup II (best method on “train”)
(e)
−40
−30
−20
−10
0
10
20
30
40
Input SIR (dB)
00.511.522.53
Time (s)
Tru e
sir db
Sir1
soft db
Test+noise Setup I (best method on “Train”)
(f)
−40
−30
−20
−10
0
10
20
30
40
Input SIR (dB)
00.511.522.53
Time (s)
Tru e
sir db
Sir2
soft db
Test+noise Setup II (best method on “Train”)
Figure 6: Estimation of the input SIR for Setups I (left column) and II (right column). Beginning of recordings train (top row), test (middle
row), and test + noise (bottom row).
Guillaume Lathoud et al. 9
s
1
(t)
s
2
(t)
δ
h
21
h
12
δ
x
1
(t)
x
2
(t)
(a) Setup I: mixing channels.
x
1
x
2
h
z
(b) Setup I: noise can-
celler.
W
0
b
m
a
m
x
m
y
(bm)
m
z
(c) Setup II: GSC.
Figure 7: Linear models for the acoustic channels and the adaptive filtering.
between the two directional microphones, due to their very
different orientations. However, an interference cancellation
application with Setup I mostly needs accurate detection of
periods, of negative input SIR rather than positive input SIR.
On those periods the RMS error is lower (12.4%). Section 5
confirms the effectiveness of this approach in a speech en-
hancement application. For Setup II, the results are quite
similar to those of train.
Results in 100 km/h noise (test + noise) are also reported
in Table 1b and Figures 6(e) and 6(f). The parameter values
are the same as in the clean case. The curves and the relative
RMS error values show that the resulting estimate is more
noisy, but still follows the true input SIR quite closely in av-
erage, and correlation is still high. The estimated ratio still
seems accurate enough for adaptation control in noise, as
confirmed by Section 5.6. This can be contrasted with the
fact that car noise violates the sparsity assumption with re-
spect to speech. A possible explanation is that in (23), numer-
ator and denominator are equally affected, so that the ratio is
not biased too much by the presence of noise.
To conclude, the proposed methodology for input SIR
estimation gives acceptable results, including in noise. The
estimated input SIR curve follows the true curve accurately
enough to detect periods of activity and inactivity of the
driver and codriver. With respect to that application, only
one parameter is used: λ, and the affine scaling (Q
0
, Q
1
)has
no impact on results presented in Section 5. This method is
particularly robust since it does not need any thresholding or
temporal integration over consecutive frames.
5. SPEECH ENHANCEMENT
5.1. Adaptive interference cancellation algorithms
Setup I provides an input SIR of about 6 dB in the driver’s
microphone signal x
1
(t). An estimate of the interference s ig-
nal is given by x
2
(t). Interference removal is attempted with
the linear filter
h of length L depicted by Figure 7(b),which
is adapted to minimize the output power E
{z
2
(t)}, using the
NLMS algorithm [22] with step size μ:
h(t +1)=
h(t) −μ
E
z(t)x
2
(t)
x
2
(t)
2
, (24)
where x
2
(t) = [x
2
(t), x
2
(t − 1), , x
2
(t − L +1)]
T
,
h(t) =
[
h
0
(t),
h
1
(t), ,
h
L−1
(t)]
T
, x
2
=
L
i=1
x
2
(i), and E{·} de-
notes expectation, taken over realizations of stochastic pro-
cesses (see Section 5.3 for its implementation).
To prevent instability, adaptation of
h must happen only
when the interference is active:
x
2
(t)
2
= 0,whichisas-
sumed true in the rest of this section. In practice, a fixed
threshold on the variance of x
2
(t)canbeused.
To prevent target cancellation, adaptation of
h must hap-
pen only when the interference is active and dominant.
In Setup II, M
= 4 directional microphones are in the
rear-view mirror, all pointing at the target. It is therefore not
possible to use any of them as an estimate of the codriver
interference signal. A suitable approach is the linearly con-
strained minimum variance beamforming [23] and its ro-
bust GSC implementation [24]. It consists of two filters b
m
and a
m
for each input signal x
m
(t), with m = 1, , M,as
depicted by Figure 7(c).Eachfilterb
m
(resp., a
m
)isadapted
to minimize the output power of y
(b
m
)
m
(t)(resp.,z(t)), as in
(24). To prevent leakage problems, the b
m
(resp., a
m
) filters
must be adapted only when the target (resp., interference) is
active and dominant.
5.2. Implicit and explicit adaptation control
For both setups, an adaptation control is required that slows
down or stops the adaptation according to target and in-
terference activ ity. Two methods are proposed: “implicit”
and “explicit.” The implicit method introduces a continuous,
adaptive step-size μ(t), whereas the explicit method relies on
a binary decision, whether to adapt or not.
Implicit method
We present the method in details for Setup I. They also apply
to Setup II, as described in Section 5.3. The goal is to increase
the adaptation step-size whenever possible, while not turn-
ing (24) into an unstable divergent process. With respect to
existing implicit approaches, the novelty is a well-grounded
mechanism to prevent instability while using the filtered out-
put.
10 EURASIP Journal on Applied Signal Processing
For Setup I, as depicted by Figure 7(a), the acoustic mix-
ing channels are modelled as
x
1
(t) = s
1
(t)+h
12
(t) ∗s
2
(t),
x
2
(t) = h
21
(t) ∗s
1
(t)+s
2
(t),
(25)
where
∗ denotes the convolution operator.
As depicted by Figure 7(b), the enhanced signal is z(t)
=
x
1
(t)+
h(t) ∗x
2
(t), therefore,
z(t)
=
δ(t)+
h(t) ∗h
21
(t)
∗
s
1
(t)+
h
12
(t)+
h(t)
∗
s
2
(t)
= Ω(t) ∗ s
1
(t)+Π(t) ∗ s
2
(t).
(26)
The goal is to minimize E
{ε
2
(t)},whereε(t) = Π(t) ∗
s
2
(t). It can be shown [25] that when s
1
(t) = 0, an optimal
step-size is given by μ
impl
(t) = E{ε
2
(t)}/E{z
2
(t)}.
We assume s
2
to be a white excitation signal, then,
μ
impl
(t) = E
Π
2
(t)
E
x
2
2
(t)
E
z
2
(t)
=
E
Π
2
(t)
x
2
2
z
2
. (27)
Note
Under stationarity and ergodicity assumptions, E
{·} is im-
plemented by averaging on a short time-frame:
E
{x
2
(t)}=(1/L)x
2
. (28)
As E
{Π(t)
2
} is unknown, we approximate it with a very
small positive constant (0 <μ
0
1) close to the system
mismatch expected when close to conve rgence:
μ
impl
(t) ≈ μ
0
x
2
2
z
2
, (29)
and (24)becomes
h(t +1)=
h(t) −μ
0
E
z(t)x
2
(t)
z(t)
2
. (30)
The domain of stability of the NLMS algorithm [22]is
defined by μ
impl
(t) < 2, therefore (30) can only be applied
when μ
0
(x
2
2
/z
2
) < 2. In other cases, a fixed step-size
adaptation must be used as in (24). The proposed implicit
adaptive step-size is therefore
μ(t)
=
⎧
⎨
⎩
μ
impl
(t)ifμ
impl
(t) < 2 (stable case),
μ
0
otherwise (unstable case),
0 <μ
0
1 is a small constant.
(31)
This effectively reduces the step-size w hen the current target
power estimate is large and conversely it adapts faster in ab-
sence of the target.
Physical interpretation
Let us assume that s
1
(t)ands
2
(t) are uncorrelated blockwise
stationary white sources of powers σ
2
1
and σ
2
2
,respectively.
From (25)and(26), we can expand (29) into
μ
impl
(t) = μ
0
h
21
2
σ
2
1
+ σ
2
2
Ω(t)
2
σ
2
1
+
Π(t)
2
σ
2
2
. (32)
In a car, the driver is closer to x
1
than to x
2
. Thus, given
the definition of the mixing channels depicted by Figure 7(a),
it is reasonable to assume that
h
21
< 1, h
21
is causal, and
h
21
(0) = 0. Therefore Ω(t)≥1.
Case 1. The power received at microphone 2, from the tar-
get, is greater than the power received from the interference:
h
21
2
σ
2
1
>σ
2
2
. In this case, (32) yields
μ
impl
(t) <μ
0
2
h
21
2
σ
2
1
Ω(t)
2
σ
2
1
+
Π(t)
2
σ
2
2
< 2μ
0
h
21
2
Ω(t)
2
< 2,
(33)
which falls in the “stable case” of (31).
Case 2. The power received at microphone 2, from the tar-
get, is less than the power received from the interference:
h
21
2
σ
2
1
≤ σ
2
2
. In this case, (32) yields
μ
impl
(t) ≤ μ
0
2σ
2
2
Ω(t)
2
σ
2
1
+
Π(t)
2
σ
2
2
, (34)
therefore,
Ω(t)
2
σ
2
1
σ
2
2
+
Π(t)
2
≤ 2
μ
0
μ
impl
(t)
. (35)
Thus, in the “unstable case” of (31), we have
Π(t)
2
≤ μ
0
,
σ
2
1
σ
2
2
≤
μ
0
Ω(t)
2
≤ μ
0
.
(36)
The first line of (36) means that the adaptation is close
to convergence. The second l ine of (36) means that the input
SIR is very close to zero, that is, the interference is largely
dominant. Overall, this is the only “unstable case,” that is,
when we fall back on μ
impl
(t) = μ
0
(31).
Explicit method
For both setups, the sector-based method described in
Section 4 is used to directly estimate the input SIR at x
1
(t).
Two thresholds are set to detect when the target (resp., the
interference) is dominant, which determines whether or not
the fixed step-size adaptation of (24) should be applied.
5.3. Implementation details
In Setup I, the
h filter has length L = 256. In Setup II, the
b
m
filters have length L = 64 and the a
m
filters have length
L
= 128.
Guillaume Lathoud et al. 11
For a ll methods, the filters are initialized as follows. In
Setup I, filter
h is initialized to zeros. In Setup II, filters b
m
are
initialized to cancel signals coming from driver’s direction of
arrival [23], and the filters a
m
are initialized to zeros.
Adaptation is implemented as follows
(i) No control: a baseline method that adapts all the time,
with a constant step size, as in (24). In Setup II, fil-
ters a
m
are adapted all the time and filters b
m
are not
adapted.
(ii) Implicit method: in both setups, all filters are adapted
all the time, with the adaptive step-size of (31). In
Setup II, the tunable constant parameter μ
0
was found
to be larger for a
m
(0.01) than for b
m
(0.0001).
(iii) Explicit method: all filters are adapted with (24). In
Setup I, filter
h is adapted only when the estimated
input SIR is below a threshold. In Setup II, filter a
m
(resp., b
m
) is adapted only when the estimated input
SIR is below (resp., above) a threshold.
Note on (24)and(30): in the original NLMS algorithm
[22], the instantaneous estimate E
{z(t)x
2
(t)}≈z(t)x
2
(t)
is used and filter coefficients are updated ever y sample.
In this work, in order to reduce computational load, fil-
ter coefficients are updated only once every K sample, and
E
{z(t)x
2
(t)} is estimated by averaging the K instantaneous
estimates (K
= 64, 4 millisecond for f
s
= 16 kHz). The under-
lying assumption is that signals are stationary and ergodic
within the current block. See [26] for a sample-by-sample
study.
5.4. Performance evaluation
For both setups, we measured the instantaneous SIR im-
provement on the real 16 kHz recordings, with respect to the
output when no adaptation is performed. Thus, the refer-
ence in Setup I is the true input SIR at microphone x
1
,and
the reference in Setup II is the SIR at the output of the delay-
and-sum beamformer W
0
. “Instantaneous” means on half-
overlapping short time-frames—that is, where speech can
be safely considered as stationary. We used 32 millisecond-
long time-frames. Section 3.2 describes the recordings and
the method of computation of the true input SIR.
Five seconds of the train recording were used to tune
all parameters. Then the entire test recording (real human
speakers, 10 seconds) was used to test the methods. It con-
tains a significant degree of overlap between the two speakers
(56% of speech frames).
Based on the instantaneous SIR improvement, the seg-
mental SIR improvement is computed in three cases: the
true input SIR is low, close to 1, or high. “Segmental” means
that only frames containing speech from either driver or co-
driver or both are considered. This in turns assumes a reliable
marking of speech frames and silence frames in the recording
of each person.
For a given person, marking speech frames by hand is
questionable, as it may well introduce a bias in the evaluation
(silence marked as speech and vice-versa). Another possibil-
ity was to set a fixed threshold on the frame energy, but then
again, it is not clear how to select a value for the threshold
without introducing a bias in the evaluation.
Finally, we opted for an unsupervised approach: for each
person, a bi-Gaussian model was fitted on the log energy,
using the EM algorithm [27]. The Gaussian with the lowest
(resp., highest) mean is expected to capture the silent (resp.,
speech) frames. The resulting posterior probability of speech
is an almost binary value, so that a threshold can be easily set
(e.g., 0.5 or 0.9) without much impact on the resulting clas-
sification into speech fra mes and silent frames. This way, we
attempt to minimize the bias of the performance evaluation.
Below is a description of the 3 cases that were evaluated.
(i) True input SIR <
−6 dB: when the energy of the co-
driver is dominant in signal x
1
. This quantifies how
much of the interference signal is cancelled during si-
lences of the driver: a significantly positive value. All
three methods can be expected to perform well in this
case.
(ii) True input SIR in [
−6 + 6] dB: when both driver and
codriver are comparatively active. This quantifies how
much of the interference signal is cancelled during
overlap periods (both persons speaking): a positive
value. We can expect a slight degra dation in the case
of the baseline method, because of leakage issues.
(iii) True input SIR > +6 dB: when the energy of the driver
is dominant in signal x
1
. No improvement is expected
here: a value around zero. If this value is markedly neg-
ative, it means that a g iven method is suffering from
leakage issues—as expected for the baseline method.
5.5. Experiments: clean data
The first 3 seconds of test are depicted by Figure 8(b).The
periods where SIR improvement is consistently close to 0 dB
correspond to silences of both speakers. Average SIR im-
provement over the entire recording is given in Ta ble 2a.
The result of the “no control” baseline method highlights
the target cancellation problem and confirms the necessity of
adaptation control. In both setups, both “implicit” and “ex-
plicit” methods are robust against this problem, and the ex-
plicit method provides the best results. Although the implicit
method does not give the best results (first two rows of the
table), we note that it successfully avoids leakage problems
(last row of the table). Note that in the case of Setup II, both
implicit and explicit approaches give better results than the
delay-sum W
0
. Overall, all expectations g iven in Section 5.4
are verified.
5.6. Experiments with 100 km/h noise
The same experiments as in Section 5.5 were conducted
again after adding the background road noise waveform
noise. The resulting wave files have an average segmental
SNR of 11.6dBinSetupI,and9.6 dB in Setup II. In the case
of the explicit control, the same detection threshold and the
same parameters (λ, Q
0
, Q
1
) were used as those obtained in
experiments on clean data. Only the step-size was lowered
12 EURASIP Journal on Applied Signal Processing
Codriver
Driver
00.511.522.53
Time (s)
Source signals
Codriver
Driver
00.511.522.53
Time (s)
Source signals with n oise
−10
−5
0
5
10
15
20
SIR improvement (dB)
00.511.522.53
Time (s)
No control
Implicit
Explicit
2 microphones- noise canceller
−10
−5
0
5
10
15
20
SIR improvement (dB)
00.511.522.53
Time (s)
No control
Implicit
Explicit
2 microphones- noise canceller
(a) Noisy conditions.
−10
−5
0
5
10
15
20
SIR improvement (dB)
00.511.522.53
Time (s)
No control
Implicit
Explicit
4 microphones- GSC
(b) Clean conditions.
−10
−5
0
5
10
15
20
SIR improvement (dB)
00.511.522.53
Time (s)
No control
Implicit
Explicit
4 microphones- GSC
Figure 8: Improvement over input SIR (100 millisecond moving average, first 3 seconds shown). (a) Shows results on clean data (test),
whereas (b) shows results on noisy data (test + noise: 100 km/h background road noise).
Guillaume Lathoud et al. 13
Table 2: Average segmental SIR improvement in dB. In Setup I, the reference is the output x
1
of microphone 1. In Setup II, the reference
is the output of the delay-sum W
0
.(W
0
brings an SIR improvement over x
1
of 0.1, 1.6, 2.2 dB, resp., in the “codriver,” “both,” and “driver”
cases.)
(a) test (clean data).
Setup I (2 mics) Setup II (4 mics)
reference: x
1
reference: W
0
Range of the No control Implicit Explicit No control Implicit Explicit
true input SIR (baseline) (baseline)
< −6(codriver) 6.55.910.710.46.110.5
[
−6, +6] (both) −0.61.25.80.62.33.3
> +6 (driver)
−7.7 −0.22.6 −10.00.0 −0.8
(b) test + noise.
Setup I (2 mics) Setup II (4 mics)
reference: x
1
reference: W
0
Range of the No control Implicit Explicit No control Implicit Explicit
true input SIR (baseline) (baseline)
< −6(codriver) 6.47.17.47.93.810.3
[
−6, +6] (both) 1.02.73.51.21.63.2
> +6 (driver)
−4.70.41.9 −6.30.2 −2.4
to take into account the lower quality of the incoming signal
due to noise.
The goal of this experiment is to determine whether the
proposed approaches can cope with background noise. It is
not obv ious, since they do not explicitly model background
noise, which may be incoherent or localized outside of the
defined sectors. The hope is that reducing the adaptation step
is enough, while keeping all other parameters unchanged.
The result is given in Figure 8(a) and Ta ble 2(b). The be-
haviour in terms of SIR improvement, both over time and
in average, is very similar to the clean case. The only nega-
tive result is “explicit” in the “driver” case, which is still no
degradation compared to the input SIR at x
1
. This is inter-
esting, given that the threshold of the “explicit” method was
not changed. Thus, we can state that both implicit and ex-
plicit approaches also work in a realistic case of a moving car.
6. CONCLUSION
Two adaptation control methods were proposed to cancel
the codriver interference from the driver’s speech signal: im-
plicit and explicit control. At no a dditional cost, the implicit
adaptation method provides robustness against leakage, but
slower convergence. On the other hand, the explicit adapta-
tion method relies on estimation of target and interference
energies. A novel, robust method for such estimation was
derived from sector-based detection and localization tech-
niques. It relies on integration of the delay-sum energy over a
volume of space, for the same cost as the classical delay-sum.
In the end, the explicit control method provides both robust-
ness and good performance. Both implicit and explicit meth-
ods are suitable for real-time implementation. One direction
for future work is to investigate modelling of the microphone
directionality for further enhancement of the sector-based
detection framework. A second direction is to test on other
noise cases, including other passengers.
APPENDIX
A.
Section A.1 defines a phase domain metric (PDM), similarly
to the classical metric definition. Section A.2 proves that any
1-dimensional PDM can be composed into a multidimen-
sional function which is also a PDM.
A.1. Definition of a PDM
Similarly to the classical metric definition, we define a PDM
on
R
P
as a function g(x, y) verifying all of the following con-
ditions for all (x, y, z)
∈ (R
P
)
3
:
g(x, y)
≥ 0, (A.1)
g(x, y)
= g(y, x), (A.2)
g(x, y)
= 0iff ∀p = 1, , P, ∃k
p
∈ Z, x
p
= y
p
+ k2π,
(A.3)
g(x, z)
≤ g(x, y)+g(y, z). (A.4)
It is basically the same as a classical metric, except for
(A.3) which reflects the “modulo 2π” definition of angles.
A.2. Property
Let G
1
be a 1-dimensional PDM, that is a PDM on R.Forany
P
∈ N
∗
,letG
P
be the following function on R
P
:
G
P
(x, y)
def
=
1
P
P
p=1
G
1
x
p
, y
p
2
. (A.5)
14 EURASIP Journal on Applied Signal Processing
The rest of this Section shows that all G
P
functions are
also PDMs. Equations (A.1), (A.2), and (A.3)aretrivialto
demonstrate. Equation (A.4) is demonstrated for G
P
in the
following.
Since G
1
is a PDM, it verifies (A.4)onR. Therefore, for
any (x, y, z)
∈ (R
P
)
3
,
G
P
(x, z) ≤
1
P
P
p=1
G
1
x
p
, y
p
+ G
1
y
p
, z
p
2
. (A.6)
Now let us recall the Minkowski inequality [28]. For any
β>1anda
p
> 0, b
p
> 0,
P
p=1
a
p
+ b
p
β
1/β
≤
P
p=1
a
p
β
1/β
+
P
p=1
b
p
β
1/β
.
(A.7)
By applying the Minkowski inequality to the right-
hand side of (A.6), with β
= 2, a
p
= G
1
(x
p
, y
p
), and
b
p
= G
1
(y
p
, z
p
), and dividing by
√
P,weobtain
G
P
(x, z) ≤
1
P
P
p=1
G
1
x
p
, y
p
2
+
1
P
P
p=1
G
1
y
p
, z
p
2
,
(A.8)
G
P
(x, z) ≤ G
P
(x, y)+G
P
(y, z). (A.9)
ACKNOWLEDGMENTS
The authors acknowledge the support of the European Union
through the HOARSE project. This work was also carried out
in the framework of the Swiss National Center of Compe-
tence in Research (NCCR) on interactive multimodal infor-
mation management (IM)2. The authors would like to thank
Dr Iain McCowan, Dr Mathew Magimai Doss, and B ertrand
Mesot for helpful comments and suggestions.
REFERENCES
[1] E. Shr iberg, A. Stolcke, and D. Baron, “Can prosody aid the
automatic processing of multi-party meetings? Evidence from
predicting punctuation, disfluencies, and overlapping speech,”
in Proceedings of ISCA Tutorial and Research Workshop on
Prosody in Speech Recognition and Understanding, pp. 139–146,
Red Bank, NJ, USA, October 2001.
[2] S. Affes and Y. Grenier, “Test of adaptive beamformers for
speech acquisition in cars,” in Proceedings of 5th International
Conference on Sig nal Processing Applications and Technology
(ICSPAT ’94), vol. 1, pp. 154–159, Dallas, Tex, USA, October
1994.
[3] B. D. Van Veen and K. M. Buckley, “Beamforming: a versa-
tile approach to spatial filtering,” IEEE ASSP Magazine, vol. 5,
no. 2, pp. 4–24, 1988.
[4] D. Van Compernolle, “Switching adaptive filters for enhancing
noisy and reverberant speech from microphone array record-
ings,” in Proceedings of IEEE International Conference on Acous-
tics, Speech, and Signal Processing (ICASSP ’90), vol. 2, pp. 833–
836, Albuquerque, NM, USA, April 1990.
[5] S. Affes and Y. Grenier, “A signal subspace tracking algorithm
for microphone array processing of speech,” IEEE Transactions
Speech Audio Processing, vol. 5, no. 5, pp. 425–437, 1997.
[6] O. Hoshuyama and A. Sugiyama, “A robust adaptive beam-
former for microphone arrays with a blocking matrix using
constrained a daptive filters,” in Proceedings of IEEE Interna-
tional Conference on Acoustics, Speech, and Signal Processing
(ICASSP ’96), vol. 2, pp. 925–828, Atlanta, Ga, USA, May 1996.
[7] M. Buck and T. Haulick, “Robust adaptive beamformers for
automotive applications,” in Proceedings of DAGA,Strasbourg,
France, March 2004.
[8]O.Hoshuyama,B.Begasse,A.Sugiyama,andA.Hirano,“A
real time robust adaptive microphone array controlled by an
SNR estimate,” in Proceedings of IEEE International Conference
on Acoustics, Speech, and Signal Processing (ICASSP ’98), vol. 6,
pp. 3605–3608, Seattle, Wash, USA, May 1998.
[9] W. Herbordt, T. Trini, and W. Kellermann, “Robust spatial es-
timation of the signal-to-interference ratio for non-stationary
mixtures,” in Proceedings of International Workshop on Acous-
tic Echo and Noise Control (IWAENC ’03), pp. 247–250, Kyoto,
Japan, September 2003.
[10] O. Hoshuyama, A. Sugiyama, and A. Hirano, “A robust adap-
tive beamformer for microphone arrays with a blocking ma-
trix using constrained adaptive filters,” IEEE Transactions Sig-
nal Processing, vol. 47, no. 10, pp. 2677–2684, 1999.
[11] S. Gannot, D. Burshtein, and E. Weinstein, “Signal enhance-
ment using beamforming and nonstationarity with applica-
tions to speech,” IEEE Transactions Signal Processing, vol. 49,
no. 8, pp. 1614–1626, 2001.
[12] G. Lathoud and M. Magimai Doss, “A sector-based,
frequency-domain approach to detection and localization
of multiple speakers,” in Proceedings of IEEE International
Conference on Acoustics, Speech, and Signal Processing (ICASSP
’05), vol. 3, pp. 265–268, Philadelphia, Pa, USA, March 2005.
[13] D. Ellis and J. Liu, “Speaker turn segmentation based on
between-channel differences,” in Proceedings of ICASSP-NIST
Meeting Recognition Workshop, pp. 112–117, Montreal, Que-
bec, Canada, May 2004.
[14] G. Lathoud, I. A. McCowan, and J M. Odobez, “Unsupervised
location-based seg mentation of multi-party speech,” in Pro-
ceedings of ICASSP-NIST Meeting Recognition Workshop,Mon-
treal, Quebec, Canada, May 2004.
[15] W. Herbordt, W. Kellermann, and S. Nakamura, “Joint opti-
mization of LCMV beamforming and acoustic echo cancella-
tion,” in Proceedings of 12th European Signal Processing Confer-
ence (EUSIPCO ’04), pp. 2003–2006, Vienna, Austria, Septem-
ber 2004.
[16] G. Lathoud, J. Bourgeois, and J. Freudenberger, “Multichan-
nel speech enhancement in cars: explicit vs. implicit adapta-
tion control,” in Proceedings of Joint Workshop on Hands-Free
Speech Communication and Microphone Arrays (HSCMA ’05),
Piscataway, NJ, USA, March 2005.
[17] S. T. Roweis, “Factorial models and refiltering for speech
separation and denoising,” in Pro ceedings of 8th Euro-
pean Conference on Speech Communication and Technology
(EUROSPEECH ’03), pp. 1009–1012, Geneva, Switzerland,
September 2003.
[18] G. Lathoud and I. A. McCowan, “A sector-based approach for
localization of multiple speakers with microphone arrays,” in
Proceedings of ISCA Tutorial and Research Workshop on Statis-
tical and Perceptual Audio Processing (SAPA ’04), Jeju, Korea,
October 2004.
Guillaume Lathoud et al. 15
[19] C. Knapp and G. Carter, “The generalized correlation method
for estimation of time delay,” IEEE Transactions Acoustics,
Speech, Signal Processing, vol. 24, no. 4, pp. 320–327, 1976.
[20] B. C. J. Moore, An Introduction to the Psychology of Hearing,
Academic Press, London, UK, 4th edition, 1997.
[21] G. Lathoud, M. Magimai Doss, and B. Mesot, “A spectro-
gram model for enhanced source localization and noise-
robust ASR,” in Proceedings of 9th European Conference on
Speech Communication and Technology (INTERSPEECH ’05),
Lisbon, Portugal, September 2005.
[22]B.WidrowandS.D.Stearns,Adaptive Signal Processing,
Prentice-Hall, Englewood Cliffs, NJ, USA, 1985.
[23] L. J. Griffiths and C. W. Jim, “An alternative approach to lin-
early constrained adaptive beamforming,” IEEE Transactions
on Antennas and Propagation, vol. 30, no. 1, pp. 27–34, 1982.
[24] O. Hoshuyama and A. Sugiyama, “A robust adaptive beam-
former for microphone arrays with a blocking matrix using
constrained adaptive filters,” in Proceedings of IEEE Interna-
tional Conference on Acoustics, Speech, and Signal Processing
(ICASSP ’96), vol. 2, pp. 925–928, Atlanta, Ga, USA, May 1996.
[25] A.Mader,H.Puder,andG.U.Schmidt,“Step-sizecontrolfor
acoustic echo cancellation filters—an overview,” Signal Pro-
cessing, vol. 80, no. 9, pp. 1697–1719, 2000.
[26] J. Bourgeois, J. Freudenberger, and G. Lathoud, “Implicit con-
trol of noise canceller for speech enhancement,” in Proceed-
ings of 9th European Conference on Speech Communication and
Technology (INTERSPEECH ’05), Lisbon, Portugal, September
2005.
[27] A. P. Dempster, N. M. Laird, and D. B. Rubin, “Maximum like-
lihood from incomplete data via the EM algorithm,” Journal of
the Royal Statistical Society, Series B, vol. 39, no. 1, pp. 1–38,
1977.
[28]T.K.MoonandW.C.Stirling,Mathematical Methods and
Algorithms for Signal Processing, Prentice-Hall, Upper Saddle
River, NJ, USA, 2000.
Guillaume Lathoud received his M.S. in
computer science and telecommunications
in 1999 at the Institut National des Telecom-
munications (INT), France. He then spent
more than 2 years as a Member of the Dig-
ital Television Team at the National Insti-
tute of Standards and Te chnology (NIST),
USA, participating to terrestrial DTV stan-
dardization and implementation efforts. He
joined IDIAP Research Institute, Switzer-
land, in 2002 as a Ph.D. student. His interests include microphone
array processing, audio source localization, speaker tracking, mul-
timodal processing, and noise-robust speech recognition.
Julien Bourgeois received the M.S. degree
from the ESIEE Paris (Ecole Superieure
d’Ingenieurs en Electronique et Electrotech-
nique de Paris) in 2001. He received a B.S. in
mathematics concurrently from the Univer-
sity de Marne-La-Vall
´
ee in 2000. He joined
DaimlerChr ysler Research and Technology
in 2002 as a Ph.D. student. His current re-
search interests include multichannel signal
processing and blind source separation with
application to speech enhancement.
J
¨
uergen Freudenberger received his Di-
plom-Ingenieur and Dr Ing. degrees in
electrical engineering from the University of
Ulm, Germany, in 1999 and 2004, respec-
tively. After completing his dissertation, he
joined DaimlerChrysler Research and Tech-
nology. Since July 2005, he is with Har-
man/Becker Automotive Systems. His re-
search interests include information and
coding theory, in particular transmission
over channels with feedback, and signal processing for speech sig-
nals. He received a Villigst scholarship and is the recipient of the
“ITG Frderpreis 2005” Award of the German Information Technol-
ogy S ociety (ITG).