Báo cáo hóa học: " Accuracy Evaluation for Region Centroid-Based Registration of Fluorescent CLSM Imagery" pptx
Bạn đang xem bản rút gọn của tài liệu. Xem và tải ngay bản đầy đủ của tài liệu tại đây (3.01 MB, 11 trang )
Hindawi Publishing Corporation
EURASIP Journal on Applied Signal Processing
Volume 2006, Article ID 82480, Pages 1–11
DOI 10.1155/ASP/2006/82480
Accuracy Evaluation for Region Centroid-Based
Registration of Fluorescent CLSM Imagery
Sang-Chul Lee,
1
Peter Bajcsy,
1
Amy Lin,
2
and Robert Folberg
2
1
The National Center for Supercomputing Applications, University of Illinois at Urbana-Champaign, Urbana, IL 61801, USA
2
Department of Patholog y, The University of Illinois Cancer Center, University of Illinois at Chicago, Chicago, IL 60607, USA
Received 1 March 2005; Revised 30 September 2005; Accepted 16 November 2005
We present an accuracy evaluation of a semiautomatic registration technique for 3D volume reconstruction from fluorescent
confocal laser scanning microscope (CLSM) imagery. The presented semiautomatic method is designed based on our observations
that (a) an accurate point selection is much harder than an accurate region (segment) selection for a human, (b) a centroid selection
of any region is less accurate by a human than by a computer, and (c) registration based on structural shape of a region rather than
based on intensity-defined point is more robust to noise and to morphological deformation of features across stacks. We applied
the method to image mosaicking and image alignment registration steps and evaluated its performance w ith 20 human subjects on
CLSM images with stained blood vessels. Our experimental evaluation showed significant b enefits of automation for 3D volume
reconstruction in terms of achieved accuracy, consistency of results, and performance time. In addition, the results indicate that
the differences between registration accuracy obtained by experts and by novices disappear with the proposed semiautomatic
registration technique while the absolute registration accuracy increases.
Copyright © 2006 Hindawi Publishing Corporation. All rights reserved.
1. INTRODUCTION
The problem of 3D volume reconstruction can be found in
multiple application domains, such as medicine, mineral-
ogy, or surface material science. In almost all applications,
the overarching goal is to automate a 3D volume reconstruc-
tion process while achieving at least the accuracy of a hu-
man operator. The benefits of automation include not only
the cost of human operators but also the improved consis-
tency of reconstruction and the eliminated training time of
operators. Thus, in this paper, we study the performance of
fully automatic, semiautomatic, and manual 3D volume re-
construction methods in a medical domain [1]. Specifical ly,
we conduct experiments with fluorescent confocal laser scan-
ning microscope imagery used for mapping the distribution
of extracellular matrix proteins in serial histological sections
of uveal melanoma [2, 3].
In general, a feature-based 3D volume reconstruction
without aprioriinformation requires performing the follow-
ing steps. First, select a reference coordinate system or a ref-
erence image. Second, determine location of salient features
in multiple data sets. This step is also denoted as finding spa-
tial correspondences. Third, select a registration transforma-
tion model that will compensate for geometric distortions.
Fourth, evaluate registration accuracy with a selected metric.
Regardless of the automation category (manual or semiau-
tomatic), these selections and evaluations are needed to per-
form 3D volume reconstruction. The challenges lie not only
in making appropriate selections in the aforementioned steps
but also in defining optimality cr iteria for any made selec-
tion. In many cases, it is very hard to assess the registration
accuracy objectively due to a lack of aprioriinformation
about data sets. While the selection challenges are one part
of each registration technique, the accuracy assessment chal-
lenge is addressed in the experimental evaluation.
There exist many techniques for 3D volume reconstruc-
tion and many commercial tools from multiple vendors that
could be used for image registration [4–9]. An overview
of 3D registration tools for MRI, CT, confocal, and serial-
section data for medical/life-sciences imaging is provided at
the Stanford or at the NIH web sites (n-
ford.edu/3dreconstruction/software/ and n.
com/guide/image/analysis.htm). One could list some of the
few software tools that have been developed specifically for
CLSM, for example, 3D-Doctor, Science GL, MicroVoxel,
3DVIEWNIX, or Analyze. Most of these tools use manual
registrationmethods,andusershavetomakemanualse-
lections, as described in the previous paragraph, before
any particular software reports registration error associ-
ated with registered images. Some software packages include
2 EURASIP Journal on Applied Signal Processing
semiautomatic or fully automatic 3D volume re-con-struc-
tion for specific imaging modalities under the assumption
that visually salient markers have been inserted artificially in
imaged specimens. For instance, 3D-Doctor provides a max-
imum likelihood algorithm for aligning slices under such as-
sumption.
This paper presents evaluations that are of interest to
researchers who have done similar work but never had the
time to quantify the pros and cons of (1) automation level,
(2) expertise level, and (3) transformation model complex-
ity variables for mosaicking and image alignment registra-
tion problems. In addition, while the registration techniques
used in our work are well known, they have been applied in
the past to other imaging modalities, for example, MRI, CT,
PET, than the fluorescent CLSM imagery. The specific chal-
lenges of fluorescent CLSM imaging, 3D volume reconstruc-
tion without fiduciary markers, and designing an evaluation
methodology have to be understood when the standard reg-
istration algorithms are applied. We provide such results for
the benefit of the researchers that work with or consider us-
ing CLSM imaging modality.
Our proposed work aims at estimating upper error
bounds for automatic, semiautomatic, and manual 3D vol-
ume reconstruction techniques. To achieve our aim, we have
developed three mosaicking methods (registration of x-y im-
age tiles in a single frame of a physical section) and two align-
ment algorithms (registration of z-slides from multiple phys-
ical sections). Next, we designed an experimental evaluation
methodology that addresses the issues of (a) defining opti-
mality criteria for assessing registration accuracy and (b) ob-
taining the ground truth (or reference) images, as encoun-
tered in real medical registration scenarios. After conducting
experiments with human subjects consisting of experts and
novices, we drew conclusions about the 3D reconstruction
methods and thoroughly a nalyzed the driving factors behind
our results.
This paper is organized in the following way. Section 2
introduces the 3D volume reconstruction problem on CLSM
images. Section 3 describes all image mosaicking and align-
ment registration methods developed for the accuracy assess-
ment study. Section 4 presents our e valuation methodology
for multiple registration methods. Finally, all experimental
results are presented and analyzed in Section 5 ,andourwork
is summarized in Section 6.
2. PROBLEM STATEMENTS
We define the 3D reconstruction problem as a registration
problem [10].Thegoalof3Dreconstructionistoforma
high-resolution 3D volume with large spatial coverage from a
set of spatial tiles (small spatial coverage and high-resolution
2D images or 3D cross-section volumes). 3D volumetric data
are acquired from multiple cross-sections of a tissue speci-
men by (a) placing each cross-section under a laser scanning
confocal microscope, (b) changing the focal length to obtain
an image stack per cross-section, and (c) moving the speci-
men spatially for specimen location. The set of spatial tiles is
acquired by CLSM and consists of images that came from one
Frame index
Slide 1
Slide 2
Stack (1, 1)
y
z
x
x1y0
x1y1
x1y2
x2y0
x2y1
x2y2
x3y0
x3y1
x3y2
y0
y1
y2
.
.
.
Figure 1: An overview of 3D volume reconstruction from fluores-
cent laser scanning confocal microscope images.
or multiple cross-sections of a 3D volume. Our objectives are
to (1) mosaic (stitch together) spatial tiles that came from
the same cross-section, (2) align slides (physical sections)
from multiple cross-sections, and (3) evaluate the accuracy
of 3D volume reconstruction using multiple techniques. An
overview of the 3D volume reconstruction problem is illus-
trated in Figure 1. Our assumption is that there is no prior
information about (a) tile locations and their spatial over-
lap, (b) cross-section feature, and (c) evaluation methodol-
ogy and metrics.
It is apparent that using artificially inserted fiduciary
markers allows automating 3D volume reconstruction while
keeping the registration error low. However, there still ex-
ist medical experiments with CLSM, where fiduciary mark-
ers cannot be inserted into a specimen. For example, the
placement of fiduciary markers in paraffin-embedded tis-
sue is problematic. The introduction of markers internally
may distort tissue and areas of interest. On the other hand,
markers placed outside the tissue may migrate during sec-
tioning or expansion of the paraffin. The composition of
the marker also poses challenges. Rigid material, such as su-
ture, may fragment or distort the tissue when sections are
cut. In addition to attempting to locate fiduciary markers
into tissues using the aforementioned techniques, it is also
attempted to insert small cylindrical segments of “donor tis-
sue” from paraffin-embedded tissues according to the tech-
niques used to construct tissue microarrays [11]. It is dis-
covered that the round outlines of donor tissue cores were
inconsistent between tissue sections, making it impossible to
use these donor samples as reliable internal fiduciary mark-
ers.
Although we are addressing the 3D volume reconstruc-
tion problem without artificially inserted fiduciary markers
into paraffin-embedded tissue, we still need to identify an
internal specimen structure for registration that would be vi-
sually salient. For this purpose, tonsil tissue was selected be-
cause it contained structures of interest, for example, blood
vessels. The tonsillar crypts provided a complex edge against
which alignment was possible, and the epithelial basement
membrane followed its contour. We stained the blood vessels
with an antibody to laminin that also stained the epithelial
basement membrane. Therefore, by using the epithelial base-
ment membrane—a normal constituent of the tissue—as the
Sang-Chul Lee et al. 3
visually salient registration feature in the input CLSM image,
we were able to align the tissue sections. Thus, CLSM images
of tonsil tissue sections were used for 3D volume reconstruc-
tion accuracy evaluations.
3. REGISTRATION METHODS
As we described in the introduction, there are four registra-
tion steps. While certain parameters are defined once dur-
ing registration of a batch of images, such as a reference
coordinate system and a registration transformation model,
other parameters have to be determined for each image sep-
arately, for example, locations of salient features and their
spatial correspondences. Thus, our goal is to determine the
most cost-efficient registration technique in terms of au-
tomation/labor and accuracy/time in order to automate se-
lection of image-specific parameters. This leads us to the de-
velopment of manual, semiautomatic, and fully automatic
registration techniques based on algorithmic assumptions
valid for a class of specimens imaged by CLSM.
There exist image mosaicking and alignment constraints
that have been included in the software de velopment as well.
The current software has been de veloped for mosaicking
problem constrained to spatial translations of image tiles and
for image alignment problem constrained to affine transfor-
mation between two adjacent cross-sections. The description
of the methods developed and evaluated in this work follows
next.
3.1. Image mosaicking
Image mosaicking can be performed by visually inspecting
spatially adjacent images, selecting one pair of corresponding
points in the overlapping image area and computing trans-
formation parameters for stitching together image tiles. This
approach is denoted as manual mosaicking and is supported
with software that enables (a) pixel selection of matching
pairs of points and (b) computation of transformation pa-
rameters from a set of control points. If images are stitched
together without any human intervention, then we refer to
the method as automatic mosaicking.Ifacomputerpre-
computes salient feature candidates and a user interaction
specifies correspondences between any two features, then the
method is referred to as semiautomatic mosaicking.Basedon
the underlying registration mechanism, we also denote man-
ual registration as the pixel-based method and semiautomatic
registration as the feature-based method.
First, we developed a manual mosaicking method that
displays two spatially overlapping image tiles to a user. A
user selects a pair of matching pixels, and then image tiles
are stitched. In the next step, a user is presented with the al-
ready stitched image and a new tile to select matching pixels.
Manual mosaicking is performed in this way till all images
are stitched together and the final mosaicked image can be
viewed for verification purposes. Second, we have developed
a semiautomatic method that (1) highlights segmented vas-
cular regions (closed contours) as salient feature candidates
and (2) computes a pair of region centroids, as control points
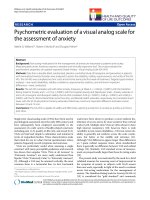
Figure 2: Adjacent tiles of CLSM images: overlapping regions have
few vascular features.
for regist ration, after a user defined two region correspon-
dences. This semiautomatic method is designed based on
our observations that (a) an accurate point selection is much
harder for a human than an accurate region (segment) selec-
tion, (b) a centroid selection of any region is less accurate by
a human than by a computer, and (c) registration based on
structural shape of a region rather than on intensity-defined
point is more robust to noise. Third, we present a fully auto-
matic mosaicking method. Full automation can be achieved
by either automating feature-based registration process [12–
14] or maximizing pixel intensity correlation using compu-
tationally feasible search techniques with normalized cross-
correlation or mutual information metrics [15, 16].
To compare the mosaic accuracy, it would be more natu-
ral to achieve full automation by automating feature match-
ing process. However, in CLSM imaging, it is not always fea-
sible and the intensit y-based methods have to be used. For
example, there can be lack of detected vascular features in the
overlapping region as it is illustrated in Figure 2. Although
one might argue that intensity-based and feature-based tech-
niques have different nature/principles behind their registra-
tion strategy, note that our objective is to evaluate registra-
tion accuracy which is independent of the chosen mosaick-
ing technique. In our work, performing accuracy evaluations
by comparing multiple techniques is independent of their
underlying principles, and we focus only on their resulting
mosaicking accuracy. One could also inspect Ta ble 1 to re-
alize that the intensity-based method (fully automatic) can
lead to better or worse results than the feature-based method
(manual and semiautomatic), which will be further discussed
in Section 5.1. In this work, we demonstrate that the region
centroid-based registration method significantly improves
4 EURASIP Journal on Applied Signal Processing
Table 1: A summary of mosaicking experiments: 3 by 3 tiles with
512 by 512 pixel resolutions. Full automatic methods are performed
by the normalized cross-correlation (NC) and by the normalized
mutual information (NMI) on pentium 4, 3.0GHz.
Error (pixels)
Pixel-based Feature-based Auto
expert novice expert novice NC NMI
Average 5.72 10.65 4.04 4.22 4.12 4.12
Standard deviation 3.42 11.83 0.32 0.47 0 0
Total a vera g e 6.96 4.07 4.12
Total standard deviation 6.82 0.35 0
Upper bound (99.73%) 27.42 5.12 4.12
Time (seconds)
Pixel-based Feature-based Auto
expert novice expert novice NC NMI
Average 211.56 153.47 125.27 101 68 480
Standard deviation 132.32 95.06 56.96 45.66 0 0
Total average 197.03 119.2 274
Total standard deviation 125.88 55.01 0
Upper bound (99.73%) 574.67 284.23 274
performance for 3D volume reconstruction of CLSM images
in terms of achieved registration accuracy, consistency of the
results, and performance time.
In our work, we used normalized mutual information
and nor malized cross-correlation metrics to find the best
match of two tiles and to provide the sought translational
offset for tile stitching. The main mosaicking advantages of
these intensity correlation-based methods are (a) their rela-
tively low computational cost for translation only, (b) robust
performance for image tiles acquired with the same instru-
mentation setup, and (c) no user interaction (full automa-
tion). For example, Figure 3 shows how a high-resolution
mosaicked image is constructed from nine image tiles.
3.2. Image alignment
Two challenges of image alignment include the transforma-
tion technique and model selection problems. In the past, the
transformation technique based on correlation has been ap-
plied to many medical image modalities [17] other than the
fluorescent CLSM modality. Nonetheless, applying the same
techniques to the image alignment problem of CLSM images
is more difficult due to (1) computational cost, (2) spatial in-
tensity heterogeneity, and (3) noise issues as explained below.
First, the computational difficulty arises from a large im-
age size and many degrees of freedom for complex tr ansfor-
mation models. In our case, the computational complexity
due to a large amount of data (3D stacks with many physi-
cal sections to obtain sufficient depth information) with high
spatial resolution (around 2500 by 2500) should be consid-
ered when applying an affine transformation (6 degree of
freedom). One could find methods in the literature that pro-
cess large data of other imaging modalities than CLSM by
using multiresolution- (or pyramid-) based techniques [17].
(a)
(b)
Figure 3: Image mosaicking problem: (a) image tiles with grey-
scale shaded borders and (b) mosaicked image showing where each
tile belongs in the final image based on its grey-scale shade.
However, in the case of CLSM images, the local minima
problemismoresevereduetohighspatialanddepthinten-
sity heterogeneity (attenuation) [18]. Second, varying signal-
to-noise ratio due to the aforementioned intensity hetero-
geneity should be considered. Third, noisy (spurious) fea-
tures with high intensity values due to unbound fluorescence
have to be handled.
To support our claims about spatial intensity heterogene-
ity and the presence of noise, we evaluated an intensity-based
similarity metric (normalized correlation) for pairs of images
from two registered CLSM subvolumes. The registration was
conducted by semiautomated, region centroid-based align-
ment. The low magnitudes of these similarity values (ap-
proximately in the interval [0.325,0.365]) proved that the
intensity-based automatic alignment would not be robust
and would very frequently fail. As a consequence, we did not
apply the correlation-based technique developed for image
mosaicking to the image alignment problem.
Sang-Chul Lee et al. 5
Furthermore, the problem of image alignment (or reg-
istration along z-axis) is much harder to automate than the
problem of mosaicking because images of cross-sections are
less similar than images of spatial tiles due to the process
of cross-section specimen preparation (sample warping due
to slicing), intensity variation (confocal imaging), and struc-
tural changes (bifurcating structures). In Figure 4, we quanti-
fied the morphological changes along depth in a single physi-
cal cross-section by computing normalized cross-correlation
coefficient between the first and other image frames.
In terms of transformation model selection, higher-order
(elastic), local or global models would be preferable to
achieve smooth transition of image structures across slides
(higher-order continuity). However, the difficulty with
higher-order models is (a) in their robust parameter estima-
tion due to intensity variation (noise) and deformation ex-
ceeding the order of the chosen model or (b) in bifurcation
(appearing and disappearing structures). Although nonrigid
optimization can be applied for only local features after a
global alignment, we limited our transformation model as an
affine because the transformations using higher-order mod-
els could lead to erroneous alignment due to the well-known
leaning tower problem [19], and could ultimately distort the
3D anatomical structures (features) by matching accurately
small regions while significantly distorting other regions.
Rigid transformation model with only translation and
rotation is one of the most popular lower-order transforma-
tion models designed for rigid structures like bones. How-
ever, in our case, the paraffin-embedded tonsil tissue rep-
resents a nonrigid structure and has to include deforma-
tion like shear due to tissue slicing. Considering the medical
specimens of our interest, we chose an affine transformation
for modeling cross-section distortions and expected to de-
tect only a small amount of scale and shear deformations.
We plan to research automatic registration techniques using
other transformation models in future.
Given the affine transformation model α :
R
2
→ R
2
, the
image alignment can be performed by selecting at least three
pairs of corresponding points and computing six affine trans-
formation parameters shown below:
x
y
=
a
00
a
01
a
10
a
11
x
y
+
t
x
t
y
. (1)
The (x
, y
) = α(x, y) values are the transformed coordinates
(x, y). The four parameters, a
00
, a
10
, a
01
,anda
11
,represent
a 2 by 2 matrix compensating for scale, rotation, and shear
distortions in the final image. The two parameters, t
x
and t
y
,
represent a 2D vector of translation.
The manual and semiautomatic methods for image
alignment differ from the methods described for image mo-
saicking by the need to select at least three pairs of corre-
sponding registra tion points as opposed to one pair of points
sufficient in the case of image mosaicking. The affine trans-
formation parameters are computed by solving six or more
linear equations.
2 4 6 8 10 12 14 16 18 20 22
Image frame
0.5
0.55
0.6
0.65
0.7
0.75
0.8
0.85
0.9
0.95
1
Correlation coefficient
Figure 4: Morphology quantification in a CLSM stack: x-axis rep-
resents a frame index (along depth) which is compared with the first
frame.
4. EVALUATION METHODOLOGY FOR
REGISTRATION ACCURACY
In this section, we outline our methodology for assessing up-
per error bounds of automatic, semiautomatic, and man-
ual 3D volume reconstruction techniques. Our experimen-
tal variables include (1) the type of registration problem
(image mosaicking and alignment), (2) the type of registra-
tion method (automatic, semiautomatic, and manual), and
(3) the type of human subject (experts and novices) doing
registration. Human subjects were labeled as experts if they
had the knowledge about CLSM imaging, imaged specimen
and its anatomical/structural properties, and/or principles of
the affine tr ansformation-based registration algorithm. This
type of knowledge was critical for establishing feature corre-
spondences and obtaining accurate registration results.
Our primary evaluation criterion is registration accuracy
with an auxiliary measure of performance time. The chal-
lenges of registration evaluations are usually in defining op-
timality criteria for assessing registration accuracy and in
knowing the ground truth (or a reference image). The two
fundamental questions that arise during registr a tion accu-
racy evaluations are (1) what to compare the registered (mo-
saicked or aligned) image to, and (2) how to compare two
images. Next, we describe how these challenges were over-
come for image mosaicking and image alignment accuracy
evaluations.
4.1. Image mosaicking accuracy evaluation
In the case of image mosaicking, we could carve out several
spatially overlapping tiles from one large image and use the
original image as the reference (ground truth) image. How-
ever, this evaluation setup would not simulate the real prob-
lem of mosaicking multiple tiles acquired at different time
instances, and therefore would not represent unpredictable
intensity variations due to fluorescent imaging physics. Thus,
we chose to establish the ground truth image and the loca-
tions of all n tiles in this image (denoted as T
GT
in (2)) in the
following way.
6 EURASIP Journal on Applied Signal Processing
First, we took an overview image of a specimen at 20 ×
optical magnification and 3 × 3 high-resolution image tiles
at 63
× optical magnification (n = 9). The overview image
became the ground truth image. Second, tile images (63
×
magnification) are digitally downsampled to match the res-
olution of the overview image (20
× magnification). Third,
we find the best match between a downsampled tile and the
overview image with a template-based search technique us-
ing a normalized cross-correlation metric. Fourth, the loca-
tion of the best tile match is rescaled to the original tile reso-
lution. Fifth, steps one through four are repeated for all nine
tiles to obtain a matrix of tile locations T
∗
. Sixth, the matrix
T
∗
is normalized with respect to the tile location in the up-
perleftcorner(t
1x
, t
1y
) of the final mosaic image. Note that
we have used a bilinear interpolation method for down- and
upsampling processes.
The uncertainty (pixel error distance) caused by the re-
sampling (e.g., interpolation) procedure can be easily com-
puted from the magnification factors. For example, for the
resampling factor equal to 63/20 (
= 3.15), a downsampled
pixel will have contributions from a 3.15 by 3.15 pixel neig h-
borhood. Thus, the uncertainty of the downsampled and
rescaled pixel is equal to the maximum pixel distance in a
3.15 by 3.15 pixel region (3.04 (
= 2.15
√
2) pixels
1
).
We denote the normalized matr ix as the ground truth
matrix T
GT
of tile locations:
T
GT
=
⎛
⎜
⎜
⎜
⎜
⎜
⎜
⎝
t
GT
1x
t
GT
1y
t
GT
2x
t
GT
2y
.
.
.
.
.
.
t
GT
nx
t
GT
ny
⎞
⎟
⎟
⎟
⎟
⎟
⎟
⎠
=
T
∗
−
⎛
⎜
⎜
⎜
⎜
⎜
⎝
t
1x
t
1y
t
1x
t
1y
.
.
.
.
.
.
t
1x
t
1y
⎞
⎟
⎟
⎟
⎟
⎟
⎠
,
where T
∗
=
⎛
⎜
⎜
⎜
⎜
⎜
⎝
t
1x
t
1y
t
2x
t
2y
.
.
.
.
.
.
t
nx
t
ny
⎞
⎟
⎟
⎟
⎟
⎟
⎠
.
(2)
Any other result of mosaicking is represented by a ma-
trix of tile locations T and compared with T
GT
. The mosaick-
ing registration error E
translation
is computed as an average er-
ror distance according to the formula in (3). Note that the
smaller the er ror implies the better mosaicking accuracy :
E
translation
=
1
n
n
i=1
t
GT
ix
− t
ix
2
+
t
GT
iy
− t
iy
2
. (3)
The proposed mosaicking evaluation methodology us-
ing (1) the overview image acquired at low optical magni-
fication as the true reference image and (2) the normalized
correlation-based estimation of tile locations T
GT
simulates
more closely real image tile data than a set of carved out
tiles from one image. Furthermore, the bias of tile locations
1
Note. Geometrically, the maximum distance is a Euclidean distance be-
tween the centers of pixels in a region.
T
GT
coming from normalized correlation-based matching
can be quantitatively expressed by the correlation values in
the vicinity of the best tile match with the overview image.
Our final remark is related to the selection of the error metric
E
translation
. Due to the intensit y variations of CLSM images,
it is preferable to use a registration accuracy metric based
on spatial matches of salient structures rather than on pixel
intensity matches. The appropriateness of this metric selec-
tion could be demonstrated by taking images of the same
specimen multiple times without moving it. If the metric
would be based on pixel intensity matches, then the metric
would indicate falsely misregistration in contrary to the met-
ric based on spatial matches.
4.2. Image alignment accuracy evaluation
Similarly to the case of image mosaicking, we could cre-
ate a pair of misaligned images by applying a known affine
transformation to any image and presenting the original and
transformed images to a user for accuracy evaluation pur-
poses. However, this evaluation setup would not simulate the
real problem of image alignment where two cross-sections
might have missing or new or warped structures with a pri-
ori unknown intensity variations. T hus, we chose to establish
the reference image and its corresponding affine transforma-
tion parameters in the following way.
First, we acquired a stack of CLSM images that are coreg-
istered along z-axis because a specimen has not moved while
the focal depth of CLSM has varied during image acquisi-
tion. Second, multiple stacks of CLSM images are aligned
by a manual alignment method and the representative of
all resulting affine transformations is recorded, for example,
maximum translation, rotation, and shear. Third, a pair of
misaligned images is constructed for accuracy evaluations by
taking the first and last images along the z-axis of one CLSM
physical section and applying the representative affine trans-
formation (recorded in step 2) to the last image. The first and
the last transformed images become the evaluation images
with the known ground truth affine transformation α
GT
(·).
All pixel coordinates of the transformed (ground truth) im-
age P
GT
={p
gt
1
, p
gt
2
, , p
gt
n
} are then defined by the affine
transformation α
GT
: p
i
→ p
gt
i
. Based on user’s registration
input, an affine transformation α
USR
(·)isestimated.Wede-
note the corresponding set of transformed pixel coordinates
as P
USR
={p
usr
1
, p
usr
2
, , p
usr
n
},whereα
USR
: p
i
→ p
usr
i
.The
final image alignment registration error E
affine
is then calcu-
lated as an average Euclidean error distance over all pixels co-
ordinates according to (4), where m is the number of trans-
formed pixels. Once ag ain, with the smaller the error E
affine
,
the better image alignment accuracy is achieved:
E
affine
=
1
m
m
i=1
p
gt
ix
− p
usr
ix
2
+
p
gt
iy
− p
usr
iy
2
. (4)
The proposed image alignment evaluation methodol-
ogy utilizes (1) confocal imaging to obtain required image
frames, a nd (2) empirically observed affine distortions to
prepare test alignment data as close to real data as possible.
Sang-Chul Lee et al. 7
The justification for choosing the alignment error metric
E
affine
is twofold. First, similar to the explanation provided
for the choice of the mosaicking error metric, an error met-
ric based on pixel locations seems more appropriate than a
metric based on intensity comparisons due to CLSM inten-
sity variations. Second, it would not be fair to compute dif-
ferences of affine transformation parameters since they rep-
resent a mix of distortions (translation, rotation, scale, and
shear). Euclidean distances over the registered area reflect the
degree of misalignment. It would be possible to consider a
metric that would include the spatial mismatch only over the
set pixels that are above a certain intensity threshold. How-
ever, we decided to avoid introducing a threshold parameter
into our evaluation metric due to different unknown inten-
sity ranges and distributions of a pair of compared images.
4.3. Statistical performance evaluation
Now we describe a statistical test method to evaluate accuracy
improvement of the feature-based approach against pixel-
based approach. Let
{E
P
i
} and {E
F
i
} be two paired sets of N
measured error values for the pixel-based method and the
feature-based method, respectively, obtained with the same
data. In our experiments, the size of the set is relatively large
(N
= 50 for mosaicking and N = 78 for alignment). We
assume that the paired error values are independent and fol-
low a Gaussian distribution. The null hypothesis in our tests
states that there is no improvement of the feature-based reg-
istration approach in comparison with the pixel-based regis-
tration approach. We perform the Student t test to prove or
reject the null hypothesis [20]. We compute
E
P
i
= (E
P
i
− E
P
i
)
and
E
F
i
= (E
F
i
− E
F
i
), where E
P
i
and E
F
i
are the average errors
of each set. Then, we calculate the t value for the paired t test
according to the equation below:
t
=
E
P
− E
F
N(N −1)
N
i
=1
E
P
i
−
E
F
i
2
. (5)
Given the t value from (5), we obtain the confidence in-
terval (p value [20]) to prove or reject the null hypothesis
(no improvement) using one-tailed cumulative probability
distribution function P(X
≤ t)withN − 1degreesoffree-
dom. The results of statistical comparisons are shown in the
next section.
5. EXPERIMENTAL RESULTS
The overall experiments consisted of mosaicking 3
×3image
tiles (see Figure 3) and aligning three pairs of different cross-
sections (see image examples in Figure 5). We report results
obtained from twenty human subjects (fifteen experts and
five novices) who participated in our study, and performed
manual and semiautomatic image mosaicking and alignment
registrations. To assess registration consistency, novices per-
formed registration three times with any given data set. Al-
though the results from novices may be biased by “a learning
effect,” we did not observe it in our experiments due to the
small number of trial repetitions.
Figure 5: Three pairs (top), (middle), and (bottom) of image ex-
amples used for alignment evaluation. (Left) Reference image from
the first frame. (Right) Transformed image of the last frame based
on predefined affine transformation.
5.1. Image mosaicking
Figure 6(a) shows the user interface for selecting matching
points in two image tiles. Users selected one pair of feature
points, one from each tile. Figure 6(b) illustrates the interface
for selecting regions that would be used for centroid calcula-
tion. In order to construct a mosaicked image (as shown in
Figure 3), eight pairs of points or regions had to be selected.
We used a set of nine images from a single physical section
for mosaicking, and the experimental results are summa-
rized in Figure 7 and Table 1, and the t test result compar-
ing the pixel-based and feature-based mosaicking is shown
in Tabl e 2 .
Tables 1 and 2 lead to the following conclusions. First,
fully automatic mosaicking using normalized cross-corre-
lation similarity is the fastest method, followed by semi-
automatic (feature-based) and manual mosaicking. Second,
manual pixel-based image mosaicking is the least accurate
with the highest standard deviation among all methods.
Third, semiautomatic and fully automatic mosaicking meth-
ods are approximately equally accurate. Fourth, experts using
the manual (pixel-based) mosaicking method selected one
pair of points/regions more accurately (small average error)
and consistently (small standard deviation) than novices al-
though it took them more time. Fifth, the difference in mo-
saicking average errors and their standard deviations be-
tween experts and novices using the pixel-based method
8 EURASIP Journal on Applied Signal Processing
(a)
(b)
Figure 6: Software interface for (a) manual mosaicking and (b)
semiautomatic mosaicking with highlighted regions.
01020304050
Human subject
1
10
100
Error (log)
Pixel-based
Feature-based
Automatic
Figure 7: Mosaicking registration errors for all human subjects per-
forming pixel-based (manual) and feature-based (semiautomatic)
tile mosaicking computed according to (3).
disappears when human subjects start using the feature-
based mosaicking method. Sixth, the upper error bound of
each mosaicking method can be estimated in pixels as the
average plus three times standard deviation (99.73% confi-
dence interval), which leads to about 4.12, 5.12, and 27.42
pixel errors for the fully automatic, semiautomatic, and man-
ual methods, respectively. Seventh, the t test result in Table 2
shows that the null hypothesis (no improvement) is rejected
with 99.8% confidence. Finally, the timesaving for experts
Table 2: The paired t test result for errors of the pixel-based and the
feature-based methods in Ta ble 1.
Pixel-based versus feature-based
Degrees of freedom 49
t value 3.019
p value 0.998
and novices using semiautomatic method with respect to
manual method is 41% and 36%, respectively.
Although the feature-based semiautomatic methods or
the intensity-based automatic methods look pretty attrac-
tive, note that there are mosaicking cases when the overlap-
ping area of two adjacent tiles is characterized by either a
lack of detected vascular features (feature-based techniques
fail) or significant spatial intensity heterogeneity (intensity-
based techniques fail). Figure 2 illustrates the former case.
Thus, there is a need to evaluate manual and semi-automated
mosaicking techniques for those cases when the intensity-
based techniques fail. In addition, it is not always the case
that the fully automatic method will outperform the manual
and semiautomatic methods (see Table 1).
5.2. Image alignment
For the image alignment experiments, we used the same user
interfaces for selecting multiple points and regions as shown
in Figure 6. We recommended that human subjects select at
least three points or regions, in such a way that they would
be well spatially distributed in each image but would not be
collinear. If points are close to be collinear, then the affine
transformation parameters cannot be uniquely derived from
a set of linear equations (more unknowns than the num-
ber of equations), which leads to large alignment errors. If
points are locally clustered and do not cover an entire image
spatially, then the affine transformation is very accurate only
in the proximity of the selected points. However, the affine
transformation inaccuracy increases with the distance from
the selected points, which leads to large alignment error since
the error metric takes into account errors across the entire
image area. In order to assess the points selected by a user
in terms of their distribution and collinear arrangement, we
have designed a compactness measure defined as a ratio of
the entire i mage area A
Image
divided by the largest triangular
area a
Triangle
formed from three points in the selected points
(see (6)):
Compactness Measure
= A
Image
/a
Triangle
. (6)
We observed large alignment error when human subjects
selected almost collinear points or locally clustered points
regardless of our recommendations. Figure 8 shows the re-
lationship between compactness and alignment error mod-
eled with a linear fit. We used three different pairs of ad-
jacent physical sections for alignment study, and the error
results of all experiments as a function of human subject tri-
als are shown in Figure 9 andsummarizedinTa ble 3.Thet
test values for comparing the pixel-based and feature-based
mosaicking are shown in Table 4.
Sang-Chul Lee et al. 9
0.511.52 2.5
Compactness (log)
0
0.5
1
1.5
2
2.5
Alignment error (log)
Pixel-based
Feature-based
Figure 8: Illustration of a strong correlation between the compact-
ness measure and the alignment error.
0 10 2030 4050 60 70 80
Human subjects
1
10
100
1000
Error (log)
Pixel-based
Feature-based
Figure 9: Alignment errors for all human trials including pixel-
based (manual) and feature-based (semiautomatic) alignment.
The image alignment results in Figure 8 and Table 3 lead
us to the following conclusions. First, manual (pixel-based)
image alignment is less accurate and less consistent (large
standard deviation) than the semiautomatic (feature-based)
alignment. Based on the t test result in Table 4, the null hy-
pothesis (no improvement) can be rejected with 99.9% con-
fidence. Second, selec tion of (a) collinear features or (b) spa-
tially dense points or regions can have a detrimental effect
on alignment accuracy. Third, experts achieved higher av-
erage alignment accuracy than novices with both methods.
Finally, the difference in alignment errors between experts
and novices using the pixel-based method is significantly re-
duced when human subjects start using the feature-based
alignment method. We should also mention that the major-
ity of human subjects selected only three points or regions for
aligning two images. To demonstrate the effect of the num-
ber of selected points on the registration accuracy, we com-
puted the accuracy by using all matching pairs of features
detected by segmentation (27, 21, and 4 pairs for each test
in Figure 5). The estimated affine transformation results in
1.21, 1.12, and 2.54 pixel error distances for each test data,
respectively. The average pixel error distance is equal to 1.62
pixels and the standard deviation is 0.79. This result indicates
Table 3: A summary of image alignment.
Error (pixels)
Pixel-based Feature-based
expert novice expert novice
Average 17.32 27.98 4.85 5.83
Standard deviation 27.12 43.28 5.63 6.71
Total a vera g e 22.28 5.28
Total standard deviation 35.74 6.11
Upper bound (99.73% confidence) 129.523.61
Table 4: The paired t test result for errors of the pixel-based and the
feature-based methods in Ta ble 3.
Pixel-based versus feature-based
Degrees of freedom 77
t value 4.109
p value 0.999
that (a) more well-matched points l ead to more accurate
alignment, and (b) instructing human subjects to choose the
maximum number of the features detected by segmentation
would lead to higher alignment accuracy.
5.3. Discussion of mosaicking and alignment results
We investigate the main factors behind the summarized ex-
perimental results and present them in this section. First, the
feature-based registration is faster and more accurate than
pixel-based registration for both mosaicking and alignment
problems. Our confidence in accuracy improvement is sup-
ported by the paired t test result. We did not report time
measurements for the alignment problem because the exper-
iments were conducted on multiple computers with different
operating speeds and the reported numbers for mosaicking
provide only indications of true comparative values.
Second, the image alignment upper bound errors (23.61
for semiauto and 129.5 for manual) are much higher than the
mosaicking upper bound errors (4.12 for auto, 5.12 for semi-
auto, and 27.42 for manual). We believe that the main fac-
tors behind these differences are (1) a higher-order complex-
ity of the alignment problem (intensity and spatial structure
variations across slides) in comparison with the mosaicking
problem (intensity variations across tiles), (2) a larger de-
gree of freedom in occurring image alignment transforma-
tions (rotation, scale, shear, and translation) than in mo-
saicking transformations (translation), and (3) significantly
larger sensitivity to human inconsistency in selecting points
(attention level, skills, fatigue, display quality). Human in-
consistency is expressed by a much larger standard deviation
of errors in the case of alignment (35.74 for manual and 6.11
for semiauto) than in the case of mosaicking (6.82 for man-
ual and 0.35 for semiautomatic).
In addition, we would like to add a few comments about
the performance robustness of fully automatic a nd semiau-
tomatic methods. Fully automatic mosaicking method based
10 EURASIP Journal on Applied Signal Processing
on normalized correlation or normalized mutual informa-
tion might not achieve the best performance when corre-
sponding salient features have spatially mismatched intensity
variations. Semiautomatic method based on region centroids
might not be used when closed regions cannot be detected
due to the spatial structure of an imaged specimen or a very
low image quality, for instance, a s mall signal-to-noise (SNR)
ratio and a large amount of intraregion noise. We will investi-
gate in future how to predict accurately centroids of partially
open regions and closed regions with speckle noise internal
to a region.
6. CONCLUSIONS
Wepresentedanaccuracyevaluationof3Dvolumerecon-
struction from CLSM imagery that consists of image mo-
saicking and image alignment registration steps. The con-
tribution of this paper is not only in developing three reg-
istration methods having different levels of automation but
also in proposing a methodology for conducting realistic
evaluations and performing a thorough analysis of the ex-
perimental results. We report accuracy evaluations for (1)
three registration methods including manual (pixel-based),
semiautomatic (region centroid feature-based), and fully au-
tomatic (correlation-based) registration techniques, (2) two
groups of human subjects (experts and novices), and (3)
two types of registration problems (mosaicking and align-
ment). Our study demonstrates significant benefits of au-
tomation for 3D volume reconstruction in terms of achieved
accuracy, consistency of results, and perfor m ance time. In
addition, the results indicate that the differences between
registration accuracy obtained by experts and by novices
disappear with an advanced automation while the absolute
registration accuracy increases. If one is interested in per-
forming data-specific evaluations, then we prepared web-
based tools [21] for better data understanding and analysis
at />ACKNOWLEDGMENTS
This material is based upon work supported by the National
Institute of Health under Grant no. R01 EY10457. The on-
going research is a collaboration between the Department
of Pathology, College of Medicine, University of Illinois at
Chicago, and the Automatic Learning Group, National Cen-
ter for Supercomputing Applications, University of Illinois at
Urbana-Champaign.
REFERENCES
[1] S C. Lee and P. Bajcsy, “Feature based registration of fluores-
cent LSCM imagery using region centroids,” in Medical Imag-
ing, vol. 5747 of Proceedings of the SPIE, pp. 170–181, San
Diego, Calif, USA, February 2005.
[2]C.L.Collins,J.H.Ideker,andK.E.Kurtis,“Laserscan-
ning confocal microscopy for in situ monitoring of alkali-silica
reaction,” Journal of Microscopy, vol. 213, no. 2, pp. 149–157,
2004.
[3] J. B. Pawley, The Handbook of Biological Confocal Microscopy,
Plenum Press, New York, NY, USA, 1990.
[4] B. Zitova and J. Flusser, “Image registration methods: a sur-
vey,” Image and Vision Computing, vol. 21, no. 11, pp. 977–
1000, 2003.
[5] D. L. G. Hill, P. G. Batchelor, M. Holden, and D. J. Hawkes,
“Medical image registration,” Physics in Medicine and Biology,
vol. 46, no. 3, pp. R1–R45, 2001.
[6] L. G. Brown, “A survey of image registration techniques,” ACM
Computing Surveys, vol. 24, no. 4, pp. 325–376, 1992.
[7] L. D. Cohen and I. Cohen, “Deformable models for 3-D med-
ical images using finite elements and balloons,” in Proceedings
of IEEE Computer Society Conference on Computer Vision and
Pattern Recognition (CVPR ’92), pp. 592–598, Champaign, Ill,
USA, June 1992.
[8] A. Goshtasby, “Registration of images with geometric distor-
tions,” IEEE Transactions on Geoscience and Remote Sensing,
vol. 26, no. 1, pp. 60–64, 1988.
[9] M. Tuohy, C. A. McConchie, R. B. Knox, L. Szarski, and A.
Arkin, “Computer-assisted three-dimensional reconstruction
technology in plant cell image analysis; applications of interac-
tive computer graphics,” Journal of Microscopy, vol. 147, no. 1,
pp. 83–88, 1987.
[10] J. B. A. Maintz and M. A. Viergever, “A survey of medical image
registration,” Medical Image Analysis, vol. 2, no. 1, pp. 1–36,
1998.
[11]A.Nocito,J.Kononen,O.P.Kallioniemi,andG.Sauter,
“Tissue microarrays (TMAs) for high-throughput molecular
pathology research,” International Journal of Cancer, vol. 94,
no. 1, pp. 1–5, 2001.
[12] A. Goshtasby, G. C. Stockman, and C. V. Page, “A region-based
approach to digital image transformation with subpixel ac-
curacy,” IEEE Transactions on Geoscience and Remote Sensing,
vol. 24, no. 3, pp. 390–399, 1986.
[13] J. Flusser and T. Suk, “A moment-based approach to registra-
tion of images with affine geomet ric distortion,” IEEE Trans-
actions on Geoscience and Remote Sensing,vol.32,no.2,pp.
382–387, 1994.
[14] H. Li, B. S. Manjunath, and S. K. Mitra, “A contour-based ap-
proach to multisensor image registration,” IEEE Transactions
on Image Processing, vol. 4, no. 3, pp. 320–334, 1995.
[15] W. K. Pratt, “Correlation techniques of image registration,”
IEEE Transactions on Aerospace and Electronic Systems, vol. 10,
no. 3, pp. 353–358, 1974.
[16] P. Viola and W. M. Wells III, “Alignment by maximization of
mutual information,” in Proceedings of the 5th International
Conference on Computer Vision (ICCV ’95), pp. 16–23, Cam-
bridge, Mass, USA, June 1995.
[17] G. Hermosillo, C. Chefd’Hotel, and O. Faugeras, “Variational
methods for multimodal image matching,” International Jour-
nal of Computer Vision, vol. 50, no. 3, pp. 329–343, 2002.
[18] M. Jungke, W. Von Seelenon, G. Bielke, et al., “A system for the
diagnostic use of tissue characterizing parameters in NMR-
tomography,” in Proceedings of Information Processing in Med-
ical Imaging (IPMI ’87), vol. 39, pp. 471–481, 1987.
[19] K. Montgomery and M. D. Ross, “Non fiducial, shaped-based
registration of biological tissue,” in Three-Dimensional Mi-
croscopy: Image Acquisition and Processing III, vol. 2655 of Pro-
ceedings of SPIE, pp. 224–232, San Jose, Calif, USA, January
1996.
[20] C. H. Goulden, Methods of Statistical Analysis, John Wiley &
Sons, New York, NY, USA, 2nd edition, 1956.
Sang-Chul Lee et al. 11
[21] R. Kooper, A. Shirk, S C. Lee, A. Lin, R. Folberg, and P. Bajcsy,
“3D medical volume reconstruction using Web services,” in
Proceedings of IEEE International Conference on Web Services
(ICWS ’05), p. 716, Orlando, Fla, USA, July 2005.
Sang-Chul Lee received his M.S. degree in
computer science from the University of
Illinois at Urbana-Champaign in 2003 and
his B.E. degree in computer science and en-
gineering from the Inha University, Korea,
in 1998. His research interests are in com-
puter vision, robotics, and medical imag-
ing. His research projects include omnidi-
rectional vision-based mobile robot navi-
gation, data fusion for NEES (Network for
Earthquake Engineering Simulation), and 3D volume reconstruc-
tion of CLSM imagery (in collaboration with the Department of
Pathology, University of Illinois at Chicago). He is currently a Re-
search Assistant in the Automated Learning Group, National Cen-
ter for Supercomputing Applications (NCSA), and a Ph.D. can-
didate in computer science at University of Illinois at Urbana-
Champaign.
Peter Bajcsy has earned his Ph.D. de-
gree from the Electrical and Computer En-
gineering Department, University of Illi-
nois at Urbana-Champaign, Ill, 1997, and
M.S. degree from the Electrical Engineer-
ing Department, University of Pennsylva-
nia, Philadelphia, Pa, 1994. He is currently
with the National Center for Supercomput-
ing Applications at the University of Illinois
at Urbana-Champaign, Illinois, working as
a Research Scientist on problems related to automatic transfer of
image content to knowledge. In the past, he had worked on real-
time machine vision problems for semiconductor industry and
synthetic aperture radar (SAR) technology for government con-
tracting industry. He has developed several software systems for au-
tomatic feature extraction, feature selection, segmentation, classifi-
cation, tracking, and statistical modeling from electrooptical, SAR,
laser, and hyperspectral data sets. His scientific interests include im-
age and signal processing, statistical data analysis, data mining, pat-
tern recognition, novel sensor technology, and computer and ma-
chine vision.
Amy Lin received her undergraduate degree in biomedical engi-
neering and M.D. degree from Johns Hopkins University. She is
a Board Certified Ophthalmologist, having completed residency
training in this discipline from the University of Illinois Depart-
ment of Ophthalmology and Visual Sciences. While collaborating
on this research project, she was the Knapp Fellow in ophthalmic
pathology at the University of Illinois at Chicago (UIC). She is cur-
rently serving as a Resident Physician in pathology at UIC.
Robert Folberg received his undergraduate degree from LaSalle
University and his M.D. degree from Temple University. He holds
Board certification in ophthalmology and anatomic pathology. He
is currently the Frances B. Geever Professor and Head of the De-
partment of Pathology at the University of Illinois at Chicago. His
research focuses in part on the the three-dimensional distribution
of extracellular matrix proteins in uveal melanoma.