Báo cáo hóa học: " Research Article Combining Wavelet Transform and Hidden Markov Models for ECG Segmentation" pptx
Bạn đang xem bản rút gọn của tài liệu. Xem và tải ngay bản đầy đủ của tài liệu tại đây (909.55 KB, 8 trang )
Hindawi Publishing Corporation
EURASIP Journal on Advances in Signal Processing
Volume 2007, Article ID 56215, 8 pages
doi:10.1155/2007/56215
Research Article
Combining Wavelet Transform and Hidden Markov
Models for ECG Segmentation
Rodrigo Varej
˜
ao Andre
˜
ao
1
and J
´
er
ˆ
ome Boudy
2
1
Departamento de Engenharia El
´
etrica, Universidade Federal do Esp
´
ırito Santo, Campus de Goiaberas,
Avenue Fernando Ferrari 514, Vit
´
oria 29060-970, Brazil
2
D
´
epartement
´
Electronique et Physique, Institut National des T
´
el
´
ecommunications, 9 rue Charles Fourier,
91011 Evry, France
Received 1 May 2006; Revised 9 October 2006; Accepted 20 November 2006
Recommended by William Allan Sandham
This work aims at providing new insights on the electrocardiogram (ECG) segmentation problem using wavelets. The wavelet
transform has been originally combined with a hidden Markov models (HMMs) framework in order to carry out beat segmenta-
tion and classification. A group of five continuous wavelet functions commonly used in ECG analysis has been implemented and
compared using the same f ramework. All experiments were realized on the QT database, which is composed of a representative
number of ambulatory recordings of several indivi duals and is supplied with manual labels made by a physician. Our main con-
tribution relies on the consistent set of experiments performed. Moreover, the results obtained in terms of beat segmentation and
premature ventricular beat (PVC) detection are comparable to others works reported in the literature, independently of the type
of the wavelet. Finally, through an original concept of combining two wavelet functions in the segmentation stage, we achieve our
best performances.
Copyright © 2007 R. V. Andre
˜
ao and J. Boudy. This is an open access article distributed under the Creative Commons Attribution
License, which permits unrestricted use, distribution, and reproduction in any medium, provided the original work is properly
cited.
1. INTRODUCTION
Electrocardiogram (ECG) analysis requires powerful signal
processing tools to emphasize signal contents. This issue is
still more important when working on signals corrupted by
different sources of noise, which is the case of the ambulatory
ECG.
Since the wavelet transform became popular, many works
in the ECG signal processing field have adopted this tech-
nique in order to perform ECG analysis. For the particular
problem of beat detection and waveform segmentation, we
can mention the works of Li et al. [1] and Sahambi et al. [2]
who employed the quadratic b-spline and the derivative of
the Gaussian functions, respectively. Other works like those
of Senhadji et al. [3], Chazal and Reilly [4], and Andre
˜
ao
et al. [5] used the wavelet transform to extract parameters
which represented better the ECG signal contents. Finally,
the wavelet tr ansform has also been proposed in the ECG
data compression problem [6–8]. In the article of Addison
[9], one can find a good review about the spread use of the
wavelet transform in ECG analysis.
More recently, wavelet transform has been successfully
combined with hidden Markov models (HMMs) provid-
ing reliable beat segmentation results [10]. The approach
proposed by Andre
˜
ao et al. [10]offers some advantages
on current methods, mainly on those based on heuristics
rules.
However, it can be noted that very few works provide
comparative results between different wavelet functions. Ac-
tually, the choice of the wavelet function remains in gen-
eral based on qualitative arguments. This is particularly true
to almost all the systems proposed for the ECG segmenta-
tion problem. We observe that since most of these systems
are based on heuristic rules which are too dependent on the
selected wavelet function, it is difficult to provide the right
framework for comparison.
In this context, this work presents new insights on the
choice of the wavelet function for ECG segmentation. To this
purpose, five continuous wavelet functions are evaluated and
compared using a hidden Markov model framework. It is the
first time that different wavelet functions are compared in
the context of E CG segmentation. Moreover, we originally
2 EURASIP Journal on Advances in Signal Processing
explore the combination of two wavelet functions to segment
and classify beats.
This article is organized as follows: Section 2 presents
the wavelet functions used in our exper iments. The HMM
framework is described in Section 3, followed by the experi-
ments in Section 4 . Finally, the article ends with the discus-
sions and conclusions.
2. WAVELET TRANSFORMS
The wavelet transform represents the signal in a scale-time
space, where each scale can be seen as the result of a pass-
band filtering. T he frequency bands depend on the scale and
also on the type of the chosen wavelet function.
From the mother wavelet ψ
∈ L
2
(R) with zero mean, the
classofwaveletsisthen[11]
ψ
s
(t) =
1
√
s
ψ
∗
−
t
s
,(1)
where
ψ
s
(t) is a wavelet in the scale s and ψ
∗
represents the
wavelet complex conjugate. Thus, the wavelet transform is
given by
Wf(t, s)
= f ∗ ψ
s
(t) =
1
√
s
+∞
−∞
f (t)ψ
∗
τ − t
s
dτ,(2)
where f is the signal and u is translation parameter. Equa-
tion (2) shows that the wavelet transform is the convolu-
tion between the signal and the wavelet function at scale
s. Moreover, it can also be viewed as the correlation com-
putation between the wavelet function and the ECG sig-
nal, which underlines the importance of the mother wavelet
shape.
For implementation purposes, both s and u parameters
are discretized. In this work, the scale s is called dyadic, since
it is a power of 2. On the other hand, the translation param-
eter u varies along the samples of the signal f .
In the Appendix, we descr ibe five selected continuous
wavelets used for ECG analysis [12]: Paul function, Morlet,
first and second derivatives of the Gaussian functions, and
quadratic b-spline function [11, 13]. It is important to note
that some wavelet functions had their par ameters defined af-
ter simulations [12].
Most of the selected wavelets were already employed for
ECG segmentation and parameter extraction [1–5]. Further-
more, some works in the field [1–3] have show n that the
continuous wavelets are suitable for the ECG segmentation
problem. Indeed, the segmentation problem requires a local-
ized and transitory event analysis which consists in pursuing
the time evolution of the signal spectrum contents. In this
case, the sampling rate must be the same to keep the time-
invariance and the temporal resolution at different scales.
It is important to remark that real-valued functions are
better detecting peaks and sharp variations whereas complex
functions evidence oscillations.
Wave let
transform
Mark ovian
approach
Rule-based
system
ECG signal
Parameter
extraction
Beat segmentation
PVC beat detection
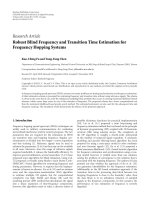
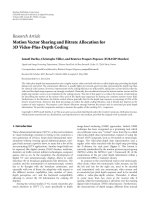
Figure 1: Block diagram of the proposed system for ECG analysis.
3. HIDDEN MARKOV MODEL FRAMEWORK
We have developed an original ECG analysis system based
on hidden Markov models divided in three parts: wavelet
transform, ECG segmentation using HMMs, and premature
ventricular beat detection through a rule-based system as de-
scribed in Figure 1. A complete description of our system is
given in the following.
3.1. Parameter extraction using wavelet transform
An HMM requires a feature extraction stage for the construc-
tion of the observation sequence O. At this point, the wavelet
transform is implemented.
In the segmentation problem, the works based on
wavelets usually select some dyadic scales where one can find
most of the signal contents [1, 2]. Furthermore, the selection
of the scales which are the least affected by noise can lead to
a robust signal representation without necessarily removing
useful information. This is also true in our approach. Thus,
we have decided to select three consecutive dyadic wavelet
scales s
= 2
j
for each wavelet transform [5, 12]: (i) Paul func-
tion: scales j
= 3, 4, and 5; (ii) Morlet: scales j = 3, 4, and 5,
(iii) D OG: scales j
= 1, 2, and 3; (iv) MHat: scales j = 2, 3,
and 4; and (v) Quadratic b-spline function: scales j
= 2, 3,
and 4.
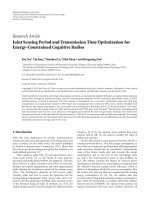
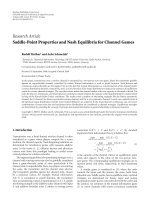
Figure 2 shows an example of an ECG signal 4 s long pro-
cessed by the parameter extraction stage using the Mexican
hat wavelet function.
As a result, the observation sequence gener ated after the
parameter extraction is of the form O
= (
o
1
o
2
··· o
T
),
where T is the signal length in number of samples and each
observation o
t
is a vector of size three, that is, the wavelet
scales have the same time resolution as the original signal.
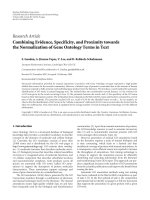
3.2. HMM-based ECG segmentation
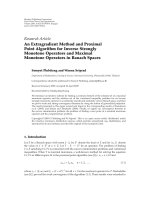
The heartbeat is seen as a sequence of elementary waves and
segments (Figure 3), which respects some heart electrical ac-
tivity constraints. Each wave (P, QRS, T) and segment (PQ,
ST) of a heart b eat is then modeled by a specific left-right
HMM. The isoelectric line between two consecutive beats is
R. V. Andre
˜
ao and J. Boudy 3
4
2
0
ECG (mV)
00.511.522.533.54
Time (s)
(a)
2
0
2
Scale 1
00.511.522.533.54
Time (s)
(b)
2
0
2
Scale 2
00.511.522.533.54
Time (s)
(c)
2
0
2
Scale 3
00.511.522.533.54
Time (s)
(d)
Figure 2: Mexican hat wavelet transform of an ECG signal.
also modeled by an HMM. The concatenation of the individ-
ualHMMsmodelsthewholeECGsignal.
In general, an HMM can be defined as a stochastic ma-
chine characterized by the following parameter set [14]:
λ
= (A, B, π), (3)
where A is the state-transition probability matrix, B repre-
sents the continuous observation densities functions, and π
is the initial state probability vector. The structure of a left-
right HMM is given in Figure 4.
The observations generated in the parameter extraction
part O
= (
o
1
o
2
··· o
T
) are continuous signal represen-
tations modeled by a Gaussian probability density function
of the form
b
j
o
t
=
1
2π
U
j
exp
−
1
2
o
t
− μ
j
T
U
−1
j
o
t
− μ
j
,
(4)
where o
t
is the observation vector at time t, μ
t
is the mean
vector , and U
j
is the covariance matrix at state j. In this work,
the continuous observations are modeled by a single Gaus-
sian probability density function. In fact, histograms of the
Rwave
PQ segment ST segment
Isoelectric line
(ISO)
Pwave
Twave
QRS complex
Figure 3: An illustration of a heartbeat observed in an elect rocar-
diogram. Waveform and segment boundaries are also indicated.
a
11
a
22
a
33
123
a
12
a
23
b
1
(o
t
) b
2
(o
t
) b
3
(o
t
)
Figure 4: An example of a 3-state left-right HMM.
observations values for every state of every HMM were con-
structed, and it was observed that most of them appeared to
be well fitted to a single Gaussian [10].
The HMMs must be prev iously trained, that is, the model
parameters are estimated aiming at learning the waveform
morphologies. Hence, each waveform model was trained on
a set of approximately 700 patterns for each waveform ex-
tracted from the QT database (see Section 4). The training
stage is based on the Baum-Welch method [14], also called
forward-backward algorithm, which is considered as a stan-
dard for HMM training. It locally maximizes the likelihood
P(O
| λ) of the model λ using an iterative procedure, which
is a particular case of the expectation-maximization method
[14].
Finally, we constructed multiple models for each wave-
form, using the HMM likelihood clustering algorithm, since
it improves modeling of complex patterns [10, 15]: four 3-
state HMMs were trained for QRS complex waveforms; two
2-state HMMs for the PQ and ST segments; two 3-state
HMMs for the P wave; two 6-state HMMs for the T wave,
and one 3-state HMM for the isoelectric line (ISO). We note
that the number of states of each model was specified em-
pirically after some simulations, following a compromise on
complexity versus performance.
The beat segmentation procedure consists in matching
the HMMs to the ECG waveform patterns. This is typically
performed by the Viterbi decoding algorithm [10, 14], which
relateseachobservationO
t
to an HMM state following a
maximum likelihood criteria and respecting the beat model
structure (see Figure 5).
In fact, the beat model of Figure 5 is a connected HMM
structure, where the transition probability among models is
4 EURASIP Journal on Advances in Signal Processing
123
ISO P PQ QRS ST T
Figure 5: Beat model representing all possible transitions among
waveform models. Each waveform model (ISO: isoelectric line, P,
PQ, QRS, ST, and T) corresponds to a specific left-right HMM [10].
uniform. Thus, during segmentation, the Viterbi algorithm
works in two dimensions: time and waveform model. As a
result, the Viterbi algorithm provides not only the best state
sequence of each model but also the best sequence of con-
nected waveform models.
We have also implemented a nonsupervised training pro-
cedure in order to keep tracking of new shapes and to adapt
accordingly the HMM to them during real-time analysis in
an ambulatory ECG. Thus, during ECG segmentation, the
waveforms detected are grouped according to their label.
Then, the HMM is retrained when enough number of seg-
mented examples is achieved. More details on our HMM
training procedure can be found in [10].
3.3. Beat classification
This last stage is intended to give more elements to com-
pare the wavelet functions. Indeed, besides the fact that the
wavelet must be good in performing waveform segmenta-
tion, the wavelet function must also be appropriate to char-
acterize different waveform morphologies.
The beat classification stage implemented here only clas-
sifies premature ventricular beats which are characterized by
an interval between two consecutive QRS-complexes (R-R
interval) shorter than the normal and a QRS-complex larger
than the normal of the patient. For that, two main pieces of
information generated by the segmentation stage are taken
into account: Q RS-complex mor phology and the R-R inter-
val. The later is directly calculated after segmentation. The
distinction between normal and premature R-R intervals is
done through a threshold τ
RR
calculated as follows:
μ
RR
=
1
N
RR
5
k=1
RR
NORMAL
[k], τ
RR
= α
RR
× μ
RR
,(5)
where RR
NORMAL
[k] is the vector of the last five intervals clas-
sified as normal, μ
RR
is the average of the normal R-R inter-
vals, and α
QRS
is a constant.
On the other hand, QRS-complex morphology is repre-
sented as a likelihood measure. First of all, the HMM which
segments most of QRS-complexes in the beginning of the
recording is taken as the individual dominant model. Hence,
when the QRS-complex of a normal beat is segmented, its
likelihood according to the dominant HMM will be high,
while the likelihood for the ventricular beat will be low. To
obtain the border line separating both QRS-complex classes,
we define a likelihood threshold τ
QRS
. The threshold τ
QRS
is
calculated through the equations below:
P
μ
=
1
10
10
n=1
P
o
n
| λ
d
, τ
QRS
= α
QRS
× P
μ
,(6)
where o
n
represents the observation sequence of the nth
QRS-complex segmented by the individual dominant model
λ
d
, P
μ
is the mean likelihood computed over the ten last ex-
amples segmented by λ
d
,andα
QRS
is a constant. All constant
values are determined after simulations on a training set aim-
ing at reducing the error rate.
Besides the fact that each stage is performed in only one
lead, we took advantage on the two-lead database used in
this work by implementing a simple fusion strategy. Thus,
the QRS-complexes detected in each lead are first compared
in order to remove false positives. Then, the beats are clas-
sified considering the information of both leads. The beat is
classified as PVC if there is at least one lead where such a
phenomenon occurs, otherwise the beat is detected as nor-
mal.
4. EXPERIMENTS
All experiments have been realized on the QT database [16],
which is composed of a representative number of ambulatory
recordings of several individuals and is supplied with manual
labels made by a physician. The manual labels are used as a
reference to compute the global performance of each wavelet
function. It contains 105 two-channel records of 15 minutes,
sampled at 250 Hz. All files include annotations of waveform
peaks and boundaries in at least 30 beats. Moreover, 82 files
have their all QRS complexes annotated and the beat class
specified.
A set of experiments has been performed in order to eval-
uate each wavelet f unction in a real world application. Two
main indicators have been taken into account: (i) waveform
detection and precision, and (ii) premature ventricular beat
(PVC) detection accuracy.
For the first experiment, the results are presented in
terms of the following:
(i) precision: the onset and offset points of every waveform
detected are compared to the manual labeled ones. As
a result, we obtain a mean μ and a standard deviation σ
in millisecond of the errors between our approach and
the physician (the standard deviation for all recordings
is computed as the average of the standard deviations
of each recording);
(ii) waveform detection: it gives the percentage of wave-
forms correctly detected, according to the labels made
by a physician.
R. V. Andre
˜
ao and J. Boudy 5
Table 1: Comparative waveform segmentation precision in milliseconds (mean μ and standard devi ation σ).
Wavelet
Precision (ms)
Pwave QRS-complex Twave
Onset Offset Onset Offset Onset Offset
μσ μσμσ μσμσμσ
DOG 13.416.3 2.211.0 13.37.7 1.68.9 −18.410.1 −17.123.6
MHat
15.713.6 −2.011.0 3.77.5 −9.09.0 −18.97.9 −5.120.7
Quadratic b-spline
13.815.1 4.610.7 12.67.8 −6.28.9 −20.39.0 −6.923.4
Morlet
30.913.6 4.110.5 1.87.8 −15.18.8 −35.97.3 −28.038.8
Paul real
21.617.4 −0.710.4 8.87.9 −15.38.8 −30.17.5 −26.821.1
Paul magnitude
17.515.0 3.511.6 15.27.5 0.49.1 −19.110.5 −18.622.6
DOG + MHat
14.014.0 5.210.4 14.87.4 −5.98.7 −9.98.7 1.519.0
Table 2: Percentage of waveforms correctly detected according to
the manual labels of the QT database.
Wavelet
Detection (%)
P wave QRS T wave
DOG 90.29 99.97 99.97
MHat
91.14 100.00 99.97
Quadratic b-spline
89.92 99.94 99.94
Morlet
88.92 99.78 99.77
Paul real
91.86 100.00 99.97
Paul magnitude
86.66 100.00 99.97
DOG + MHat
95.05 99.97 99.97
Number of manual
labels of the QT database
3194 3623 3543
The performance results for each wavelet using all 105 re-
cordings as a test set are shown in Tables 1 and 2.Itisimpor-
tant to remark that the results consider only the channel 1 of
each recording, differently from [10] where the best channel
was retained. In addition, for the Paul complex wavelet, we
have performed the experiments using both the real part and
the magnitude of the wavelet transform.
For the second experiment, the performance is measured
by two criteria in accordance the recommendations to assess
performance of beat detection approaches [17]: sensibility
and positive predictivity. Sensibility (Se) is related to the frac-
tion of events correctly detected,
Se
=
TP
TP + FN
,(7)
where TP (t rue positive) is the number of matched events
and FN (false negative) is the number of events that were not
detected by the approach. The positive predictivity (PP)gives
the ability of detecting true events,
PP
=
TP
TP + FP
,(8)
where FP (false positive) is the number of events detected
by the approach and nonmatched to the manual labels. In
this case, 59 recordings composed the test set, since the other
19 ones were required to estimate the variables for the PVC
detection approach. The results for all wavelets are given in
Tabl e 3.
In general, the Morlet wavelet presents a very good sta-
bility in the waveform position, except for the T wave,
since the standard deviation σ is one of the lowest. On the
other hand, its mean detection error μ is very high for all
waveforms. Moreover, the P wave, QRS complex, and PVC
detection results are the worst comparing with the other
wavelets.
The DOG wavelet (first derivative of the Gaussian func-
tion) shows a high QRS complex and PVC detection sensibil-
ity.
The real component of the Paul wavelet transfor m has
obtained a high P wave detection rate, while the PVC wave
detection performance is the poorest. On the other hand, ex-
actly the opposite has been achieved by the magnitude of this
wavelet transform.
The MHat wavelet (second derivative of the Gaussian
function) is better for PVC detection and presents the best
overall performance.
Finally, fusing both DOG and MHat wavelets in the pa-
rameter extraction stage leaded to the best performance re-
sults. In this particular case, the fusion strategy consisted in
combining the observation vector of each wavelet, that is, the
observation vector at time t o
t
is a vector of size six.
5. DISCUSSION
The P wave detection requires a localized analysis both in
time and frequency. There is no wavelet with b oth proper-
ties. Comparing the Morlet wavelet (best localization in fre-
quency) with MHat and the real part of the Paul wavelet (best
localization in time), the latest outperforms the first one, par-
ticularly in the number of detected P waves.
The best function for QRS complex detection must have
a similar shape and presents noise robustness. Comparing
Paul, MHat, and DOG wavelets, we observe that these func-
tions are highly correlated w ith the QRS complex. Moreover,
in both cases, the use of multiple scales increased noise ro-
bustness.
6 EURASIP Journal on Advances in Signal Processing
Table 3: PVC (premature ventricular contraction) beat detection
performance (in terms of sensibility Se and p ositive predictivity PP)
on a test set of 59 recordings.
Wavelet
PVC detection
TP FP FN Se (%) PP (%)
DOG 1169 206 340 85.02 77.47
MHat
1254 121 183 91.20 87.27
Quadratic
b-spline
927 448 87 67.42 91.42
Morlet 940 435 156 68.36 85.77
Paul real
871 504 773 63.35 52.98
Paul
magnitude
978 397 175 71.13 84.82
DOG + MHat 1242 133 103 90.33 92.34
The T wave detection depends on the QRS detection and
suffers from noise interference much less than the P wave.
The difficulty relies on the T wave offset detection, since it
is easily confused with the baseline. In this case, the MHat
achieved the best result and the Morlet wavelet achieved the
worst one.
From this preliminary discussion, we conclude that each
wavelet function has its own particularities. As the DOG and
MHat wavelets seemed to be the most attractive ones, we
have combined both in the parameter extraction stage. The
wavelet combination results shown in Tables 1, 2,and3 are
better than the individual ones, especially for P wave and
PVC detection. Indeed, improving the parameter extraction
strategy, the ECG signal is better represented, and hence the
waveforms are better discriminated.
6. CONCLUSION
This work has addressed the problem of choosing the right
wavelet transform for ECG segmentation and classification
using an HMM framework. For that, a group of five contin-
uous wavelet functions commonly used in the ECG field has
been compared: quadratic b-spline, first and second deriva-
tives of the Gaussian function, Morlet, and Paul function.
The wavelet transform acted as the parameter extraction
stage necessary to build the observation sequence of our orig-
inal HMM-based segmentation approach. We have also im-
plemented a beat classification stage, through a simple set of
rules, with the purpose of giving more elements on the choice
of the wavelet function.
All experiments have been carried out using the QT
database, which is composed of manual labels of beat wave-
forms and beat classes. The Mexican hat wavelet has been
the one which presented the best overall performance. Ad-
ditionally, the results obtained in terms of beat detection
and segmentation and PVC beat detection are also com-
parable to others works reported in the literature [10, 18,
19].
At last, we have explored the complementarity of two se-
lected wavelet functions, namely, the first derivative of the
0.2
0.15
0.1
0.05
0
0.05
0.1
0.15
0.2
5 4 3 2 10 1 2 3 4 5
Imaginary part
Real part
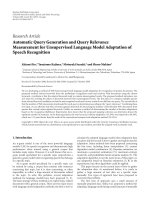
Figure 6: The real and imaginary components of the fourth-order
Paul wavelet.
Gaussian and the Mexican hat functions, by combining their
wavelet transforms in the parameter extract ion stage, achiev-
ing our best performance.
APPENDIX
Paul wavelet
The Paul wavelet has the form
ψ(t)
=
2
m
i
m
m!
π(2m)!
(1
− i × t)
−(m+1)
,(A.1)
where m is the function order and t
∈ R.Thisfunctionhas
the best time resolution among the continuous wavelet func-
tions. Figure 6 shows the real and imaginary components of
the Paul function with m
= 4.
Morlet wavelet
The Morlet function (Figure 7) is a complex wavelet defined
as
ψ(t)
=
1
4
√
π
e
iw
o
t
e
−t
2
/2
,(A.2)
where w
o
is the central frequency. Figure 7 illustrates the real
part of the Morlet function with w
o
= 6asusedinourexper-
iments.
Derivative of Gaussian wavelet
This family of functions is built from the Gaussian function
f (t)
= C
p
e
−t
2
/2
(A.3)
R. V. Andre
˜
ao and J. Boudy 7
0.15
0.1
0.05
0
0.05
0.1
5 4 3 2 10 1 2 3 4 5
Figure 7: The real part of the Morlet wavelet with w
o
= 6.
0.4
0.3
0.2
0.1
0
0.1
0.2
0.3
5 4 3 2 1012345
DOG
MHAT
Figure 8: First and second derivatives of the Gaussian function
(DOG and MHat, resp.).
by taking the pth derivative of f ∈ L
2
(R). The constant C
p
is
such that
f
(p)
2
= 1, (A.4)
where f
(p)
is the pth derivative of f . Figure 8 shows the first
and the second derivatives of the Gaussian function, which
will be called in this work DOG and MHat,respectively.
Quadratic b-spline wavelet
The quadratic b-spline wavelet (see Figure 9)hasitsFourier
transform of the form
ψ(ω) = jω
sin(ω/4)
ω/4
4
. (A.5)
0.5
0.4
0.3
0.2
0.1
0
0.1
0.2
0.3
0.4
0.5
5 4 3 2 10 1 2 3 4 5
Figure 9: Quadratic b-spline function.
It corresponds to the derivative of a b ox spline of degree m =
3. The box spline is obtained convolving the basic unit step
function 1
[0,1)
with itself (m +1)times.
ACKNOWLEDGMENTS
This work was supported by the CNPq and in part by FAPES.
REFERENCES
[1] C. Li, C. Zheng, and C. Tai, “Detection of ECG character-
istic points using wavelet transforms,” IEEE Transactions on
Biomedical Engineering, vol. 42, no. 1, pp. 21–28, 1995.
[2] J.S.Sahambi,S.N.Tandon,andR.K.P.Bhatt,“Usingwavelet
transforms for ECG characterization. An on-line digital signal
processing system,” IEEE Engineering in Medicine and Biology
Magazine, vol. 16, no. 1, pp. 77–83, 1997.
[3] L. Senhadji, G. Carrault, J. J. Bellanger, and G. Passariello,
“Comparing wavelet transforms for recognizing cardiac pat-
terns,” IEEE Engineering in Medicine and Biology Magazine,
vol. 14, no. 2, pp. 167–173, 1995.
[4] P. Chazal and R. B. Reilly, “A comparison of the use of different
wavelet coefficients for the classification of the electrocardio-
gram,” in Proceedings of the 15th International Conference on
Pattern Recognition (ICPR ’00), vol. 2, pp. 255–258, Barcelona,
Spain, September 2000.
[5] R. V. Andre
˜
ao,B.Dorizzi,P.C.Cortez,andJ.C.M.Mota,
“Efficient ECG multi-level wavelet classification through neu-
ral network dimensionality reduction,” in Proceedings of the
12th IEEE Workshop on Neural Networks for Signal Processing
(NNSP ’02), pp. 395–404, Martigny, Switzerland, September
2002.
[6] R. Besar, C. Eswaran, S. Sahib, and R. J. Simpson, “On the
choice of the wavelets for ECG data compression,” in Proceed-
ings of IEEE Internat ional Conference on Acoustics, Speech and
Signal Processing (ICASSP ’00), vol. 6, pp. 3614–3617, Istanbul,
Turkey, June 2000.
[7] B. Castro, D. Kogan, and A. B. Geva, “ECG feature extraction
using optimal mother wavelet,” in Proceedings of the 21st IEEE
Convention of the Electrical and ELectronic Engineers in Israel,
pp. 346–350, Tel-Aviv, Israel, April 2000.
8 EURASIP Journal on Advances in Signal Processing
[8] S. M. Ahmed, A. Al-Shrouf, and M. Abo-Zahhad, “ECG data
compression using optimal non-orthogonal wavelet trans-
form,” Medical Engineering and Physics, vol. 22, no. 1, pp. 39–
46, 2000.
[9] P. S. Addison, “Wavelet transforms and the ECG: a review,”
Physiological Measurement, vol. 26, no. 5, pp. R155–R199,
2005.
[10] R. V. Andre
˜
ao, B. Dorizzi, and J. Boudy, “ECG signal anal-
ysis through hidden Markov models,” IEEE Transactions on
Biomedical Engineering, vol. 53, no. 8, pp. 1541–1549, 2006.
[11] S. Mallat, A Wavelet Tour of Signal Processing, Academic Press,
San Diego, Calif, USA, 1998.
[12] P. Bhatia, J. Boudy, and R. V. Andre
˜
ao, “Wavelet transforma-
tion and pre-selection of mother wavelets for ECG signal pro-
cessing,” in Proceedings of the 24th IASTED International Con-
ference on Biomedical Engineering, pp. 390–395, Innsbruck,
Austria, February 2006.
[13]C.TorrenceandG.P.Compo,“Apracticalguidetowavelet
analysis,” Bulletin of the American Meteorological Society,
vol. 79, no. 1, pp. 61–78, 1998.
[14] L. R. Rabiner and B H. Juang, Fundamentals of Speech Recog-
nition, Prentice-Hall, Englewood Cliffs, NJ, USA, 1993.
[15] L. R. Rabiner, C. H. Lee, B. H. Juang, and J. G. Wilpon, “HMM
clustering for connected word recognition,” in Proceedings of
IEEEInternationalConferenceonAcoustics,SpeechandSignal
Processing (ICASSP ’89), vol. 1, pp. 405–408, Glasgow, UK,
May 1989.
[16] P. Laguna, R. G. Mark, A. Goldberger, and G. B. Moody, “A
database for evaluation of algorithms for measurement of QT
and other waveform intervals in the ECG,” in Proceedings of
the 24th Annual Meeting on Computers in Cardiology (CIC ’97),
pp. 673–676, Lund, Sweden, September 1997.
[17] ANSI/AAMI, “Testing and reporting performance results of
cardiac rhythm and ST segment,” ANSI/AAMI EC 57-293.Ar-
lington: AAMI, 1998, 37 p.
[18] J. P. Mart
´
ınez, R. Almeida, S. Olmos, A. P. Rocha, and P. La-
guna, “A wavelet-based ECG delineator: evaluation on stan-
dard databases,” IEEE Transactions on Biomedical Engineer ing,
vol. 51, no. 4, pp. 570–581, 2004.
[19] D. A. Coast, R. M. Stern, G. G. Cano, and S. A. Briller, “An
approach to cardiac arrhythmia analysis using hidden Markov
models,” IEEE Transactions on Biomedical Engineering, vol. 37,
no. 9, pp. 826–836, 1990.
Rodrigo Varej
˜
ao Andre
˜
ao was born in
Vit
´
oria, Esp
´
ırito Santo, Brazil, in 1975. He
received the B.E. degree in electrical en-
gineering from the Federal University of
Esp
´
ırito Santo, Brazil, in 1998, the M.S.
degree in telecommunications form the
State University of Campinas, Brazil, in
2000, and the Ph.D. degree in telecom-
munications from the Institut National des
T
´
el
´
ecommunications, France, in 2004. He is
currently a Postdoctoral Researcher in the Electrical Department
at Federal University of Esp
´
ırito Santo, Brazil. His professional re-
search interests are in signal processing, biological signal process-
ing, pattern recognition, and telemedicine.
J
´
er
ˆ
ome Boudy received Docteur-Ingenieur
degree in 1988, graduated in 1983 as In-
g
´
enieur de l’Institut Catholique des Arts
et M
´
etiers de Lille (France), he was from
1984 to 1988 with the Laboratoire des Sig-
naux et Syst
`
emes of Nice-Sophia Antipolis
(U.A CNRS) working in the area of adap-
tive filtering for underwater acoustics sig-
nal processing. Then in 1988, he joined
the Speech Processing Department of Ma-
tra Nortel Communications where he has worked for more than
12 years on noise-robust speech recognition and adaptive filtering
applied on the problem of echo and noise signals cancellation for
handsfree telecommunications. In February 2000, the Speech Pro-
cessing Department of Matra Nortel was transferred to Lernout
& Hauspie Speech Products NV (L&H), and he took in charge,
at the L&H Technologies Division, the responsibility to coordi-
nate RTD European projects focused on speech technology. In May
2001, he joined Philips Consumer Communications in Le Mans,
the Telecom Branch of Philips Group, as Competence Team Leader
on speech recognition activity. Recently in January 2002, he joined
INT as Researcher and Assistant Professor in signal processing for
the Electronic & Physics Department, where his new domain of in-
terest is the remote home monitoring of vital/physiological signals
for the emergency forecast (“televigilance” application), in partic-
ular the ECG signal filtering, analysis, and pattern recognition.