Báo cáo hóa học: " Research Article A Principal Component Regression Approach for Estimating Ventricular Repolarization Duration Variability" pot
Bạn đang xem bản rút gọn của tài liệu. Xem và tải ngay bản đầy đủ của tài liệu tại đây (3.8 MB, 10 trang )
Hindawi Publishing Corporation
EURASIP Journal on Advances in Signal Processing
Volume 2007, Article ID 58358, 10 pages
doi:10.1155/2007/58358
Research Article
A Principal Component Regression Approach for Estimating
Ventricular Repolarization Duration Variability
Mika P. Tarvainen,
1
Tomi Laitinen,
2
Tiina Lyyra-Laitinen,
2
Juha-Pekka Niskanen,
1
and Pasi A. Karjalainen
1
1
Department of Physics, University of Kuopio, P.O. Box 1627, 70211 Kuopio, Finland
2
Department of Clinical Physiology and Nuclear Medicine, Kuopio University Hospital, P.O. Box 1777, 70211 Kuopio, Finland
Received 28 April 2006; Revised 27 September 2006; Accepted 29 October 2006
Recommended by Pablo Laguna Lasaosa
Ventricular repolarization duration (VRD) is affected by heart rate and autonomic control, and thus VRD varies in time in a similar
way as heart rate. VRD variability is commonly assessed by determining the time differences between successive R- and T -waves,
that is, RT intervals. Tra ditional methods for RT interval detection necessitate the detection of either T-wave apexes or offsets. In
this paper, we propose a principal-component-regression- (PCR-) based method for estimating RT variability. The main benefit
of the method is that it does not necessitate T-wave detection. The proposed method is compared with traditional RT interval
measures, and as a result, it is observed to estimate RT variability accurately and to be less sensitive to noise than the traditional
methods. As a specific application, the method is applied to exercise electrocardiogram (ECG) recordings.
Copyright © 2007 Mika P. Tarvainen et al. This is an open access article distributed under the Creative Commons Attribution
License, which permits unrestricted use, distribution, and reproduction in any medium, provided the original work is properly
cited.
1. INTRODUCTION
Ventricular repolarization duration (VRD) is known to be
affected by heart rate (HR) and autonomic control (mainly
through sympathetic branch), and thus VRD varies in time
in a similar way as HR [1, 2]. The time interval between Q-
wave onset and T-wave offset in an electrocardiogram (ECG),
that is, QT interval, corresponds to the total ventricular activ-
ity including both depolarization and repolarization times,
and thus QT interval may be used as an index of VRD. It
has been suggested that abnormal QT v ariability could be a
marker for a group of s evere cardiac diseases such as ventric-
ular arrhythmias [3]. In addition, it has been suggested that
QT variability could yield such additional information which
cannot be observed from HR variability [4].
Due to the difficulty in fixing automatically the Q-wave
onset in VRD determination, RT interval is typically used in-
steadofQTinterval[5, 6].TheRTintervalcanbedefinedas
the interval from R-wave apex either to T-wave apex (RT
apex
)
or to T-wave offset (RT
end
).TheT-waveapexistypicallyfixed
by fitting a parabola around the T-wave maximum [5]. The
T-wave offset, on the other hand, can be fi xed with a number
of methods. In threshold methods, the T-wave offset is fixed
as an intercept of the T-wave or its derivative with a threshold
level above the isoelectric line [7–9]. In the fitting methods,
the T-wave offset is fixed, for example, as an intercept of a line
fitted to T-wave downslope with the isoelectric line [8, 10].
The automatic RT interval measures have been compared
with manual measurements, for example, in [11, 12]. In ad-
dition, different automatic methods for RT interval estima-
tion have been compared, for example, in [8, 9, 13]. Even
though the selection of the optimal RT interval measure was
found to depend on the type of the simulated noise, in most
of the cases, RT
apex
measure gave the most accurate results.
The RT
apex
measure is also relatively easy to implement, and
thus it has been sometimes preferred to RT
end
measures, al-
though the variability of the T-wave downslope has been
found to hide important physiological information [10, 14].
In this paper, we propose a robust method for estimat-
ing the variation in the RT interval. The method is based on
principal component regression (PCR) and it does not ne-
cessitate T-wave detection. In the method, T-wave epochs are
extracted from ECG in respect of R-wave fiducial points and
the variability in the RT interval is reflected on the princi-
pal components of the epoch data. It should be noted that
the proposed method does not give absolute values for RT
interval, but estimates the variation in the RT interval. The
variability estimates obtained with the method are compared
with traditional RT
apex
and RT
end
measures. The noise s ensi-
tivity of the proposed method is evaluated by examining the
2 EURASIP Journal on Advances in Signal Processing
effect of simulated Gaussian noise on the spectral character-
istics of the estimated RT variability series. As a specific ap-
plication, the proposed method is final ly applied to exercise
ECG and the interrelationships between RR and RT intervals
variability are considered.
2. MATERIALS AND METHODS
The estimation of RT interval is not always a simple task. T-
wave is a smooth waveform that can be hard to detect accu-
rately in conditions where the signal-to-noise ratio (SNR) is
not high enough. Several artifacts also affect the reliability of
the detection remarkably. In this section, we first describe the
performed ECG measurements and the three traditional RT
interval measurement methods which are used here as refer-
ence methods. After that, the PCR-based method for estimat-
ing RT interval variability and the approach for evaluating
the noise sensitivity of different RT measures are described.
2.1. ECG measurements
The ECG measurements utilized in this paper consist of
a single resting ECG measurement and five exercise ECG
measurements. In al l measurements, ECG electrodes were
placed according to the conventional 12-lead system with the
Mason-Likar modification. For analysis, the chest lead 5 (V5)
was chosen. The resting ECG was measured from a healthy
young male in relaxed conditions by using a NeuroScan sys-
tem (Compumedics Limited, Tex, USA) with SynAmps
2
am-
plifier. The sampling rate of the ECG s ignal was 1000 Hz.
The exercise ECG recordings were performed by using a
Cardiovit CS-200 ergospirometery system (Schiller AG) with
Ergoline Ergoselect 200 K bicycle ergometer. The sampling
rate of the ECG in the exercise recordings was 500 Hz. Five
healthy male subjects participated in the test (aged 27 to 33).
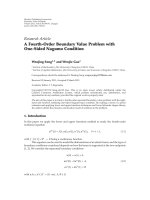
In the stepwise test procedure shown in Figure 1, the subject
first lay supine for three minutes and then sat up on the bicy-
cle for the next three minutes. After that, the subject started
the actual exercise part in which the load of the bicycle in-
creased with 40 W every three minutes. The starting load was
40 W and the subject continued exercise until exhaustion. Af-
ter the subject indicated that he could not go on anymore,
the exercise test was stopped and a 10-minute recovery pe-
riod was measured.
2.2. Traditional RT interval measures
Three different RT interval measurement methods are con-
sidered here, one RT
apex
and two RT
end
measures. First of
all, it should be noted that especially the RT
end
measures
are very sensitive to ECG baseline drifts, and thus these low-
frequency trend components should be removed before anal-
ysis. Here, a 5th-order Butterworth highpass filter with cut-
off frequency at 1 Hz was applied to remove the ECG baseline
drifts. Secondly, all measures presume R-wave apex detection
which is accomplished by using a QRS detection algorithm
similar to the one presented in [15]. Once the R-wave apex
is fixed, the T-wave apex or offset is searched from a window
2000160012008004000
Time (s)
0
40
80
120
160
200
HR (beats/min)
0
40
80
120
160
200
240
Load (W)
S1 S2 S3 S4 S5
S1
= lying supine
S2
= sitting
S3
= 80 W load
S4
= peak exercise
S5
= recovery
Figure 1:Theexercisetestprotocolforsubject1showingtheheart
rate and bicycle load as functions of t ime. The samples selected for
analysis S1, S2, , S5 are indicated on top.
whose onset and offset (relative to the R-wave apex) are given
as
[100, 500] ms if RR
av
> 700 ms,
100, 0.7 · RR
av
ms if RR
av
< 700 ms,
(1)
where RR
av
is the average RR interval within the whole an-
alyzed ECG recording. Similar window definition was used,
for example, in [7].
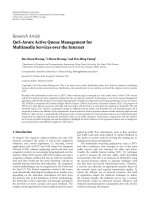
The first considered method measures the time differ-
ence between R- and T-wave apexes as shown on Figure 2(a).
First, the maximum of a lowpass filtered ECG is searched
from window specified in (1). As the lowpass filter, a 20-
millisecond moving average FIR filter (for sampling rate of
1000 Hz, filter order is 20, filter coefficients b
j
= 1/20 for
all j
= 1, , 20, and cutoff frequency ∼22 Hz) was applied.
Then, to reduce the effect of noise, a parabola is fitted around
the T-wave maximum within a 60-millisecond frame and the
T-wave apex is fixed as the maximum of the fitted parabola.
This RT interval measure is here denoted by RT
apex
.
The second considered method measures the time dif-
ference between R-wave apex and T-wave offset by using a
threshold technique as shown on Figure 2(b). To fix the T-
wave offset, the T-wave is first lowpass filtered by using the
same moving average filter as in RT
apex
measure. The T-wave
offset is then fixed as the intercept of the lowpass filtered T-
wave downslope with the threshold level above the isoelectric
line. The isoelectric line is obtained as the amplitude value
corresponding to the highest peak in the ECG histogram and
the threshold level is set to 15% of the corresponding T-
wave maximum. This RT interval measure is here denoted
by RT
(t)
end
,wheret indicates threshold.
The third considered RT interval measure utilizes a line
fit in T-wave offset determination as shown on Figure 2(c).
The line fit is obtained as the steepest tangent of the lowpass
Mika P. Tarvainen et al. 3
0.60.50.40.30.20.100.1
Time (s)
0.3
0
0.3
0.6
0.9
1.2
1.5
ECG (mV)
RT
apex
(a)
0.60.50.40.30.20.100.1
Time (s)
0.3
0
0.3
0.6
0.9
1.2
1.5
ECG (mV)
RT
(t)
end
(b)
0.60.50.40.30.20.100.1
Time (s)
0.3
0
0.3
0.6
0.9
1.2
1.5
ECG (mV)
RT
( f)
end
(c)
Figure 2: The three RT interval measurement methods considered:
(a) RT
apex
,(b)RT
(t)
end
, and (c) RT
( f)
end
. The dashed line on the two
bottommost axes indicates the isoelectric line.
filtered T-wave downslope (the same moving average filter as
above). The T-wave offset is then fixed as the intercept of this
tangent with the isoelectric line, where the isoelectric line is
obtained as above. This RT interval measure is here denoted
by RT
( f )
end
,where f indicates fitting.
2.3. Principal component regression approach
In the principal component regression, the vector contain-
ing the measured signal is presented as a weighted sum of
orthogonal basis vectors. The basis vectors are selected to be
the eigenvectors of either the data covariance or correlation
matrix. The central idea in PCR is to reduce the dimension-
ality of the data set, while retaining as much as possible of the
variance in the original data [16].
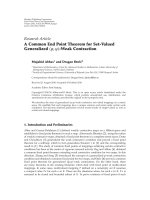
In the PCR-based approach, the ECG measurement is
first divided into adequate epochs such that each epoch in-
cludes a single T-wave. The T-wave epochs are extracted by
applying the window specified in (1) for each heart-beat
21.510.50
Time (s)
0
0.5
1
1.5
ECG (mV)
z
1
z
2
z
3
100 ms onset
First T-wave epoch
0.50.40.30.20.1
Time (s)
0
200
400
600
Epoch number
0.1
0
0.1
0.2
0.3
T-wave (mV)
Figure 3: Extraction of T-wave epochs from the ECG recording.
period as shown in Figure 3. Note that the average RR in-
terval RR
av
in (1) is calculated over the whole analyzed ECG
recording, and thus the length of the extracted T-wave epochs
is constant. Let us denote such jth epoch with a length N col-
umn vector
z
j
=
⎛
⎜
⎜
⎝
z
j
(1)
.
.
.
z
j
(N)
⎞
⎟
⎟
⎠
. (2)
As an observation model, we use the additive noise model
z
j
= s
j
+ e
j
,(3)
where s
j
is the noiseless ECG signal corresponding to jth
epoch and e
j
is the additive measurement noise. The mea-
surement noise is assumed to be a stationary zero-mean pro-
cess. If we have M T-waves within the ECG recording, the
signals s
j
will span a vector space S which will be at most of
min
{M, N} dimensions. In the case that the T-wave epochs
are rather similar, the dimension of this vector space will
be K
≤ min{M, N} and epochs s
j
can be well approxi-
mated with some lower-dimensional subspace of S.Thus,
each epoch can be expressed as a linear combination
z
j
= H
S
θ
j
+ e
j
,(4)
where H
S
= ( ψ
1
, ψ
2
, , ψ
K
)isanN × K matrix of basis vec-
tors which span the K-dimensional subspace of S and θ
j
is
a K
× 1 column vector of weights related to jth epoch. By
defining an N
× M measurement mat rix z = (z
1
, z
2
, , z
M
),
the observation model (4) can be written in the form
z
= H
S
θ + e,(5)
4 EURASIP Journal on Advances in Signal Processing
where θ = (θ
1
, θ
2
, , θ
M
)isaK × M matrix of weights and
e
= ( e
1
, e
2
, , e
M
)isanN × M matrix of error terms.
Thecriticalpointintheuseofmodel(5) is the selection
of the basis vectors ψ
k
. A variety of ways to select these basis
vectors exist, but here a special case, that is, principal compo-
nent regression, is considered. In PCR, the basis vectors are
selected to be the eigenvectors v
k
of either the data covariance
or correlation matrix. Here the correlation matrix which can
be estimated as
R
=
1
M
zz
T
(6)
is utilized. The eigenvectors and the corresponding eigenval-
ues can be solved from the eigendecomposition. The eigen-
vectors of the correlation matrix are orthonormal, and there-
fore, the ordinary least-squares solution for the parameters θ
becomes
θ
PC
= H
T
S
z (7)
and the T-wave estimates could be computed from
z
PC
= H
S
θ
PC
. (8)
Quantitatively, the first basis vector is the best mean-
square fit of a single waveform to the entire set of epochs.
Thus, the first eigenvector is similar to the mean of the
epochs and the corresponding parameter estimates or prin-
cipal components (PCs)
θ
j
(1) reveal the contribution of the
firsteigenvectortoeachepoch(j
= 1, 2, , M). The second
eigenvector, on the other hand, covers mainly the variation in
the T-wave times and is expected to resemble the derivative
of the T-wave. The model parameters corresponding to the
second eigenvector, that is, the second PCs, are thus expected
to reflect the variability of the time difference between R- and
T-waves, that is, RT interval variability.
In conclusion, the second PCs are here taken as estimates
for RT interval variabilit y, and thus there is no need for T-
wave apex or offset detection. However, it should be noted
that the PCs are in arbitrary units and do not yield absolute
values for the RT intervals. If absolute RT interval values are
desired, one should compute the T-wave estimates accord-
ing to (8) and find the apexes or offsets of each estimate. In
that case, the PCR approach could be seen just as a denoising
procedure.
2.4. Noise sensitivity of RT interval measures
The most common approach for evaluating the noise sensi-
tivity of an RT measurement method is to replicate a single
noise-free cardiac cycle and add noise to hereby generated
ECG. This leads to an ECG signal in which the “true” RT in-
terval is constant and the noise sensitivity of the RT measure-
ment method can be evaluated, for example, by determining
the standard deviation of RT interval estimates for different
noise levels. The proposed PCR-based method, however, as-
sumes variability in RT interval, and thus cannot be evalu-
ated this way. In fact, we are interested in the RT variability
itself and want to evaluate the effect of noise on the RT vari-
ability estimates.
On way to accomplish this is to utilize some good qual-
ity ECG measurement which after preprocessing can be con-
sidered to be noise-free. The RT interval measures obtained
from such noise-free ECG measurement can then be consid-
ered as the “true” RT intervals. To evaluate the noise sensi-
tivity of different methods, Gaussian zero-mean noise of dif-
ferent levels can then be added to the noise-free ECG signal
and different RT estimates may be recalculated for the noisy
ECG. The observed changes in the RT variability series (com-
pared to the “true” RT series) can be evaluated, for example,
in frequency domain.
3. RESULTS
At first, we compared the PCR-based method with the three
traditional RT interval measures by utilizing the resting ECG
measurement. In order to remove measurement noise and to
enable unambiguous detection of R- and T-waves, the ECG
was bandpass filtered (passband 1–30 Hz). The traditional
RT interval measures when applied to this “noise-free” ECG
may be considered to give accurate results against which the
PCR method can be compared.
The T-wave epochs extracted from the noise-free ECG
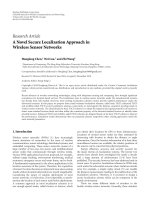
are shown in Figure 3. The correlation matrix for the epochs
was calculated according to (6) and the first two eigenvectors
of the correlation matrix are shown in Figure 4(a).Thecorre-
sponding eigenvalues were λ
1
= 0.9932 and λ
2
= 0.0041. The
first eigenvector clearly represents the mean of the ensemble
and the second eigenvector is similar to the first derivative of
the T-wave. As demonstrated in Figure 4(b),itisquiteeasy
to see that in the superposition of the first two eigenvectors,
the peak is moved according to the magnitude and sign of
the second PC. For positive values of this component, the
peak is moved to the right and for neg ative values to the left.
Thus, the second PC can be used as a measure of RT inter-
val variability, and even though, the second PC does not give
absolute values for RT interval, it is here denoted as RT
PC
.
The obtained RT interval variability series RT
PC
is com-
pared with the traditional RT interval measures RT
apex
,
RT
(t)
end
,andRT
( f )
end
in Figure 5. It is observed that the varia-
tion in the RT
PC
is very similar to the variations in the tradi-
tional RT measures. Even the deviations at about 200 and 400
seconds seem to be captured by the PCR method. The sim-
ilarity of the RT
PC
series with the traditional RT series was
further evaluated both in frequency and in time domain. In
frequency domain, the power-spectrum estimates of differ-
ent RT series were calculated by using Welch’s periodogram
method. Prior to spectrum estimation, each RT series was
converted to evenly sampled series by using a 4 Hz cubic
spline interpolation and the trend was removed by using a
smoothness-priors-based method presented in [17].
The obtained spectrum estimates for different RT mea-
sures presented in Figure 5 seem to have similar shape. The
percentual powers of low-frequency (LF, 0.04–0.15 Hz) and
high-frequency (HF, 0.15–0.4 Hz) bands, LF/HF ratio, as well
as the LF and HF peak frequencies were then calculated. The
obtained results are presented in Table 1. In time domain,
the correlation coefficients between RT
PC
and the traditional
Mika P. Tarvainen et al. 5
0.50.40.30.20.1
Time (s)
0.1
0
0.1
0.2
0.3
1st eigenvector v
1
2nd eigenvector v
2
(a)
0.50.40.30.20.1
Time (s)
0.1
0
0.1
0.2
0.1
0
0.1
0.2
1st eigenvector v
1
2nd eigenvector v
2
θ(1)v
1
+ θ(2)v
2
(b)
Figure 4: Demonstration of T-wave latency jitter modeling by the
first two eigenvectors. (a) The first two eigenvectors of the T-wave
epochs and (b) the superposition of these eigenvectors when the
second PC is positive (top) or negative (bottom).
measures were calculated. These coefficients and the corre-
sponding correlation plots are shown on the right-hand side
of Figure 5. The obtained correlation coefficients are quite
high considering that the corresponding coefficients between
the traditional measures were not considerably higher as can
be seen from Ta ble 1.
The noise sensitivity of the different RT variability es-
timates was then evaluated by adding Gaussian zero-mean
noise to the noise-free ECG. The noise levels applied were
such that the SNRs of the generated noisy ECG signals were
50, 40, 30, 25, 20, 15, 10, and 5 decibels, see Figure 6.For
each noise level, the RT
apex
,RT
(t)
end
,RT
( f )
end
,andRT
PC
mea-
sures were reevaluated and the corresponding spect rum esti-
mates were calculated as before. The distortion of the spec-
trum estimates for decreased SNRs was clearly observed es-
pecially for traditional RT measures.
This distortion was then quantified by generating a total
of 1000 noisy ECG realizations for each noise level and by
evaluating the relative LF and HF band powers for each real-
ization and for each RT variabilit y measure. The obtained re-
sults are presented in Figure 7, where the mean band powers
and their SD intervals are presented for each RT measure as
a function of SNR. The SNR
=∞corresponds to the noise-
free ECG signal.
Finally, the proposed method and the three traditional
RT measures were applied to the exercise ECG measure-
ments. Five samples were chosen for analysis from each mea-
surement according to Figure 1. These stages were S1
= ly-
ing supine, S2
= sitting, S3 = 80 W load, S4 = peak exer-
cise, and S5
= recovery stage. Each analyzed sample was 150
seconds of length. RT
apex
,RT
(t)
end
,RT
( f )
end
,andRT
PC
measures
as well as RR intervals were then extracted from every sam-
ple. The obtained time series for one subject are presented
in Figure 8(a). This particular subject had prominent T-wave
throughout the measurement, and practically all the RT mea-
sures were obtained without significant problems. However,
in two of the subjects having weaker T-waves, the traditional
RT measures showed significant errors especially near peak
exercise.
NotethateachRTmeasureandRRseriesinFigure 8(a)
are presented in the same scale for all stages, and thus for
example, the decrease in RR variability during exercise is ev-
ident. For traditional RT measures, on the other hand, the
variability seems to increase during exercise which is, how-
ever, probably mainly due to the effect of noise. For the pro-
posed method, the variability levels between different stages
are not comparable because the PCR method is applied sep-
arately to each stage, and for example, the eigenvectors are
different in each stage.
Figure 8(b) presents the detrended RR and RT series,
where the trend was removed by using the smoothness pri-
ors method. Note that each detrended series is presented
in a minmax scale to permit the visualization of similari-
ties/differences among series, and thus there are no scales for
RR or RT interval durations.
The power-spectrum estimates were then calculated for
each detrended series and each stage by using Welch’s pe-
riodogram method as before. The obtained spect rum esti-
mates are presented in Figure 8(c), where each spectrum has
been divided into three frequency bands: low frequency (LF,
0.04–0.15 Hz), high frequency (HF, 0.15–0.4 Hz), and very
high frequency (VHF, 0.4–1 Hz) according to [18]. In ad-
dition, the mean respiratory frequencies observed from the
spirometer measurements for each stage are marked with
dashed lines. The observed respiratory frequencies were 0.34,
0.31, 0.31, 0.55, and 0.49 Hz for stages S1, S2, S3, S4, and S5,
respectively. It should, however, be noted that within most
of the stages, the respiratory frequency varied significantly
around its mean value.
Note that each spectrum estimate is displayed in different
scales to enable the comparison of spect ral shapes, and thus
there is no power scale in Figure 8(c). The spec tra of differ-
ent RT variability estimates have clearly similar characteris-
tics which are partly congruent with the RR spectra. These
spectral properties are further compared in Figure 9,where
relative LF, HF, and VHF band powers for R R interval series
6 EURASIP Journal on Advances in Signal Processing
5004003002001000
5004003002001000
5004003002001000
5004003002001000
Time (s)
0.8
0.4
0
0.4
0.8
RT
PC
0.29
0.3
0.31
0.32
RT
( f )
end
(s)
0.29
0.3
0.31
0.32
RT
(t)
end
(s)
0.23
0.24
0.25
RT
apex
(s)
(a)
0.50.40.30.20.10
0.50.40.30.20.10
0.50.40.30.20.10
0.50.40.30.20.10
Frequency (Hz)
0
0.1
0.2
0.3
PSD (1/Hz)
0
50
100
PSD (ms
2
/Hz)
0
50
100
150
PSD (ms
2
/Hz)
0
20
40
PSD (ms
2
/Hz)
LF HF
LF HF
LF HF
LF HF
(b)
0.80.400.40.8
0.80.40
0.40.8
0.80.40
0.40.8
RT
PC
0.29
0.3
0.31
0.32
RT
( f )
end
(s)
0.29
0.3
0.31
0.32
RT
(t)
end
(s)
0.23
0.24
0.25
RT
apex
(s)
r = 0.874
r
= 0.947
r
= 0.896
(c)
Figure 5: Comparison of the RT interval variability series RT
PC
(obtained by the PCR-based method) with traditional RT interval measures
RT
apex
,RT
(t)
end
,andRT
( f )
end
.(a)Thedifferent RT measures and the estimated trend, (b) corresponding spectrum estimates, and (c) correlation
plots.
Table 1: Spectral variables and correlation coefficients of different
RT interval measures presented in Figure 5.
RT
apex
RT
(t)
end
RT
( f )
end
RT
PC
Spectral variables
LF power (%) 27.9 31.6 31.4 32.9
HF power (%) 70.6 66.8 67.0 65.4
LF/HF ratio 0.395 0.474 0.469 0.502
LF peak (Hz) 0.087 0.087 0.087 0.087
HF peak (Hz) 0.213 0.213 0.214 0.213
Correlation coefficients, r
RT
apex
— 0.892 0.918 0.874
RT
(t)
end
— — 0.966 0.947
RT
( f )
end
— — — 0.896
and for the different RT measures are presented for all five
subjects as a function of the stage.
4. DISCUSSION
Ventricular repolarization duration variabilit y, which is typ-
ically assessed by examining the variability within the RT in-
terval, is a potential tool in cardiovascular research. Various
algorithms for estimating RT interval from ECG have been
applied, see, for example, [3, 5–10, 13, 19]. Considering the
rather low spontaneous variability within the RT interval, the
need for high precision in the measurement of this interval
is obvious. The detection of the rather smooth T-wave can,
however, be problematic especially in low SNR conditions.
In this paper, we have proposed a new PCR-based method
for estimating the RT interval variability. The main benefit
of the proposed method is that it does not necessitate T-wave
detection.
The proposed method was compared with traditional
RT
apex
and RT
end
measures by using a good-quality (prac-
tically noise-free) ECG measurement and the proposed
method was observed to be highly congruent with the tra-
ditional RT measures as can be seen from Figure 5 and
Tabl e 1. Both the spectral characteristics and time-domain
Mika P. Tarvainen et al. 7
0.5
0
0.5
1
1.5
ECG (mV)
SNR = 50 dB SNR = 40 dB
0.5
0
0.5
1
1.5
ECG (mV)
SNR = 30 dB SNR = 25 dB
0.5
0
0.5
1
1.5
ECG (mV)
SNR = 20 dB SNR = 15 dB
0.60.300.30.60.300.3
Time (s) Time (s)
0.5
0
0.5
1
1.5
ECG (mV)
SNR = 10 dB SNR = 5dB
Figure 6: Samples of the generated noisy ECG signals with different
SNRs.
correlations of the estimated RT variability series were com-
pared. These results indicate that the proposed PCR-based
method estimates RT variability correctly.
In the proposed method, RT variability is modeled by the
second eigenvector of data correlation matrix. The first few
eigenvectors tend to describe the main features of the data
set, which in this case include T-wave shape and position, and
thus the method is expected to be quite robust to noise. The
noise sensitivity of the proposed method was tested by gen-
erating noisy ECG signals with SNRs between 50 and 5 dB.
For each SNR, the spectrum estimates of the estimated RT
variability series were calculated and LF and HF band powers
were evaluated. The proposed method was clearly less sensi-
tive to noise when compared to the traditional RT measures
ascanbeseenfromFigure 7. When comparing the tradi-
tional methods, the RT
apex
measure was observed to be the
most precise in the presence of noise, which is in agreement
with previous studies [8, 9, 13].
It should be noted that in the PCR method, the noisy
ECG was not preprocessed in any way, and thus it can
be concluded that the method is very robust to noise, at
510152025304050
SNR (dB)
25
30
35
40
LF power (%)
60
65
70
75
HF power (%)
RT
apex
Relative LF band power
Relative HF band power
510152025304050
SNR (dB)
25
30
35
40
LF power (%)
60
65
70
75
HF power (%)
RT
(t)
end
Relative LF band power
Relative HF band power
510152025304050
SNR (dB)
25
30
35
40
LF power (%)
60
65
70
75
HF power (%)
RT
( f )
end
Relative LF band power
Relative HF band power
510152025304050
SNR (dB)
25
30
35
40
LF power (%)
60
65
70
75
HF power (%)
RT
PC
Relative LF band power
Relative HF band power
Figure 7: The noise sensitivity of the different RT variability esti-
mates. Relative LF () and HF () band powers with SD intervals
for RT
apex
,RT
(t)
end
,RT
( f )
end
,andRT
PC
as a function of SNR.
8 EURASIP Journal on Advances in Signal Processing
150100500150100500150100500150100500150100500
Time (s)Time (s)Time (s)Time (s)Time (s)
1
0
1
RT
PC
0.2
0.3
RT
( f )
end
(s)
0.2
0.3
RT
(t)
end
(s)
0.15
0.2
0.25
RT
apex
(s)
0.4
0.7
1
RR (s)
S1 S2 S3 S4 S5
(a)
150100500150100500150100500150100500150100500
Time (s)Time (s)Time (s)Time (s)Time (s)
RT
PC
RT
( f )
end
(s)
RT
(t)
end
(s)
RT
apex
(s)
RR (s)
S1 S2 S3 S4 S5
(b)
10.5010.5010.5010.5010.50
Frequency (Hz)Frequency (Hz)Frequency (Hz)Frequency (Hz)Frequency (Hz)
PSD RT
PC
PSD RT
( f )
end
PSD RT
(t)
end
PSD RT
apex
PSD RR
S1 S2 S3 S4 S5
(c)
Figure 8: Exercise ECG measurement of one subject. (a) RR interval, RT
apex
,RT
(t)
end
,RT
( f )
end
,andRT
PC
series and (b) the corresponding
detrended series for stages S1, S2, , S5. (c) Corresponding spectrum estimates with gray lines indicating the LF, HF, and VHF bands and
the dashed line indicating the mean observed respiratory frequency.
Mika P. Tarvainen et al. 9
0
25
50
75
100
RR
LF power (%) HF power (%) VHF power (%)
0
25
50
75
100
RT
apex
0
25
50
75
100
RT
(t)
end
0
25
50
75
100
RT
( f )
end
S5S4S3S2S1S5S4S3S2S1S5S4S3S2S1
SituationSituationSituation
0
25
50
75
100
RT
PC
Figure 9: Exercise ECG measurement results. Relative LF, HF, and
VHF band powers for RR interval, RT
apex
,RT
(t)
end
,RT
( f )
end
,andRT
PC
series for stages S1, S2, , S5. Each line represents results of one
subject.
least to Gaussian noise. Baseline oscillations, on the other
hand, would most probably cause significant distortion to
the method and should, thus, be removed before the PCR
analysis. Another issue which can cause significant distortion
and should be taken care of before analysis is if the T-wave
morphology changes remarkably within the measurement.
However, these limitations have more or less effect also on
the traditional RT measures applied in this paper.
Lastly, the proposed method was applied to a set of ex-
ercise ECG measurements in which high noise levels are ob-
served especially near the peak exercise. Five samples were
chosen for analysis according to Figure 1 and the estimated
RT variability series along with the corresponding RR inter-
valseriesforonesubjectwerepresentedinFigure 8.InRR
variability, an increase in the relative VHF power is observed
in peak exercise, which is in agreement with previous find-
ings [18, 20]. The RT variability is observed to have similar
spectral characteristics as RR variability with two major dif-
ferences. First of all, during stage S3, RT variability is char-
acterized by a more pronounced VHF component than RR
variability. Secondly, in all RT variability estimates, the rela-
tive power of the VHF component seems to remain high also
in the recovery stage unlike in RR variability as can be seen
from Figure 9.
5. CONCLUSIONS
In conclusion, the proposed method is a potential approach
for studying RT interval variability. The method is very ro-
bust to noise and gives results which are congruent with tra-
ditional RT variability measures. The method is also rather
simple to apply, requiring only the detection of the strong
ECG R-wave. Probably, the main drawback of the method is
that it does not directly give absolute values for RT interval.
The absolute values could, however, be estimated by evalu-
ating the relationship between the second principal compo-
nents and the corresponding T-wave positions (see Figure 4),
or simply by evaluating the T-wave apexes or offsets from the
T-wave estimates obtained from (8).
REFERENCES
[1] M. Merri, A. J. Moss, J. Benhorin, E. H. Locati, M. Alberti, and
F. Badilini, “Relation between ventricular repolarization dura-
tion and cardiac cycle length during 24-hour Holter record-
ings: findings in normal patients and patients with long QT
syndrome,” Circulation, vol. 85, no. 5, pp. 1816–1821, 1992.
[2] W. Zareba and A. B. de Luna, “QT dynamics and variability,”
The Annals of Noninvasive Electrocardiology,vol.10,no.2,pp.
256–262, 2005.
[3]R.D.Berger,“QTvariability,”Journal of Electrocardiology,
vol. 36, supplement 1, pp. 83–87, 2003.
[4] R. Negoescu, S. Dinca-Panattescu, V. Filcescu, D. Ionescu, and
S. Wolf, “Mental stress enhances the sympathetic fraction of
QT variability in an RR-independent way,” Integrative Phys-
iological and Behavioral Science, vol. 32, no. 3, pp. 220–227,
1997.
[5]M.Merri,M.Alberti,andA.J.Moss,“Dynamicanalysis
of ventricular repolarization duration from 24-hour Holter
recordings,” IEEE Transactions on Biomedical Engineering,
vol. 40, no. 12, pp. 1219–1225, 1993.
[6] G. Nollo, G. Speranza, R. Grasso, R. Bonamini, L. Mangiardi,
and R. Antolini, “Spontaneous beat-to-beat variability of the
ventricular repolarization duration,” Journal of Electrocardiol-
ogy, vol. 25, no. 1, pp. 9–17, 1992.
[7] P. Laguna, N. V. Thakor, P. Caminal, et al., “New algorithm for
QT interval analysis in 24-hour Holter ECG: performance and
applications,” Medical and Biological Engineer ing and Comput-
ing, vol. 28, no. 1, pp. 67–73, 1990.
[8] A. Porta, G. Baselli, F. Lombardi, et al., “Performance assess-
ment of standard algorithms for dynamic R-T interval mea-
surement: comparison between R-T
apex
and R-T
end
approach,”
Medical and Biological Engineering and Computing, vol. 36,
no. 1, pp. 35–42, 1998.
10 EURASIP Journal on Advances in Signal Processing
[9] P. E. Tikkanen, L. C. Sellin, H. O. Kinnunen, and H. V.
Huikuri, “Using simulated noise to define optimal QT inter-
valsforcomputeranalysisofambulatoryECG,”Medical Engi-
neering and Physics, vol. 21, no. 1, pp. 15–25, 1999.
[ 10 ] P. P. D ave y, “ QT interval measurement: Q to T
apex
or Q to
T
end
?” Journal of Internal Medicine, vol. 246, no. 2, pp. 145–
149, 1999.
[11] I. Savelieva, G. Yi, X H. Guo, K. Hnatkova, and M. Malik,
“Agreement and reproducibility of automatic versus manual
measurement of QT interval and QT dispersion,” The Ameri-
can Journal of Cardiology, vol. 81, no. 4, pp. 471–477, 1998.
[12] R. H. Ireland, R. T. C. E. Robinson, S. R. Heller, J. L.B. Mar-
ques, and N. D. Harris, “Measurement of high resolution
ECG QT interval during controlled euglycaemia and hypogly-
caemia,” Physiological Measurement, vol. 21, no. 2, pp. 295–
303, 2000.
[13] G. Speranza, G. Nollo, F. Ravelli, and R. Antolini, “Beat-to-
beat measurement and analysis of the R-T interval in 24 h
ECG Holter recordings,” Medical and Biological Engineering
and Computing, vol. 31, no. 5, pp. 487–494, 1993.
[14] G X. Yan and C. Antzelevitch, “Cellular basis for the normal T
wave and the electrocardiographic manifestations of the long-
QT syndrome,” Circulation, vol. 98, no. 18, pp. 1928–1936,
1998.
[15] J. Pan and W. J. Tompkins, “A real-time QRS detection algo-
rithm,” IEEE Transactions on Biomedical Engineering, vol. 32,
no. 3, pp. 230–236, 1985.
[16] I. T. Jolliffe, Principal Component Analysis, Springer, New York,
NY, USA, 1986.
[17] M. P. Tarvainen, P. O. Ranta-Aho, and P. A. Karjalainen, “An
advanced detrending method with application to HRV anal-
ysis,” IEEE Transactions on Biomedical Enginee ring, vol. 49,
no. 2, pp. 172–175, 2002.
[18] R. Bail
´
on,J.Mateo,S.Olmos,etal.,“Coronaryarterydisease
diagnosis based on exercise electrocardiogram indexes from
repolarisation, depolarisation and heart rate variability,” Med-
ical and Biological Engineering and Computing,vol.41,no.5,
pp. 561–571, 2003.
[19] M. Merri, J. Benhorin, M. Alberti, E. Locati, and A. J. Moss,
“Electrocardiographic quantitation of ventricular repolariza-
tion,” Circulation, vol. 80, no. 5, pp. 1301–1308, 1989.
[20] J. Mateo, P. Serrano, R. Bail
´
on, et al., “Heart rate variability
measurements during exercise test may improve the diagnosis
of ischemic heart disease,” in Proceedings of the 23rd Annual
International Conference of the IEEE Engineering in Medicine
and Biology Society (EMBS ’01), vol. 1, pp. 503–506, Istanbul,
Turkey, October 2001.
Mika P. Tarvainen received the M.S. de-
gree in 1999 and the Ph.D. degree in 2004
from the University of Kuopio, Finland. His
Ph.D. research was concerned with estima-
tion methods for nonstationary biosignals.
Since 1999, he has been working in the De-
partment of Physics, University of Kuopio
as a Researcher. He is currently a Senior Re-
searcher and a Lecturer of the Signal Analy-
sis Course in the Department of Physics. His
current research area includes biomedical signal analysis methods
and their applications. In methodological research, he has focused
on time series and spectral estimation methods, time-varying esti-
mation methods, and nonlinear techniques.
Tomi Laitinen received the M.D. degree in
1991 and the Ph.D. degree in 2000 from
the University of Kuopio, Finland. His Ph.D.
research was concerned with physiological
correlates of the cardiovascular variability.
Since 2004, he has been a University Docent
(Adjunct Professor) in the Department of
Clinical Physiology and Nuclear Medicine
in University of Kuopio. He is currently a
Clinical Lecturer in University of Kuopio
and Consultant in the Department of Clinical Physiology and Nu-
clear Medicine in Kuopio University Hospital. His current research
is focused on physiology and pathophysiology of cardiovascular
regulation and vascular function.
Tiina Lyyra-Laitinen received the M.S. de-
gree in 1991, the Ph.D. degree in 1998,
and degree of Hospital Physicist from the
University of Kuopio, Finland. Her Ph.D.
research was concerned with arthroscopic
measurement of knee-joint cartilage stiff-
ness. She is currently a Hospital Physicist in
the Department of Clinical Physiology and
Nuclear Medicine, Kuopio University Hos-
pital. Her current research activities include
cardiovascular biomechanics and signal analysis.
Juha-Pekka Niskanen received the M.S. de-
gree in medical physics f rom University of
Kuopio, Kuopio, Finland, in 2006. He is cur-
rently working in University of Kuopio, De-
partment of Physics as a Researcher. His
current research is focused on the applica-
tions of biomedical signal processing and
functional magnetic resonance imaging.
Pasi A. Karjalainen received the Ph.D. de-
gree in 1997 from the University of Kuopio,
Finland. Since 1988, he has been working
in University of Kuopio as Researcher and
in Kuopio University Hospital as Physicist.
He is currently a Professor in the Depart-
ment of Physics and he is leading the Re-
search Group of Biomedical Signal Analysis
and Medical Imaging. His research areas in-
clude biomedical signal analysis and medi-
cal imaging applications. Most of his work has been concerned with
application of Bayesian and regularization methods to biomedical
problems.