Báo cáo hóa học: " Research Article Localized Spectral Analysis of Fluctuating Power Generation from Solar Energy Systems" docx
Bạn đang xem bản rút gọn của tài liệu. Xem và tải ngay bản đầy đủ của tài liệu tại đây (1.48 MB, 8 trang )
Hindawi Publishing Corporation
EURASIP Journal on Advances in Signal Processing
Volume 2007, Article ID 80919, 8 pages
doi:10.1155/2007/80919
Research Article
Localized Spectral Analysis of Fluctuating Power
Generation from Solar Energy Systems
Achim W oyte,
1
Ronnie Belmans,
2
andJohanNijs
2, 3
1
3E sa, Rue du Canal 61, 1000 Brussels, Belgium
2
Departement Elektrotechniek, Katholieke Universiteit Leuven, Kasteelpark Arenberg 10, 3001 Leuven, Belgium
3
Photovoltech sa, Grijpenlaan 18, 3300 Tienen, Belgium
Received 27 April 2006; Revised 20 December 2006; Accepted 23 December 2006
Recommended by Alexander Mamishev
Fluctuations in solar irradiance are a serious obstacle for the future large-scale application of photovoltaics. Occurring regularly
with the passage of clouds, they can cause unexpected power variations and introduce voltage dips to the power distribution
system. This paper proposes the treatment of such fluctuating time series as realizations of a stochastic, locally stationary, wavelet
process. Its local spectral density can be estimated from empirical data by means of wavelet periodograms. The wavelet approach
allows the analysis of the amplitude of fluctuations per characteristic scale, hence, persistence of the fluctuation. Furthermore,
conclusions can be drawn on the frequency of occurrence of fluctuations of different scale. This localized spectral analysis was
applied to empirical data of two successive years. The approach is especially useful for network planning and load management of
power distribution systems containing a high density of photovoltaic generation units.
Copyright © 2007 Achim Woyte et al. This is an open access article distributed under the Creative Commons Attribution License,
which permits unrestricted use, distribution, and reproduction in any medium, provided the original work is properly cited.
1. INTRODUCTION
Most applications of wavelet decomposition in the field of
electrical power engineering concern the analysis of load pro-
files [1, 2], the electrical power supply quality and its mea-
surement [3–6], and also protection issues [7]. The primar y
objective in most of these applications is the isolation of tran-
sient phenomena from steady-state phenomena in the elec-
tricity grid, usually the fundamental 50 or 60 Hz component
and its harmonics [7]. A new area of application is presented
with the analysis of time series of solar radiation in order to
quantify the intermittent power supplied by solar energy sys-
tems, mainly photovoltaics (PV). In this case, the power sup-
ply quality can be deteriorated as a consequence of power
variations due to a varying cloud coverage of the sky. This
leads to variable power output of the PV system, which intro-
duces voltage dips to the distribution system. Typically these
fluctuations persist seconds up to a fraction of an hour.
The intermittent nature of solar r adiation is one of the
drawbacks of the large-scale application of photovoltaics.
With a high density of PV generation in a power distribution
grid, irradiance fluctuations introduced by moving clouds
can lead to unpredictable variations of node voltages and
power and finally cause a breakdown of distribution grids.
Distribution system operators need tools for a realistic esti-
mation of such disturbances, allowing to take adequate mea-
sures for gr id reinforcement in time while avoiding too cau-
tious and, therefore, cost-intensive measures. An analysis of
fluctuations introduced by solar irradiance fluctuations must
focus on their amplitude, persistence, and frequency of oc-
currence rather than their location in time. A tool that would
allow the distribution system operator to stochastically assess
these parameters would be of utmost practical utility.
The Fourier analysis cannot satisfactorily provide the
necessary information since time series of solar irradiance
exhibit no intraday periodicity. Instead, a localized spectral
analysis based on wavelet bases is proposed. This analysis per-
mits the decomposition of the fluc tuating irradiance signal
into a set of orthonormal subsignals. Each of them represents
one specific scale of persistence of the fluctuation.
The objective of this study is to illustrate the application
of localized spectral analysis in the field of solar energy me-
teorology, as a new tool for facilitating the integration of PV
generation units in the power distribution systems of the fu-
ture. Exemplary applications of the method to electric power
systems have already been presented in [8, 9] whereas the
meteorological conditions allow ing the generalization of this
method were explored in [10]. The present paper introduces
2 EURASIP Journal on Advances in Signal Processing
the analysis of empirical time series derived from solar irradi-
ance as realizations of a stochastic, locally stationar y, wavelet
process, following the approach proposed in [11–13]. The
occurring fluctuations can be classified and treated per char-
acteristic scale of persistence. As a result, fluctuation indices
are derived for all characteristic scales, permitting conclu-
sions on the characteristic fluctuation pattern at the specific
site.
2. PRECEDING STUDIES
Two studies assessing cloud-induced power fluctuations in
distribution grids with high PV connection density are pre-
sented in [14, 15]. The examinations are based on the ap-
proximation of clouds by primitive geometries, moving over
the area under examination w ith predefined wind speed and
direction. Conclusions on the frequency of occurrence and
duration of irradiance fluctuations have not been drawn.
In [16], the contours of clouds in inhomogeneous skies
are modelled as fractals, taking into account the irregular
shape and spatial distribution of clouds. Based on this model,
time series of solar irradiance have been synthesized and ap-
plied to extended power-flow studies. Within this approach,
the fractal dimension is a measure for the cloud-induced
variability of solar radiation. However, further steps regard-
ing the classification of cloudy sky conditions by means of
this approach have not yet been published.
A statistical approach is applied in [17]. There, time se-
ries of solar irradiance are described by their “fluctuation fac-
tor,” being defined as the root mean square (rms) value of
the high-pass filtered time series of solar irradiance, recorded
during two hours around noon. The authors propose the
power spectral density (PSD) of the irradiance time series
as a potential tool for the analysis of cloud fields, without
yet further elaborating the approach. However, a main draw-
back of the PSD approach seems to be the obvious lack of
second-order autocorrelation in time series of the clearness
index.
The proposed analysis of short fluctuations in solar irra-
diance by means of localized spectral analysis can combine
advantages of [16, 17]. On the one hand, similar to fractal
cloud patterns [16], the approach allows the analysis of all
scales of fluctuation from very short variations as they ap-
pear close to the edge of a cloud, up to long fluctuations be-
tween clouds. On the other hand, the wavelet approach al-
lows quantifying the power content of the fluctuating signal,
similar to the fluctuation factor in [17]. Moreover, due to its
good time-frequency localization, the wavelet approach al-
lows a meaningful decomposition of the signal’s power con-
tent, corresponding to the persistence of the occurring fluc-
tuation. Finally, unlike many other approaches described in
the literature, the wavelet approach is mathematically sound.
3. BACKGROUND
3.1. Solar irradiance signals
The solar irradiance G(t) received by an arbitrarily oriented
surface as a function of time can be decomposed into a
deterministic and a stochastic part according to
G(t)
= I
0
E
0
(t)cosγ
i
(t)k(t)(1)
with
(i) I
0
= 1367 W/m
2
the solar constant, defined as the
long-term average intensity of solar radiation as re-
ceived outside the earth’s atmosphere,
(ii) E
0
(t) the eccentricity correction factor, compensating
for periodic annual variations of the earth’s orbit,
(iii) γ
i
(t) the angle of incidence of the sun rays on an ar-
bitrar ily oriented surface at a given geographical posi-
tion,
(iv) k(t) the instantaneous clearness index [18].
For a receiver with arbitrarily oriented surface, E
0
and γ
i
only depend on astronomical relationships and can be ana-
lytically determined for each instant in time throughout the
year. The clearness index k accounts for all meteorological in-
fluences, mainly being the stochastic parameters atmospheric
turbidity and moving clouds. It is independent of all astro-
nomical relationships. The mean value of the clearness index
over a period of time is denoted as
k. The sampling period
ΔT for an analysis of cloud-induced fluctuations should be
no longer than eight seconds in order to account for more
than 98% of the signal’s power content [10].
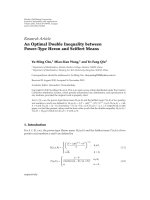
Figure 1(a) shows the solar irradiance on a slightly over-
cast summer day with
k = 0.73 as a function of time, sam-
pled as 5-second average v alues. The corresponding time se-
ries of the clearness index in Figure 1(b),calculatedbymeans
of (1), exhibits no significant trend and its fluctuations ap-
pear to be randomly distributed in time. A closer view on
the short-time behavior of this signal in Figure 1(c) displays
the influence of passing clouds, when the radiation sensor
receives only diffuse irradiance, but no beam irradiance di-
rectly from the sun. This bimodal, almost binary, behavior
of the instantaneous clearness index with distinct “clear” and
“cloudy” states is well known in the field of solar energy me-
teorology [14, 19, 20]. Apparently, time series of the instan-
taneous clearness index can be characterized as a signal of
randomly distributed squares of variable pulse width, super-
posed by higher frequency noise, mainly, but not exclusively,
occurring at the transitions between clear and cloudy states.
The cumulative frequency distribution of the clearness
index, averaged over one hour and more, can be described
by Boltzmann statistics [20–24]. Remarkably, for any speci-
fiedmeanvalue
k during the period under study, the prob-
ability distribution of k is virtually independent of the sea-
son and the geographical position. With some limitations,
this also holds for the instantaneous clearness index, with its
frequency distribution defined as a superposition of differ-
ent Boltzmann distr ibutions, accounting for the sharp tran-
sition between clear and cloudy states and the comparably
scarce occurrence of intermediate ones [10, 20]. Autocorre-
lation analysis of time series of the instantaneous clearness
index returned first-order autocorrelation coefficients with
sufficiently low variance for clearness index values sampled
as 5-minute averages and longer. For shorter averaging times,
Achim Woyte et al. 3
201816141210864
True solar time ( h)
0
200
400
600
800
1000
1200
Solar irradiance G (W/m
2
)
(a) Global irradiance on the horizontal plane.
1514131211109
True solar time ( h)
0
0.2
0.4
0.6
0.8
1
Clearness index k
(b) Clearness index during 6 hours around noon.
13.613.413.21312.8
True solar time ( h)
0
0.2
0.4
0.6
0.8
1
Clearness index k
(c) Clearness index zoomed in on 1 hour.
Figure 1: Global irradiance and clearness index on a slightly
clouded summer day (June 19, 2001) with daily mean clearness in-
dex
k = 0.73.
no significant autocorrelation coefficients could be identified
[19].
While the frequency distribution of the instantaneous
clearness index is well determined, due to the obvious lack
of periodicity, no significant second-order autocorrelation
can be identified in recorded time series of the instanta-
neous clearness index. Autocorrelation analysis of time series
of one-second average values measured in Leuven, Belgium,
returned no characteristic periodicit y with regard to cloud
coverage. Hence, stochastic modelling of time series of the
instantaneous clearness index, as required for forecasting, is
almost impossible. Nevertheless, methods for the analysis of
time series of the clearness index, as realizations of the un-
derlying random process, are of even greater importance.
3.2. Localized spectral analysis
The daily time series of the instantaneous clearness index are
interpreted as realizations of a stochastic, locally stationary
wavelet (LSW) process. The power content of such a process,
decomposed per wavelet scale, at each particular time is de-
termined by its local spec tral density (LSD) with, as an esti-
mator, the wavelet periodogram of the sequence analyzed. A
number of practical examples of wavelet periodogram anal-
ysis of empirical signals has already been provided in [11],
and the underlying process model was refined in [12, 13].
Wavelet periodogram analysis is based on the so-
called dyadic, undecimated, or stationary wavelet tr ansform
(SWT). Unlike the more common discrete wavelet trans-
form, the SWT contains redundancy, but it features the ad-
vantage of time invariance, which is essential for the anal-
ysis of the stochastic time series under consideration [25–
27]. For a discrete sequence x
={x[ n]} of length N,with
n
= 0, 1, , N − 1, the SWT is calculated from
D
j
(x)[ν] =
N−1
n=0
x[ n]
1
2
j/2
ψ
∗
n − ν
2
j
,
A
j
(x)[ν] =
N−1
n=0
x[ n]
1
2
j/2
φ
∗
n − ν
2
j
,
(ν, j)
∈ N,(2)
where the function ψ is referred to as the mother wavelet
with φ its corresponding scaling function [28]. The asterisk
(
∗) indicates complex conjugation. The length-N sequences
D
j
={D
j
(x)[ν]} and A
j
={A
j
(x)[ν]} are referred to as
“detail j” and “approximation j,” respectively.
Since the SWT contains redundancy, its inverse is not
unique, although, for practical application, it can be approx-
imated by the average over all existing inverse transforms.
When ψ is an orthonormal wavelet base, the SWT still en-
sures orthogonality between scales, and, with proper normal-
ization, Parseval identity is maintained:
x
2
2
=
1
2
j
0
A
j
0
2
2
+
j
0
j=1
1
2
j
D
j
2
2
, j
0
≤ log
2
N ∈ N,
(3)
hence, the set of sequences W
={A
j
0
, D
1
, D
2
, , D
j
0
} is a
complete representation of the original sequence x.
As an estimator of the LSD of the LSW process under
consideration, the wavelet periodogram I can be calculated
from the SWT of the empirical time series. With the normal-
ization as in (3), the values of I
={{I
j
[ν]}} are calculated
from
I
j
[ν] =
1
2
j
D
j
(x)[ν]
2
. (4)
4 EURASIP Journal on Advances in Signal Processing
21.81.61.41.210.80.60.40.20
Time shift θ (h)
0
1
k(t)
Clearness index k: signal and smoothed wavelet periodogram
(a)
21.81.61.41.210.80.60.40.20
Time shift θ (h)
0
0.05
1280 s <T
< 2560 s
j = 9
Clearness index k: signal and smoothed wavelet periodogram
(b)
21.81.61.41.210.80.60.40.20
Time shift θ (h)
0
0.05
640 s <T
< 1280 s
j = 8
Clearness index k: signal and smoothed wavelet periodogram
(c)
21.81.61.41.210.80.60.40.20
Time shift θ (h)
0
0.05
320 s <T
< 640 s
j = 7
Clearness index k: signal and smoothed wavelet periodogram
(d)
21.81.61.41.210.80.60.40.20
Time shift θ (h)
0
0.05
160 s <T
< 320 s
j = 6
Clearness index k: signal and smoothed wavelet periodogram
(e)
21.81.61.41.210.80.60.40.20
Time shift θ (h)
0
0.05
80 s <T
< 160 s
j = 5
Clearness index k: signal and smoothed wavelet periodogram
(f)
21.81.61.41.210.80.60.40.20
Time shift θ (h)
0
0.05
40 s <T
< 80 s
j = 4
Clearness index k: signal and smoothed wavelet periodogram
(g)
21.81.61.41.210.80.60.40.20
Time shift θ (h)
0
0.05
20 s <T
< 40 s
j = 3
Clearness index k: signal and smoothed wavelet periodogram
(h)
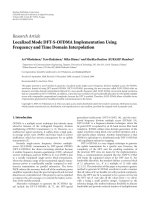
Figure 2: Smoothed wavelet periodogram of a time series of the instantaneous clearness index; θ = νΔT with ΔT = 5 seconds, j
0
= 12,
N
= 4096, shown are only j = 3upto9during2hours,ψ: Haar wavelet.
In an additional s tep, following the analysis from [11],
the sequences
{I
j
[ν]} are smoothed in order to eliminate
higher-frequency components introduced by the square in
(4). This is done by means of a stationary wavelet filter with
the same mother wavelet as above. Each sequence
{I
j
[ν]} is
transformed by means of an SWT and back, after having set
to zero all coefficients at levels of scale smaller than j.The
smoothed wavelet periodogram is denoted as I
={{I
j
[ν]}}.
4. APPLICATION TO THE INSTANTANEOUS
CLEARNESS INDEX
The smoothed wavelet periodogram is a measure for the lo-
cal power content of the clearness index signal for all dyadic
scales 2
j
, and it is variable in time with the time shift θ.
Figure 2 shows a typical two-hour clearness index signal and
its wavelet periodogram for a number of significant scales.
The Haar wavelet has been chosen as the mother wavelet.
Due to its rectangular shape, the Haar wavelet corresponds
very well to the bimodal character of the clearness index.
Fluctuations of the clearness index (upper graph) are asso-
ciated with local maxima on that scale, corresponding to the
length of the particular fluctuation. Although some leakage
between scales cannot be entirely prevented, the decompo-
sition based on the Haar wavelet exhibits a close correspon-
dence between the persistence of a fluctuation and the scale
of the wavelet periodogram on w hich the associated maxi-
mum occurs.
For example, the “dip” with approximately 200-second
persistence, occurring around θ
= 1.9 hours, causes a maxi-
mum on the scale with j
= 6, with some leakage to the neigh-
bouring scales. Conversely, the much shorter dip, occurring
shortly after θ
= 0.8 hour, mainly affects the scales with j = 3
and 4. Equation (3) is still valid after smoothing and the sum
over all time-integrated scales of the periodog ram equals the
energy content of the analyzed clearness index signal.
For the characterization of the signal’s mean power con-
tent and the energy associated with a fluctuation on the dif-
ferent scales, at this place, the “fluctuation power index” and
“fluctuation energy index” are introduced. The fluctuation
power index cf
p
is defined as the mean spectral density of a
sequence x as a function of the level of s cale j:
cf
p
[ j] =
1
N
N−1
ν=0
I
j
[ν]. (5)
Achim Woyte et al. 5
The fluctuation power index represents the mean square
value, thus, the average power, of all fluctuations in the se-
quence x on the particular scale.
With the characteristic persistence of a fluctuation that is
associated with the level of scale j being defined as
S
j
= 2
j−1
,(6)
the fluctuation energy index cf
e
is calculated
cf
e
[ j] = S
j
cf
p
[ j]. (7)
The fluctuation energy index is a measure for the energy
that is typically bound and freed again during a signal fluc-
tuation of the persistence 2S
j
.
Applied to time series of the instantaneous clearness in-
dex, cf
p
as a function of S
j
is a measure of the amplitude and
frequency of power flow fluctuations of a given persistence,
introduced by PV generation.
It is important to note that the terms power and en-
ergy in this context describe mathematical concepts rather
than physical quantities. In electrical engineering, the mean
square value of a signal is usually interpreted as its power
[29]. Mathematicians would rather talk about var iance [13].
However, in thermodynamic terms, the instantaneous clear-
ness index already is proportional to solar power. Its fluc-
tuation power index over all scales, therefore, represents the
square of solar power. Accordingly, the fluctuation energy in-
dex over all scales represents the integ rated square of solar
power over the time of persistence and not the integrated so-
lar power. Here, cf
e
has mainly been developed for reasons of
completeness but it will not further be applied in this analy-
sis.
5. RESULTS AND PRACTICAL APPLICATION
5.1. Statistical interpretation
The question arises whether for a given climate the stochas-
tic moments of the LSD of the clearness index can be deter-
mined with a sufficiently low variance. If this is the case, con-
clusions become possible, regarding the estimated frequency
of occurrence of fluctuations along with their amplitude for
each particular scale. Doubtlessly, for substantiated conclu-
sions, a thorough quantitative analysis is required, based on
an extended set of empirical data, measured over several
years on different sites. Nevertheless, first results based on a
limited set of data indicate that regularities in the frequency
distribution of cf
p
exist.
Smoothed wavelet periodograms and fluctuation indices
have been calculated for time series of the clearness index
from 721 sample days recorded during roughly two years in
Leuven, Belgium (situated 4.7
◦
E, 50.9
◦
N, 30 m a.s.l., mod-
erate maritime climate). The time series have been chosen
symmetrically around solar noon containing 4096 equidis-
tant samples, each with a sampling period ΔT
= 5 seconds.
The time ser ies have been grouped in seven classes according
to their mean clearness index
k, and annual mean values of
cf
p
have been calculated for each class of k.
10
4
10
3
10
2
10
1
Persistence of fluctuation T
j
(s)
0
1
2
3
4
5
6
7
8
×10
−3
Fluctuation power index of k
0.1
0.2
0.3
0.4
0.5
0.6
0.7
(a) Year 1: data from 362 days from May 14, 2001 to May 31,
2002.
10
4
10
3
10
2
10
1
Persistence of fluctuation T
j
(s)
0
1
2
3
4
5
6
7
8
×10
−3
Fluctuation power index of k
0.1
0.2
0.3
0.4
0.5
0.6
0.7
(b) Year 2: data from 359 days from June 1, 2002 to May 31, 2003.
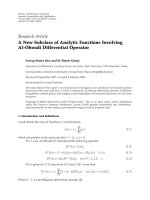
Figure 3: Fluctuation power index cf
p
of clearness index as a func-
tion of persistence T
j
= S
j
ΔT, annual mean values; legend: class of
daily mean clear ness index
k.
Figure 3 shows the annual mean values of cf
p
as a func-
tion of persistence of the fluctuation for two successive years.
The parameter
k specifies different classes of daily mean
clearness index, and it can be interpreted as a measure for
the average cloudiness during a day of the respective class.
For shorter persistence, the mean value of cf
p
is gener-
ally lower than for longer persistence. With an exponentially
increasing persistence S
j
, it increases slightly faster than lin-
early up to a local maximum.
6 EURASIP Journal on Advances in Signal Processing
Clearly, for very low k (overcast sky) and very high k
(slightly clouded to clear sky), the fluctuation power index is
low. As expected, it takes maximum values for sky conditions
with scattered clouds with 0.3
≤ k ≤ 0.6. A local maximum is
visible around a persistence between 300 up to 700 seconds,
indicating that this range of fluctuations is especially signifi-
cant for network planning accounting for PV power. The lo-
cal maxima visible at 5000 seconds indicate global changes
of the weather conditions during several hours, for example,
from clear sky in the morning to cloudy in the afternoon.
Moreover, they are influenced by boundary effects. Obvi-
ously, these maxima have no significant meaning with regard
to short fluctuations of the solar irr adiance.
The striking similarity of Figures 3(a) and 3(b) indicates
a significance of the mean cf
p
as an estimator for the char-
acteristic pattern of irradiance fluctuations under the given
climate. The steeper, but narrower local maximum at
k = 0.5
in Figure 3(a), originates from a relatively more frequent oc-
currence of days with steep clear-cloudy transitions in Year 1
in comparison to Year 2 [10].
For further statistical analysis a wider data base is re-
quired. The data from Leuven and also from other sites are
analyzed in detail on the background of solar energy mete-
orology in [10]. The high-resolution measurements of solar
radiation data in Leuven are still ongoing.
5.2. Application to distribution systems
Output fluctuations from PV can lead to energetic imbal-
ances in microgr ids and to voltage fluctuations at the end-
points of long radial low-voltage cables. In order to buffer
such fluctuations, especially, the application of double-layer
capacitors, also referred to as supercapacitors, has been pro-
posed [30, 31].
Power system parameters such as voltage or power re-
flect fluctuations in the clearness index. The cf
p
curves can
be calculated for clearness index or for PV output power.
Here, we assume a linear PV system model which means that,
with proper normalization, the cf
p
curves for clearness index
and PV output power are identical. The capacity of energy
buffers, necessary for smoothing out power fluctuations in-
troduced by a PV system can then be determined by means
of cf
p
curves as in Figure 3. The curves exhibit local maxima
of cf
p
for k values between 0.3 and 0.6, which corresponds
to sky conditions with scattered clouds. The average energy
E
B
(T
j
), freed and bound again during one such fluctuation
of persistence T
j
, can be derived from the fluctuation power
index at T
j
:
E
B
T
j
= T
j
cf
p
T
j
,(8)
where E
B
(T
j
) can be interpreted as the energy to be buffered
during T
j
in order to compensate for fluctuations of this
persistence and shorter, with a severity, characterized by the
associated cf
p
. The persistence T
j
in seconds is derived from
S
j
by multiplication with the sampling period ΔT.
An alternative to short-term storage for the mitigation
of power fluctuations is demand-side management. In that
case, the operation of noncritical loads such as, for example,
a fridge, is slightly shifted in time in order to bridge a period
of low power supply from the PV system.
Although both measures differ significantly regarding
practical implementation, buffering and demand-side man-
agement technically have the same effect. In both cases, the
consumption of a specified amount of energy during a cer-
tain time is postponed to a later moment when sufficient ex-
cess energy is available. In both cases, the maximum energy
to be shifted as well as the shifting time are subject to prac ti-
cal limitations.
Further, and more detailed, examples for the application
of this analysis have been presented in [8, 9].
6. CONCLUSIONS
Short fluctuations in solar irradiance are a serious drawback
for the large-scale application of photovoltaics embedded in
the power distribution grid. For the analysis of such fluctua-
tions, signal processing methods should be applied in order
to provide a solid mathematical basis for all subsequent con-
clusions regarding the impact of photovoltaics on the power
system. This should enable power system operators and en-
ergy supply companies to choose appropriate measures re-
garding demand side management, energy storage, or up-
grading of equipment, based on such analysis methods.
The stochastic fraction of solar irradiance introduced by
atmospheric turbidity and moving clouds is represented by
the clearness index. The probability distribution of the clear-
ness index is generally determined by its mean value, inde-
pendent of the season. Hence, statistical analysis of solar ir-
radiance fluctuations must focus on the instantaneous clear-
ness index.
The parameters of interest are the amplitude of the fluc-
tuations, their persistence in time, and their frequency of oc-
currence rather than their exact time of occurrence. There-
fore, a spectral analysis of the fluctuating time series of
the clearness index is much more appropriate than a time-
domain approach.
Since fluctuations introduced by moving clouds exhibit
no periodicity, the power spectral density based on harmonic
analysis is not suited for the treatment of such time series. A
better parameter for the description of the relevant fluctua-
tions is the local spectral density of the fluctuating time se-
ries, interpreted as realizations of a locally stationary wavelet
process.
Wavelet periodograms as an estimator for the local spec-
tral density allow an assessment of the amplitude of fluctu-
ations classified by their char acteristic persistence. For this
analysis, the Haar wavelet should be applied since it approx-
imates well the bimodal character of the clearness index.
The fluctuation power index (cf
p
)andfluctuationen-
ergy index (cf
e
) have been introduced as the mean power
of the fluctuating time series, respectively, the energy asso-
ciated with one fluctuation, both for each scale. The annual
Achim Woyte et al. 7
averages of the fluctuation power index for two successive
years exhibit a very close agreement, indicating some signifi-
cance as an estimator for the characteristic pattern of short-
term irradiance fluctuations in the specific climate. The ap-
plication of the fluctuation power index has briefly been
sketched for the sizing of energy buffers in microgrids and
distribution feeders with a high share of photovoltaic gener-
ation.
In the future, further statistical analysis is necessary,
based on a much wider base of empirical data. The pro-
posed method that has proven valuable for the processing of
nonstationary stochastic signals in many other fields, is best
suited also for the systematic analysis of fluctuations in solar
irradiance.
ACKNOWLEDGMENTS
This work has been carried out at Katholieke Universiteit
Leuven as a part of the first author’s Ph.D. dissertation. It
was financed by IMEC vzw, Leuven, in the framework of
the IMEC-K. U. Leuven Project 1996–2001/AO602, by the
European Commission under Contract no. ENK5-CT-2001-
00522 (DISPOWER), and by the Flemish region under Con-
tract no. IWT-GBOU 010055. The a uthors thank H. Brau-
nisch and J. Simoens for support and suggestions in the field
of signal processing and wavelets, and J. Appelbaum and H.
Suehrcke for their support, criticism, and suggestions regard-
ing the stochastic behavior of the instantaneous clearness in-
dex.
REFERENCES
[1] M. Misiti, Y. Misiti, G. Oppenheim, and J M. Poggi,
“D
´
ecomposition par ondelettes et m
´
ethodes comparatives:
´
etude d ’une courbe de charge
´
electrique,” RevuedeStatistique
Appliqu
´
ee, vol. 42, no. 2, pp. 57–77, 1994.
[2] M. E. Degaudenzi and C. M. Arizmendi, “Wavelet-based frac-
tal analysis of electrical power demand,” Fractals, vol. 8, no. 3,
pp. 239–245, 2000.
[3] S.Santoso,E.J.Powers,andW.M.Grady,“Powerqualitydis-
turbance data compression using wavelet transform methods,”
IEEE Transactions on Power Delivery, vol. 12, no. 3, pp. 1250–
1256, 1997.
[4]S.Santoso,W.M.Grady,E.J.Powers,J.Lamoree,andS.C.
Bhatt, “Characterization of distribution power quality events
with Fourier and wavelet transforms,” IEEE Transactions on
Power Delivery, vol. 15, no. 1, pp. 247–254, 2000.
[5] P. Pierz and E. Rosołowski, “Analysis and reconstruction of the
shape of the voltage sag using wavelet transform,” in Fachta-
gung Elektrische Energie wandlungssysteme, pp. 74–77, Magde-
burg, Germany, March 2002.
[6]T.Croes,C.Gherasim,J.VanDenKeybus,J.Ghijselen,J.
Driesen, and R. Belmans, “Power measurement using the
wavelet transform of analytic signals,” in Proceedings of the
11th International Conference on Harmonics and Quality of
Power, pp. 338–341, Lake Placid, NY, USA, September 2004,
CD-ROM.
[7] C H. Lee, Y J. Wang, and W L. Huang, “A literature survey
of wavelets in power engineering applications,” Proceedings of
the National Science Council, Republic of China, Part A, vol. 24,
no. 4, pp. 249–258, 2000.
[8] A. Woyte, V. V. Thong, R. Belmans, and J. Nijs, “Voltage fluc-
tuations on distribution level introduced by photovoltaic sys-
tems,” IEEE Transactions on Energy Conversion,vol.21,no.1,
pp. 202–209, 2006.
[9] A.Woyte,M.Bodach,R.Belmans,andJ.Nijs,“Powerfluctua-
tions in micro-grids introduced by photovoltaics: analysis and
solutions,” in Proceedings of the 2nd European PV-Hybrid and
Mini-Grid Conference, pp. 449–454, Kassel, Germany, Septem-
ber 2003.
[10] A. Woyte, R. Belmans, and J. Nijs, “Fluctuations in instanta-
neous clearness index: Analysis and statistics,” Solar Energ y,
vol. 81, no. 2, pp. 195–206, 2007.
[11] G. P. Nason and B. W. Silverman, “The stationary wavelet
transform and some statistical applications,” in Wavelets and
Statistics, A. Antoniadis and G. Oppenheim, Eds., vol. 103 of
Lecture Notes in Statistics, pp. 281–299, Springer, New York,
NY, USA, 1995.
[12] G. P. Nason, R. von Sachs, and G. Kroisandt, “Wavelet pro-
cesses and adaptive estimation of the evolutionary wavelet
spectrum,” Journal of the Royal Statistical Society. Series B,
vol. 62, no. 2, pp. 271–292, 2000.
[13] S. Van Bellegem and R. von Sachs, “Locally adaptive esti-
mation of sparse evolutionary wavelet spectra,” Discussion
Paper 310, Institut de Statistique, Universit
´
eCatholiquede
Louvain, Louvain-la-Neuve, Belgium, May 2003, http://www.
stat.ucl.ac.be/ISpersonnel/vanbelle/res.html.
[14] E. C. Kern Jr., E. M. Gulachenski, and G. A. Kern, “Cloud ef-
fects on distributed photovoltaic generation: slow transients
at the Gardner, Massachusetts photovoltaic experiment,” IEEE
Transactions on Energy Conversion, vol. 4, no. 2, pp. 184–190,
1989.
[15] W. Jewell and R. Ramakumar, “The effects of moving clouds
on electric utilities with dispersed photovoltaic generation,”
IEEE Transactions on Energy Conversion, vol. 2, no. 4, pp. 570–
576, 1987.
[16] H. Beyer, A. Hammer, J. Luther, J. Poplawska, K. Stolzenburg,
and P. Wieting, “Analysis and synthesis of cloud pattern for
radiation field studies,” Solar Energy, vol. 52, no. 5, pp. 379–
390, 1994.
[17] K. Otani, J. Minowa, and K. Kurokawa, “Study on areal so-
lar irradiance for analyzing areally-totalized PV systems,” Solar
Energy Materials and Solar Cells, vol. 47, no. 1–4, pp. 281–288,
1997.
[18] M. Iqbal, An Introduction to Solar Radiation, Academic Press,
Don Mills, Ontario, Canada, 1983.
[19] A. Skartveit and J. A. Olseth, “The probability density and au-
tocorrelation of short-term global and beam irradiance,” Solar
Energy, vol. 49, no. 6, pp. 477–487, 1992.
[20] H. Suehrcke and P. G. McCormick, “The frequency distribu-
tion of instantaneous insolation values,” Solar Energy, vol. 40,
no. 5, pp. 413–422, 1988.
[21] P. Bendt, M. Collares-Pereira, and A. Rabl, “The frequency
distribution of daily insolation values,” Solar Energy, vol. 27,
no. 1, pp. 1–5, 1981.
[22] J. M. Gordon and T. A. Reddy, “Time series analysis of hourly
global horizontal solar radiation,” Solar Energy,vol.41,no.5,
pp. 423–429, 1988.
[23] K. G. T. Hollands and R. G. Huget, “A probability density func-
tion for the clearness index, with applications,” Solar Energy,
vol. 30, no. 3, pp. 195–209, 1983.
8 EURASIP Journal on Advances in Signal Processing
[24] B. H. Y. Liu and R. C. Jordan, “The interrelationship and char-
acteristic dist ribution of direct, diffuse and total solar radia-
tion,” Solar Energy, vol. 4, no. 3, pp. 1–19, 1960.
[25] R. R. Coifman and D. L. Dohono, “Translation-invariant
denoising,” in Wavelets and Statistics, A. Antoniadis and
G. Oppenheim, Eds., vol. 103 of Lecture Notes in Statistics,pp.
125–150, Springer, New York, NY, USA, 1995.
[26] S. Mallat, A Wavelet Tour of Signal Processing, Academic Press,
San Diego, Calif, USA, 1999.
[27] J C. Pesquet, H. Krim, and H. Carfantan, “Time-invariant or-
thonormal wavelet representations,” IEEE Transactions on Sig-
nal Processing, vol. 44, no. 8, pp. 1964–1970, 1996.
[28] I. Daubechies, Ten Lectu res on Wavelets, SIAM, Philadelphia,
Pa, USA, 1992.
[29] A. V. Oppenheim and R. W. Schafer, Discrete-Time Signal Pro-
cessing, Prentice-Hall, Englewood Cliffs, NJ, USA, 1989.
[30] M. Bodach, “Short term power backup in PV systems with ul-
tra capacitors,” in Proceedings of the 17th European Photovoltaic
Solar Energy Conference and Exhibition (EUPVSEC ’01),pp.
518–519, Munich, Germany, October 2001.
[31] M. H. Rahman, J. Nakayama, K. Nakamura, and S. Yamashiro,
“An intelligent grid-connected PV-ECS system with load lev-
eling function,” in Proceedings of the 3rd IASTED International
Conference on Power and Energy Systems (EUROPES ’03),pp.
75–80, Marbella, Spain, September 2003.
Achim Woyte received the Electr ical Engi-
neering degree from the University of Han-
nover (Germany) in 1997 and the Ph.D.
degree in engineering from the Katholieke
Universiteit Leuven (Belgium) in 2003. He
is coauthor of more than 50 scientific publi-
cations. He spent half a year working and
studying in Venezuela and Italy. He also
worked for over three years in electroheat
and high-voltage engineering at the Univer-
sity of Hannover. He worked out a Master’s thesis at the Solar En-
ergy Research Institute (ISFH) in Hameln/Emmerthal (Germany),
where he assessed grid-connected photovoltaic systems with regard
to the issue of partial shadowing. For his Ph.D. dissertation, he
investigated the grid integration of photovoltaic systems includ-
ing the assessment of photovoltaic components. At the beginning
of 2004, he joined the Policy Studies Department of the Brussels-
based consultant 3E. There, he coordinates policy-related projects
in renewable energy technology. He also performs research and en-
gineering regarding the integration of electricity from renewable
sources into power systems and markets.
Ronnie Belmans received the M.S. degree
in electrical engineering in 1979 and the
Ph.D. degree in 1984, both from the K. U.
Leuven, Belgium, the Special Doctorate in
1989, and the Habilitierung in 1993, both
from the RWTH, Aachen, Germany. Cur-
rently, he is a Full Professor with the K.
U. Leuven, teaching electric power and en-
ergy systems. His research interests include
technoeconomic aspects of power systems,
power quality, and distributed generation. He is also Guest Profes-
sor at Imperial College of Science, Medicine and Technology, Lon-
don, UK. Since June 2002, he is Chairman of the board of directors
of ELIA, the Belgian transmission grid operator.
Johan Nijs received the Electrical Engineer-
ing University degree in 1977, the Ph.D. de-
gree in applied sciences in 1982, and the de-
gree of Master of Business Administration
in 1994, all from the Katholieke Universiteit
Leuven, Belgium. After having worked, re-
spectively, at Philips (Belgium), K. U. Leu-
ven (Belgium), and I.B.M. Thomas J. Wat-
son Research Center (NY, USA), he joined
in 1984 the Interuniversity Micro Electron-
ics Center (IMEC) in Leuven, Belgium, where he became Group
Leader of the silicon materials and solar cell activities. In 2000, he
became an Associate Vice President and Department Director of
the Packaging, MEMS and Photovoltaics Department. From 1990
onwards, he has also been appointed Part-Time Associate Professor
at the K. U. Leuven. From 1995 till 1997, he also part-time managed
Soltech in Leuven, Belgium (Soltech commercializes photovoltaic
energy systems). Since December 2001, his main activity has been
the set-up of the IMEC spin-off company PHOTOVOLTECH in
Tienen, Belgium, which he fully joined in January 2003 as General
Manager. Photovoltech manufactures photovoltaic solar cells and
modules.