Báo cáo hóa học: "Research Article Discrete-Time Modelling of the Moog Sawtooth Oscillator Waveform" doc
Bạn đang xem bản rút gọn của tài liệu. Xem và tải ngay bản đầy đủ của tài liệu tại đây (1.84 MB, 15 trang )
Hindawi Publishing Corporation
EURASIP Journal on Advances in Signal Pr ocessing
Volume 2011, Article ID 785103, 15 pages
doi:10.1155/2011/785103
Research Ar ticle
Discrete-Time Modelling of the Moog Sawtooth
Oscillator Waveform
Jussi Pekonen,
1
Victor Lazzarini,
2
Joseph Timoney,
2
Jari Kleimola,
1
and Vesa V
¨
alim
¨
aki
1
1
Department of Signal Processing and Acoust ics, Aalto University School of Electrical Engineering, P.O. Box 13000, 00076 Aalto, Finland
2
Digital Sound and Music Technology Group, National University of Ireland, Maynooth, Co. Kildare, Ireland
Correspondence should be addressed to Jussi Pekonen, jussi.pekonen@aalto.fi
Received 13 October 2010; Revised 4 January 2011; Accepted 25 February 2011
Academic Editor: Federico Fontana
Copyright © 2011 Jussi Pekonen et al. This is an open access article distributed under the Creative Commons Attribution License,
which permits unrestricted use, distribution, and reproduction in any medium, provided the original work is properly cited.
Discrete-time modelling strategies of analogue Moog sawtooth oscillator waveforms are presented. Two alternative approaches
suitable for real-time implementation are proposed, one modelling the analogue waveform in time domain using phase distortion
synthesis and another matching the spectrum of an existing antialiasing sawtooth oscillator to the corresponding analogue
spectrum using a first-order IIR post-equalising filter. A parameter estimation procedure for both approaches is explained and
performed. Performance evaluation using polynomial fits for the estimated parameters is carried out, and good matches between
the model outputs and rec orded waveforms are obtained. The best match of the te sted algorithms is produced by the phase
distortion model and by post-equalising the fourth-order B-spline bandlimited step function sawtooth oscillator.
1. Introduction
Discrete-time modelling of analogue sound processing units
has recently become an active research topic. In addition to
the academic interest in the topic, music software companies
are continuously creating new plugins and applications that
emulate old analogue devices. One of the largest focuses for
the research on this topic is the emulation of the subtractive
sound synthesis principle of the early electronic synthesisers
of 1960s and 1970s. In those synthesisers, a spectrally rich
source signal, traditionally one or a sum of several function
generator waveforms, such as the sawtooth, the rectangular,
and the triangle waveform [1], is filtered with a time-varying
and typically resonant lowpass filter.
Due to the modular structure of the analogue synthesis-
ers, the digital emulation of the modules has been split into
separate research topics [2]. For the filter module, several
models especially for the popular Moog transistor-based
voltage-controlled ladder filter [3] have been suggested.
These models range from approximative linear circuit-
based models [4, 5]tomodelsthattakeintoaccountthe
nonlinearities characterising the filter sound [6–8]andto
models that use a Volterra series representation of the input-
output relationship of the filter [9, 10]. Models for another
popular synthesiser filter, the diode-based EMS VCS3 filter,
have also been suggested [11, 12]. Recently, Huovilainen
developed a nonlinear digital model for the second-order
resonant lowpass filter that appeared in the Korg MS-20
analogue synthesiser [13].
Whereas the filter models have been based on the
behaviour of the analogue circuit, the research on the
oscillators has mainly focused on creating bandlimited
algorithms that imitate the geometric textbook waveforms
(see, e.g., [14–16] for complete list of references). This focus
has been justified by the fact that the traditional, trivially
sampled, algorithms used to implement the oscillators suffer
from harsh aliasing, caused by the discontinuities in the
waveform or in the waveform derivative [17].
It has been noted that the output of an analogue oscillator
module differs from the respective textbook waveform
[18, 19]. Moreover, they also sound different with the
analogue oscillators being less harsh than the textbook
waveforms. Figure 1 illustrates this mismatch between the
textbook sawtooth waveform and the output of an analogue
sawtooth oscillator recorded from a Minimoog Voyager [20]
synthesiser’ s oscillator module (see [21]fortheoriginal
module circuit design used in its predecessor models) having
the fundamental frequency f
0
= 220.62 Hz. A sampling
2 EURASIP Journal on Advances in Signal Processing
frequency f
s
= 44.1 kHz was used for the recording. In this
case, the textbook sawtooth waveform is a signal containing
all harmonics whose amplitudes are inversely proportional to
the harmonic index. The recorded waveform does look like
the textbook waveform but the rising part of the oscillation
period is not linear (see Figure 1(a)). In fact, the rising
part in general resembles more a sinusoid than a linear
function but not immediately after the waveform reset.
The difference can also be seen in the waveform spectrum
depicted in Figure 1(b) where the approximately
−6dB per
octave spectral envelope of the textbook sawtooth is plotted
with a dashed line for comparison.
Furthermore, the difference between the textbook wave-
form and the analogue oscillator output depends on the
fundamental frequency. This can be seen in Figure 2 where
the waveform and the spectrum of the Minimoog Voyager
sawtooth output are plotted for f
0
= 2.096 kHz. There are
small differences in the waveforms (compare Figures 1(a)
and 2(a)), but the differences can be seen more clearly in
the spectrum plot. The higher harmonics of the high f
0
sawtooth (crosses i n Figure 2(b)) are lower in magnitude
than the respective harmonics of the low f
0
waveform (circles
in Figure 2(b), scaled in frequency). Moreover, the spectral
envelope differs from the low f
0
envelope (dash-dotted line
in Figure 2(b), shifted in magnitude so that the 0 dB level is
at the fundamental frequency 2.096 kHz).
So far, only two papers have dealt with the topic of
discrete-time modelling of an analogue audio oscillator
module. De Sanctis and Sarti derived a wave-digital filter
model for an astable multivib rator circuit in [22]. The astable
multivibrator discussed in [22] is based on operational
amplifiers whereas analogue synthesisers utilise discrete
components in their oscillator circuits more often. The
only model for the output waveform of such a circuit was
proposed in [19]. This introduced an ad-hoc Moog oscillator
model consisting of a scaled and shifted quarter of a sine
wave starting from
−1 and was reset once the waveform
reached +1. In other words, the model uses a part of a sine
wave whose frequency one fourth of the target f
0
.However,
the rapid transition of this simplified model results in large
aliasing as in the case of trivial sampling. A modification to
the model that utilises a second-order polynomial correction
function approximating a bandlimited step function [14]at
the waveform reset was also suggested in [19]. With this
modification the aliasing was greatly reduced. It should be
noted that the model proposed in [19] was actually an
example of the waveslicing technique discussed in that paper
and that the example happens to produce a waveform similar
to the Moog sawtooth oscillator.
In this paper, alternative f
0
-dependent approaches to
simulate the Moog sawtooth oscillator are proposed. A
set of recorded sawtooth waveforms from the Minimoog
Voya g er [20] is used as a reference. The reference signals were
recorded directly from the oscillator module output without
feeding them through the filter module using an M-Audio
Quattro audio interface with sampling frequency 44100 KHz
and resolution of 16 bits. Two novel discrete-time modelling
strategies well suited for real-time implementation are p ro-
posed. The proposed strategies are based on signal modelling
that tries to mimic the recorded waveform by synthesising
a signal that has similar signal characteristics. This signal-
based approach enables the use of readily available tools
in the synthesis, and it avoids design-dependent issues, for
example, the discretisation method and delay-free loops,
present in circuit-based modelling.
The remainder of this paper is organised as follows.
First, Section 2 introduces direct waveform modelling using
phase dist ortion synthesis. Then, a more general post-
processing equalising filter approach for existing antialiasing
oscillator algorithms is presented in Section 3.Themethods
are evaluated by determining their spectral error from the
reference signals. Finally, Section 4 concludes the paper.
2. Waveform-Based Modelling Using Phase
Distortion Synthesis
The first discrete-time model of the Moog sawtooth wave-
form oscillator proposed here is based on direct time-domain
modelling of the target waveform using phase distortion
(PD) synthesis [23–26]. In PD synthesis, the normally
linear f
0
-dependent phase trajectory φ
lin
(t) of a sinusoid is
modified with a nonlinear shaping function f (x), that is, t he
phase distorted sinusoid is given by
y
PD
(
t
)
= sin
f
φ
lin
(
t
)
+ φ
0
,
(1)
where t is time and φ
0
is the initial phase. This approach is
effectively the same as phase (or frequency) modulation as
the phase shaping function can be decomposed into a linear
part and a time-varying component [24–26]as
f
φ
lin
(
t
)
=
φ
lin
(
t
)
+ φ
mod
(
t
)
= 2πt + φ
mod
(
t
)
,(2)
where φ
mod
(t) is the time-varying component. For the PD
sawtooth waveform originally described in [23], φ
0
=−π/2
and φ
mod
(t) is given as a skewed sawtooth (triangular)
function expressed as
φ
mod,saw
(
t
)
=
(
π
− 2πP
)
×
⎧
⎪
⎪
⎨
⎪
⎪
⎩
t
P
(
t mod 1
)
<P,
1
− t
1 − P
(
t mod 1
)
≥ P,
(3)
where P
∈ [0, 1] is the fraction of the period during which
the sawtooth function is rising [24, 25].
Applying (2)and(3)to(1)yields
y
PD,saw
(
t
)
= sin
2πt + φ
mod,saw
(
t
)
−
π
2
=−
cos
2πt + φ
mod,saw
(
t
)
,
(4)
which produces a waveform that resembles the sawtooth
waveform. With P<.5, the maximum of the waveform
is closer to the beginning of oscillation period, and when
P>.5, the maximum is closer to the end of the period. With
P
= .5, the modulation function φ
mod,saw
(t) does not have
an y effect since it will be zer o at all time instants.
EURASIP Journal on Advances in Sig nal Processing 3
024681012
−1
0
1
Time (ms)
Level
(a)
0 5 10 15 20
−80
−60
−40
−20
0
Frequency (kHz)
Magnitude (dB)
(b)
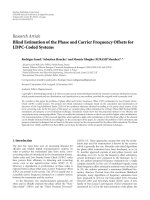
Figure 1: (a) Recorded Moog sawtooth waveform having the fundamental frequency f
0
= 220.62 Hz. The spectrum of the waveform is
shown in (b) together with the approximately
−6 dB per octave spectral envelope of the textbook sawtooth waveform (dashed line). Sampling
frequency f
s
= 44.1 kHz was used for the recording. In (a), the dashed line represents the textbook sawtooth waveform.
0 0.5 1
Time (ms)
−1
0
1
Level
(a)
0 5 10 15 20
−80
−60
−40
−20
0
Frequency (kHz)
Magnitude (dB)
(b)
Figure 2: (a) Waveform and (b) s pectrum of the recorded Moog sawtooth having f
0
= 2.096 kHz. In (b), the crosses indicate the magnitudes
of the waveform harmonics, the circles represent the magnitudes of the frequency-scaled harmonics of the recorded sawtooth waveform
having f
0
= 220.62 Hz, and the dash-dotted line is the magnitude-shifted spectral envelope of the sawtooth oscillator output for f
0
=
220.62 Hz . The dashed line represents the waveform and the spectral envelope of the te xtbook sawtooth in (a) and (b), respectively.
The model proposed in [19] can be understood as a
special case of the PD synthesis model described above.
That model has the PD model parameters φ
0
= 0and
φ
mod
(t) =−7πt/4+Δ(t), where Δ(t) is an impulse-train-
like function that modifies the phase of the two samples
around the waveform reset. The difference between the
model of [19] and the general PD model discussed in this
paper is demonstrated in Figure 3, where the phase-shaping
functions of the two models are plotted.
2.1. Model Parameter Estimation. In order to produce PD
sawtooth waveforms that resemble the Moog sawtooth
waveform, the model parameter P must be fitted to produce
replicas of the target waveforms that are as close as possible.
The model parameter can be estimated from the phase
trajectory of the reset portion of a recorded waveform. Since
the recorded waveforms have their maxima close to the end
of the oscillation period (see Figures 1(a) and 2(a)), the phase
trajectory of the reset portion can be approximated to be
linear as given by
φ
reset
(
t
)
= 2πt +
(
π − 2πP
)
1
− t
1 − P
= 2π
1 −
1 − 2P
2 − 2P
t +
1
− 2P
2 − 2P
.
(5)
0
0
0.5 1
P
1
0.5
0.25
f (φ
lin
(t))/(2π)
φ
lin
(t)/(2π)
Figure 3: The phase-shaping functions of the ad-hoc model
without the waveform reset modification presented in [19](dashed
line) and the phase distortion model discussed in this paper (solid
line).
Now , the model parameter P can be estimated by fitting
a linear approximation to the phase trajectory of the reset
part of the recorded waveforms. By choosing at least two
samples from the reset part and by applying the in verse
cosine function to the negated values of these selected points
(with a caution on phase wrapping performed by the inverse
cosine function), a set of phase data points are obtained. For
4 EURASIP Journal on Advances in Signal Processing
Fundamental frequency (Hz)
100 1000 8000
1
0.95
0.9
0.85
0.8
Estimated P
(a)
Fundamental frequency (Hz)
100 1000 8000
1
0.95
0.9
0.85
0.8
Estimated P
(b)
Fundamental frequency (Hz)
100 1000 8000
1
0.95
0.9
0.85
0.8
Estimated P
(c)
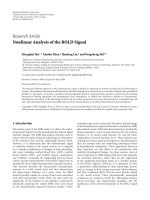
Figure 4: Phase distortion (PD) model parameter estimate means (plus signs) and (a) a first-order and (b) a second-order fit to the estimate
data using all data points. (c) A first-order fit to the estimate data using data points below 4 kHz.
these phase data points, a linear fit can be computed, and
from the coefficients of the fit an estimate for P is obtained
using the relations given in (5). In order to improve the
estimate, this procedure can be carried out for several reset
parts, and the mean of these estimates can be used as the
model parameter for that fundamental frequency.
Using the approach described above, the model parame-
ter P was estimated from five reset parts of 47 recorded Moog
sawtooth waveforms having different f
0
in the range from
86 Hz to 8.3 kHz. The estimated model parameter data as a
function of the fundamental frequency is shown in Figure 4
with plus signs. The data shows a clear dependency on f
0
,
being close to one at low frequencies and the estimated P
decreases as the fundamental frequency increases. In order
to analyse the dependency, low-order polynomial fits for the
estimated data in the least-squares sense were so ught. In
Figure 4(a), a first-order fit of the estimated data is plotted
using the whole data set, and a second-order fit is plotted in
Figure 4(b). Both low-order polynomials generally provide
a good match to the estimated P, but at low fundamental
frequencies, which are more common in musical signals, the
first-order fit differs from the estimated data more than the
second-order fit. A first-order fit was also made only for the
estimated data points below 4 kHz. This linear fit, given by
P
f
0
=
0.9924 − 0.00002151 f
0
,
(6)
is plotted in Figure 4(c), showing an e xcellent match at
low frequencies while producing smaller P values than the
estimated data at high frequencies.
When the polynomial approximation is used, the f
0
-
dependent model parameter P can be computed directly
from the fundamental frequency with a lower computational
cost and memory consumption than in the case where the
estimated parameter values are tabulated. In the table-based
parameter computation, the real-time control of the model
parameter is not as trivial as with the polynomial approxi-
mation when the fundamental frequency is modulated with
a low frequency oscillator or an envelope. In that case, the
time-varying fundamental frequency needs to be mapped
to a table index using a nonlinear function which is com-
putationally more costly than the evaluation of a low-order
polynomial that utilises the fundamental frequency value
per se. Furthermore, the table-based approach consumes
more memory than a polynomial approximation that has
only a few constant coefficients which do not need to be
tabulated at all. On the other hand, the deviation of the linear
approximation of (6) from the estimated parameter values
at high fundamental frequencies is in fact advantageous due
to lowered aliasing. The farther P is from .5, the faster the
waveform reset is and the more aliasing the PD sawtooth will
contain.
2.2. Model Evaluation. Figure 5 shows the match of the PD
model output to the recorded Moog sawtooth oscillator
output with fundamental frequency f
0
= 220.62 Hz using
the estimated value of model parameter P.InFigures5(a)
and 5(b), the waveform and the spectrum of the PD model
are drawn, respectively, together with the waveform and the
spectral envelope of the recorded signal (dashed line). The
EURASIP Journal on Advances in Sig nal Processing 5
012345678910111213
−1
0
1
Time (ms)
Level
(a)
0
2 4 6 8 10 12 14 16 18 20 22
−80
−60
−40
−20
0
Frequency (kHz)
Magnitude (dB)
(b)
0123456789101112131415
0
2
4
Frequency (kHz)
Error (dB)
(c)
Figure 5: (a) Waveform, (b) the spectrum, and (c) the harmonic magnitude error of the PD model of the Moog sawtooth oscillator output,
that is, the difference between the model output harmonic magnitudes and the magnitudes of the recorded signal harmonics, at f
0
=
220.62 Hz. A s the model parameter, the estimated value was used. The waveform and the spectral envelope of the recorded signal is drawn
with a dashed line in (a) and (b), respectively, for comparison.
PD model provides a faithful imitation of the recorded signal,
differing mainly at ver y high frequencies. Some aliasing can
be seen in Figure 5(b), but it is mainly at high frequencies
where human hearing is less sensitive [27]. Figure 5(c) shows
the harmonic magnitude error, that is, the difference between
the model output harmonic magnitudes and the magnitude
of the recorded harmonics, for harmonic frequencies below
15 kHz. The harmonic magnitude error above 15 kHz is not
of great interest because human hearing is very insensitive
above this frequency [27]. As one can see, the harmonic
magnitude error b elow 15 kHz is within a few decibels at all
harmonics.
Figure 6 shows the match of the PD synthesis m odel to
the recorded Moog sawtooth oscillator with f
0
= 2.096 kHz
using the estimated model parameter. The waveform and the
spectrum in Figures 6(a) and 6(b) show a larger mismatch
to the recorded waveform than in the case of low f
0
(see
Figures 5(a) and 5(b)). The harmonic magnitude error,
shown in Figure 6(c), is slightly larger than in the low
f
0
example (see Figure 5(c)). Moreover, the output of the
high f
0
PD model contains more aliasing than the low
f
0
model, as one could expect. However, the aliasing in
this example case is focused close to the harmonics, and
it is inaudible due to the frequency masking phenomenon
[27]. It should be noted that this focusing of aliasing close
to the harmonic components is not characteristic to all
fundamental frequencies, and hence conclusions on the
audibility of aliasing at arbitrary fundamental frequencies
should not be drawn from this example.
From Figures 5 and 6, one can conclude that the
harmonic magnitude error depends on the fundamental
frequency. In order to evaluate this, the error of the harmonic
components below 15 kHz was computed for the funda-
mental frequencies used in the PD model parameter esti-
mation and the evaluation results are shown in Figure 7.In
Figure 7(a), the root mean squared error (RMSE) of the PD
model is plotted for all tested fundamental frequencies with a
solid line for the linear approximation of (6). In addition, the
RMSE of the PD model using the estimated model parameter
values is plotted with c rosses for comparison in Figure 7(a).
It can be noted that the polynomial approximation of the
model parameter produces an error comparable to the error
obtained with the estimated values, and hence the use of
the polynomial approximation of P provides accuracy-wise
as a good match as the tabulated estimates to the recorded
waveform. The RMSE of the PD model is small (around
−50 dB) at low fundamental frequencies and becomes larger
when f
0
is increased.
However, since the RMSE is a m easure of the averaged
error at the harmonic components, it may ignore possibly
6 EURASIP Journal on Advances in Signal Processing
0 0.1 0.2 0.3 0.4 0.5 0.6 0.7 0.8 0.9 1 1.1 1.2 1.3 1.4
−1
0
1
Time (ms)
Level
(a)
0246810121416182022
−80
−60
−40
−20
0
Frequency (kHz)
Magnitude (dB)
(b)
0
2
4
6
8
0 1 2 3 4 5 6 7 8 9 10 11 12 13 14 15
Frequency (kHz)
Error (dB)
(c)
Figure 6: (a) Waveform, (b) the spectrum, and (c) the harmonic magnitude error of the PD model of the Moog sawtooth oscillator output at
f
0
= 2.096 kHz. The waveform and the spectral envelope of the recorded signal are again drawn with dashed line in (a) and (b), respectively.
100 1000 8000
−50
−40
−30
−20
Fundamental frequency (Hz)
RMSE (dB)
(a)
0
5
10
15
Max error (dB)
100 1000 8000
Fundamental frequency (Hz)
(b)
Figure 7: (a) Root mean squared error (RMSE) of the harmonics and (b) the maximum absolute harmonic magnitude error of the PD
model (solid line) and the reset-corrected model of [19] (dashed line) as a function of f
0
between 86 Hz and 8.3 kHz. The RMSE and the
maximum absolute harmonic magnitude error of PD models that use the estimated parameter values and a single parameter value estimated
for f
0
= 524 Hz at all frequencies are plotted with crosses and circles, respectively, for comparison.
large errors of individual harmonics. In order to evaluate
this aspect too, the maximum absolute harmonic magnitude
error was also computed for the harmonics below 15 kHz.
Figure 7(b) shows the maximum harmonic error of the PD
model as a function of the fundamental frequency with a
solid line for the polynomial approximation of the model
parameter and with crosses for the estimated P values.
Now, the PD oscillator that uses the polynomial approx-
imation of the model parameter produces a very large
error at low fundamental frequencies, whereas the esti-
mated parameter values yield a smaller maximum absolute
harmonic magnitude error. However, above 150 Hz, the
polynomial approximation yields an error that is comparable
to the estimated values, being w ithin a few decibels. At low
fundamental frequencies, the large error of the polynomial
approximation oscillator is produced by one of the highest
harmonics in the tested bandwidth. This happens because
P is very close to one at low frequencies (see (6)) which
EURASIP Journal on Advances in Sig nal Processing 7
effectively results in a faster waveform reset and increased
high-frequency content. Since the spectral envelope of the
Moog sawtooth clearly differs from the spectral envelope
of the textbook sawtooth (see Figures 1 and 2), the model
produces larger harmonic magnitude error at one of the
highest harmonics. However, since the waveform has many
harmonics at low fundamental frequencies, the averaging
process of the RMSE measure decreases the significance of
these large individual errors.
On the other hand, it would be advantageous to use a
single model parameter at all fundamental frequencies as it
would alleviate the computation of the PD model parameter
value from the synthesis control data (namely f
0
in this
case). However, as indicated with circles in Figure 7,thePD
sawtooth that uses a single parameter estimated for f
0
=
524 Hz at all frequencies has larger RMSE and maximum
absolute harmonic magnitude error than the polynomial-
based oscillator, except in the frequency range from 250 Hz
to 400 Hz. Therefore, the model parameter needs to be f
0
-
dependent, and the best match to the reference waveforms
with the lowest possible computational cost is obtained by
using the linear approximation of (6)ofthePDmodel
parameter P.
Figure 7 also shows the corresponding RMSE and max-
imum absolute harmonic magnitude error for the reset-
corrected model of [19] with dashed lines. As one can
observe, the RMSE of this model is worse than that of
the proposed PD model. However, the maximum harmonic
error is approximately comparable to the error of the PD
model proposed here. At very low frequencies, where the
maximum harmonic error of the PD model is large, the reset-
corrected model of [19] has lower error, but above 150 Hz the
error is at least as large as that of the PD model.
From Figures 5, 6,and7 it can be concluded that
the PD model that uses the polynomial approximation of
the model parameter can be used to produce waveforms
that match well to the recorded Moog sawtooth oscillator
waveforms. However, the accuracy of the model depends
on the fundamental frequency as with some frequencies
the model produces an excellent match, while with other
frequencies the match is slightly poorer. Nevertheless, the
PD model with the polynomial approximation of the f
0
-
dependent parameter P produces a good match to the target
using a simplified and efficient control.
3. Post-Equalisation of Antialiasing
Oscillator Outputs
Whereas the phase distortion model discussed in Section 2
was based on time-domain modelling of the Moog sawtooth
oscillator waveform, the second model proposed here is
based on frequency-domain matching. This approach uses
an existing antialiasing sawtooth oscillator algorithm, which
models the ideally bandlimited sawtooth and filters the
output of that algorithm with a low-order filter to produce
a spectrum that is a close replica of the spectrum of the
recorded signal. In other words, this model is a source-
filter approach whose filter modifies the spectrum of the
antialiasing oscillator towards the spectrum of the analogue
oscillator module.
3.1. Antialiasing Oscillator Used as the Source. Here, five
different antialiasing oscillator algorithms are considered.
These oscillator algorithms are chosen to represent a variety
of currently available approaches, and they are briefly
reviewed next.
3.1.1. Ideally Bandlimited Sawtooth Oscillator. As the first
approach, an ideally bandlimited oscillator algorithm is
considered. This approach produces only the harmonics
below the Nyquist limit, the number of which is given by
K
=f
s
/(2 f
0
) with x denoting the floor function, that
is, rounding to the integer part. The ideally bandlimited
sawtooth waveform is then given as
y
bl
(
n
)
=−
2
π
K
k=1
sin
2πk f
0
n/ f
s
k
,
(7)
where n is the sample index, which is obtained by taking
the K first terms from the Fourier series representation of
the continuous-time sawtooth waveform. There are a few
alternative approaches to synthesise the ideally bandlimited
sawtooth, the most familiar ones being additive [28]and
wavetable [29]synthesis.
3.1.2. Third-Order B-Spline Polynomial BLIT Sawtooth Oscil-
lator. The second algorithm considered here is the third-
order B-spline p olynomial bandlimited impulse train (BLIT)
algorithm [15]. The idea in the BLIT algorithm is to generate
a sequence of bandlimited impulses that is then integrated
to produce the bandlimited waveform [ 30]. Since the ideal
bandlimited impulse is the well-known sinc function which
is infinitely long [30], it is approximated in practical reali-
sations, resulting in an approximately bandlimited impulse
which has aliasing mainly at high frequencies. The third-
order B-spline BLIT algorithm uses the third-order B-spline
basis function as the approximation of the bandlimited
impulse [15]. The basis function is synthesised with a third-
order FIR filter given by
H
b
3
(
z, d
)
=
3
k=0
b
3
(
k, d
)
z
−k
,
(8)
where d is the fractional delay from the discontinuity to
thesamplefollowingitandb
3
(k, d), k = 0, 1, 2,3 are the
filter coefficients as a function of d as given in Table 1 .Note
that these coefficients differ from those given in [15] due
to the fact that here the impulse needs to be multiplied by
−2 in order to get the desired waveform reset. This filter
is triggered at each discontinuity according to the delay
the impulse needs to be shifted in time. By integrating the
resulting impulse train, an approximation of the bandlimited
sawtooth waveform is obtained. In this paper, a second-order
leaky integrator, expressed as [31]
H
int
(
z
)
=
π
(
1 − 0.9992
)
1 − z
−1
2
(
1 − 0.9992z
−1
)(
1
− 0.9992z
−1
)
,
(9)
8 EURASIP Journal on Advances in Signal Processing
Table 1: Filter coefficients for the third-order B-spline bandlimited
impulse train (BLIT) synthesiser as a function of the fractional delay
d.
kb
3
(k, d)
0 −d
3
/3
1 d
3
− d
2
− d − 1/3
2
−d
3
+2d
2
− 4/3
3 d
3
/3 − d
2
+ d − 1/3
is used. This integrator suppresses the DC component which
would otherwise have to be added to every sample of the
impulse train.
3.1.3. Fourth-Order B-Spline Polynomial BLEP Sawtooth
Oscillator. As the third algorithm, an extension of the third-
order B-spline BLIT algorithm, the fourth-order B-spline
polynomial bandlimited step function (BLEP) algorithm
[32], is used. In the BLEP algorithm, the integration required
by the BLIT algorithm (see above) is performed before-
hand [31]. Integrating the bandlimited impulse yields an
approximation of a bandlimited step function, a bandlimited
representation of a waveform discontinuity [31]. As the ideal
bandlimited impulse, the sinc function, is infinitely long,
so is t he ideal bandlimited step function [32]. Therefore,
for practical realisations an approximation of the ideal
bandlimited step function needs to be computed. In the
fourth-order B-spline BLEP algorithm, the third-order B-
spline basis function is analytically integr ated with respect
to time [32] and a fourth-order polynomial approximation
of the ideal step function is obtained. Typically the resulting
function is not applied as is, instead the difference between
the bandlimited step function and the nonbandlimited step
function is added onto the trivial nonbandlimited waveform
at each discontinuity [14, 33]. That is, the impulse response
of a third-order FIR filter given by
H
B
4
(
z, d
)
=
3
k=0
B
4
(
k, d
)
z
−k
,
(10)
where B
4
(k, d), k = 0, 1, 2,3 are the fourth-order B-spline
polynomial BLEP filter coefficients as a function of the
fractional delay as given in Table 2 , is summed onto the
output of the trivial sawtooth oscillator at each discontinuity
as a correction function [32]. Again, the coefficients of the
filter given in [32]arescaledby
−2.
3.1.4. Second- and Fourth-Order DPW Sawtooth Oscillators.
The remaining two approaches are two cases of the differenti-
ated polynomial waveform (DPW) algorithm [16]. In DPW,
the basic idea is to reduce the aliasing of a sawtooth waveform
by modifying the spectral tilt of the signal to be sampled [16,
34]. In practice this is implemented by integrating the linear
ramp function of the sawtooth waveform. Each integration
reduces the spectral envelope by approximately
−6dB per
octave, for example, the first integral of the linear r amp,
that is, a parabola, has an approximately
−12 dB per octave
spectral envelope compared to the approximately
−6dB
Table 2: Filter coefficients for the fourth-order B-spline bandlim-
ited step function (BLEP) algorithm as a function of the fractional
delay d.
kB
4
(k, d)
0 −d
4
/12
1 d
4
/4 − d
3
/3 − d
2
/2 − d/3 − 1/12
2
−d
4
/4+2d
3
/3 − 4d/3+1
3 d
4
/12 − d
3
/3+d
2
/2 − d/3+1/12
per octave envelope of the linear ramp [16]. Sampling this
tilted waveform suppresses the aliasing. Now, the sampled
polynomial waveform, which can be computed in advance,
needs to be differentiated to retain the orig inal spectral
envelope of the sawtooth waveform [16, 34]. The number of
required differentiators is equal to the number of integration
steps performed, that is, if the polynomial waveform to be
sampled is the N th integral of the linear ramp, the resulting
signal needs to be differentiated N times in order to obtain
the sawtooth waveform [16].
Here, we consider the second-order DPW algorithm
which samples the square of the trivial sawtooth waveform
s(t),
x
DPW,2
(
t
)
= s
(
t
)
2
, (11)
and filters it with t he first-order differentiator [34],
H
diff
(
z
)
= 1 − z
−1
,
(12)
and the fourth-order DPW algorithm which samples a
fourth-order polynomial
x
DPW,4
(
t
)
= s
(
t
)
4
− 2s
(
t
)
2
(13)
and filters it with a cascade of three first-order differentiators
[16]. In addition, both approaches need a post-scaling
operation that retains the waveform amplitude suppressed by
the nonideal differentiation [16, 34].
3.1.5. Note on the Ideally Bandlimited Sawtooth Oscillator. It
should be noted that the ideally bandlimited approach could
be used to synthesise the analogue sa wtooth directly using
the levels and phases of the analogue waveform harmonics.
With the other approaches discussed in this paper this
is not possible directly since they have spectra that are
characteristic to the algorithm and not controllable. Here,
the ideally bandlimited oscillator that has exactly the levels
of the textbook sawtooth is used as a reference example
of an oscillator that synthesises the bandlimited textbook
sawtooth perfectly. In this paper, the ideally bandlimited
oscillator is implemented using additive synthesis. However,
note that since the computational cost of additive synthesis
oscillator is considered large (inversely proportional to the
fundamental frequency), it limits both the polyphony and
the computing power available for other tasks such as
filtering and effects processing. Therefore, it is not suitable
for real-time implementation in general.
EURASIP Journal on Advances in Sig nal Processing 9
100 1000 8000
1
0.8
0.6
g
Fundamental frequency (Hz)
(a)
100 1000 8000
Fundamental frequency (Hz)
b
1
0.5
0
−0.5
−1
(b)
100 1000 8000
Fundamental frequency (Hz)
a
1
0.5
0
−0.5
(c)
Figure 8: First-order filter parameter estimates (plus signs) for the ideally bandlimited oscillator: (a) the gain factor g,(b)thefilterzerob,
and (c) the filter pole a. The solid lines represent the polynomial approximations of the filter parameters.
3.2. Filter Estimation. The oscillator algorithms described
above obviously have a spectral e nvelope that differs from
the spectral envelope of the Moog sawtooth oscillator. In
order to modify the envelope of an oscillator to match the
target envelope, the oscillator output is filtered with a low-
order filter. For the filter estimation, a frequency-weighted
least-squares minimisation of the magnitude response error
at the waveform harmonic frequencies was performed [35].
As the frequency-weighting function, a piecewise constant
function which has unity weight for all the other harmonic
components except the nine lowest harmonics, which had a
weight of 10, and the fundamental frequency, which had a
weight of 100, was used. With this weighting function, the
first ten components, which contribute quite a lot to the
timbral perception, are emphasised.
A first-order IIR filter given by
H
eq
(
z
)
= g
1
− bz
−1
1 − az
−1
(14)
was considered as the post-equalising filter due to its
simplicity. The parameters g, b,anda,thegainfactor,
the filter zero, and the filter pole, respectively, of H
eq
(z)
were estimated from the recorded data using the approach
described above.
The estimated filter parameters for the ideally bandlim-
ited oscillator are shown in Figure 8 with plus signs. Again,
the filter parameter exhibits dependency on the fundamental
frequency. The gain factor g (see Figure 8(a))showsan
approximately linear dependency on f
0
,andthefilterzero
b and pole a show approximately quadratic dependency (see
Figures 8(b) and 8(c), resp.). For the estimated data, a first-
order fit for the gain factor and second-order fits for the
filter zero and pole were computed in the least-squares sense.
These approximations are also shown in Figure 8 with solid
lines. As one can observe, they provide a good match to the
estimated parameter data. These parameter fits, expressed as
g,
b, a
f
0
=
c
2
f
2
0
+ c
1
f
0
+ c
0
, (15)
where c
i
is the ith fit coefficient, can be used to control the fil-
ter parameters as a function of f
0
.Thefittedcoefficient values
for the ideally bandlimited oscillator are given in Table 3 .
For the other oscillator approaches, similar relationships
between the fundamental frequency and the filter parameters
were found. This is indicated in Figure 9 for the third-
order B-spline BLIT and the fourth-order B-spline BLEP
sawtooth oscillators and in Figure 10 for the second-order
DPW and the fourth-order DPW sawtooth oscillators. The
respective polynomial filter parameter fit coefficients are
given in Tab l e 4. A gain, the polynomial fits match quite
well to the estimated parameter data. The fits are better
with the third-order B-spline BLIT, the fourth-order B-spline
BLEP, and the fourth-order D PW algorithm than with the
ideally bandlimited and the second-order DPW algorithm.
Moreover, as with the ideally bandlimited algorithm, the
polynomial fits are better for t he filter zero and pole than
forthefiltergain.However,thesesmallmismatchesofthe
polynomial fits to the estimated data do not produce very
severe errors in the output as discussed next.
10 EURASIP Journal on Advances in Signal Processing
100 1000 8000
1
0.8
0.6
g
Fundamental frequency (Hz)
(a)
100 1000 8000
1
0.8
0.6
g
Fundamental frequency (Hz)
(b)
100 1000 8000
Fundamental frequency (Hz)
b
1
0.5
0
−0.5
−1
(c)
100 1000 8000
Fundamental frequency (Hz)
b
1
0.5
0
−0.5
−1
(d)
100 1000 8000
Fundamental frequency (Hz)
a
1
0.5
0
−0.5
(e)
100 1000 8000
Fundamental frequency (Hz)
a
1
0.5
0
−0.5
(f)
Figure 9: The gain factor g,thefilterzerob, and the filter pole a estimates (plus signs) for (a), (c), and (e) the third-order B-spline BLIT and
(b), (d), and (f) the fourth-order B-spline BLEP, respectively, and the polynomial approximations of the filter parameters (solid lines).
Table 3: Coefficients of the polynomial fits for the first-order post-
equalising filter parameters for the ideally bandlimited sawtooth
oscillator.
c
i
Filter parameter
i
g
b
1
a
1
0 0.5400 0.3894 0.6398
14.473
× 10
−5
−3.102 × 10
−4
−2.417 × 10
−4
20 2.417 × 10
−8
1.335 × 10
−8
3.3. Filter Design Evaluation. Figure 11 shows the match of
the waveforms of the filtered antialiasing sawtooth oscillators
to the recorded Moog sawtooth oscillator output with fun-
damental frequencies of 220.62 Hz and 2.096 kHz. In Figures
11(a) and 11(b) are shown the filtered ideally bandlimited
waveforms. Figures 11(c) and 11(d) depict the waveforms
of the output of the p ost-equalising filter applied to the
third-order B-spline BLIT oscillators. The filtered fourth-
order B-spline BLEP waveforms are plotted in Figures 11(e)
and 11(f).Figures11(g) and 11(h) show the filtered second-
order DPW oscillator, and the filtered fourth-order DPW
waveforms are plotted in Figures 11(i) and 11(j).
In Figure 11, it can be seen that the match of the filtered
oscillator outputs depends on both the oscillator and the
fundamental frequency . Therefore, as with the PD model,
the root mean squared error and the maximum absolute har-
monic magnitude error of the filtered oscillator outputs with
respect to the respective recorded Moog sawtooth oscillator
signals were computed using the polynomial approximations
of the filter parameters, and the error measures are shown in
Figure 12.Figures12(a) and 12(b) depict the error measures
for the filtered ideally bandlimited sawtooth with a solid line.
In Figures 12(c) and 12(d), the RMSE and the maximum
absolute harmonic magnitude error of the filtered third-
order BLIT oscillator are plotted, respectively, with a solid
line. In addition, the error measures of the filtered fourth-
order BLEP sawtooth are plotted in Figures 12(c) and 12(d)
with a dashed line. The error measures of the filtered second-
EURASIP Journal on Advances in Signal Processing 11
100 1000 8000
1
0.8
0.6
g
Fundamental frequency (Hz)
(a)
100 1000 8000
1
0.8
0.6
g
Fundamental frequency (Hz)
(b)
100 1000 8000
Fundamental frequency (Hz)
b
1
0.5
0
−0.5
−1
(c)
100 1000 8000
Fundamental frequency (Hz)
b
1
0.5
0
−0.5
−1
(d)
100 1000 8000
Fundamental frequency (Hz)
a
1
0.5
0
−0.5
(e)
100 1000 8000
Fundamental frequency (Hz)
a
1
0.5
0
−0.5
(f)
Figure 10: Filter parameter estimates (plus signs) of (a), (b) the gain factor g,(c),(d)thefilterzerob, and (e), (f) the filter pole a for the
second- and fourth-order DPW oscillator, respectively. The polynomial approximations of the filter parameters are given with solid lines.
and fourth-order DPW algorithms are shown in Figures
12(e) and 12(f) with a solid and a dashed line, respectively.
In Figure 12 it can b e seen that the ideally bandlimited
oscillator has the largest root mean squared error (RMSE)
compared to the other oscillators (see Figures 12(a), 12(c),
and 12(e)). M oreover, the same observation can be made
for the maximum absolute harmonic magnitude error (see
Figures 12(b), 12(d),and12(f)). The differences in the
error measures are explained by the fact that all algorithms,
other than the ideally bandlimited sawtooth oscillator, have
inherently a spectral envelope that differs from the textbook
sawtooth’s
−6 dB per octave envelope [15, 16, 32]. The spec-
tral envelope of the other antialiasing oscillator algorithms
roll off faster than that of the textbook sawtooth, which
means that their spectra are already closer to the spectrum of
the Moog sawtooth oscillator prior to the filtering step (see
Figures 1 and 2).
Again, as with the PD model, the polynomial approxima-
tions of the filter parameters yield errors that are comparable
to the error obtained with the estimated parameter values,
as indicated in Figure 13 for the filtered fourth-order BLEP
oscillator. Similar observations were made for all tested
antialiasing oscillator algorithms. As can be seen in Figures
13(a), the polynomial approximation of the filter parameters
(solid line) has an RMSE that is at its maximum as bad as
that of the tabulated parameter estimates (crosses). At very
low fundamental frequencies, the polynomial approximation
results in a larger maximum absolute harmonic magnitude
error (see Figures 13(b)) than the estimated parameters, but
at hig her fundamental frequencies the difference between
these approaches is small. Therefore, accuracy-wise the
polynomial approximation provides as a good match as the
tabulated parameter estimates. Again, the use of a fixed filter,
that is, a filter whose parameters are independent from any
synthesis control data like f
0
, does not provide as good match
as the f
0
-dependent filters, as indicated in Figure 13 with
circles using the filter parameters estimated for f
0
= 524 Hz.
Of the tested oscillator algorithms, an excellent per-
formance is obtained with the third-order B-spline BLIT,
the fourth-order B-spline BLEP, and the fourth-order DPW
12 EURASIP Journal on Advances in Signal Processing
024681012
Time (ms)
−1
0
1
Level
(a)
−1
0
1
Time (ms)
Level
0 0.5 1
(b)
Time (ms)
024681012
−1
0
1
Level
(c)
−1
0
1
Time (ms)
Level
0 0.5 1
(d)
Time (ms)
024681012
−1
0
1
Level
(e)
−1
0
1
Time (ms)
Level
0 0.5 1
(f)
Time (ms)
024681012
−1
0
1
Level
(g)
−1
0
1
Time (ms)
Level
0 0.5 1
(h)
Time (ms)
024681012
−1
0
1
Level
(i)
−1
0
1
Time (ms)
Level
0 0.5 1
(j)
Figure 11: Waveforms of the filtered (a), (b) ideally bandlimited, (c), (d) third-order B-spline BLIT, (e), (f) third-order B-spline BLEP, (g),
(h) second-order DPW, and (i), (j) fourth-order DPW sawtooth oscillator output at fundamental frequencies o f 220.62 Hz and 2.096 kHz,
respective ly. The corresponding waveforms of the recorded signals are drawn with dashed line in all plots.
oscillators. Although these approaches have worse RMSE
than the phase distortion model (dash-dotted line in Fig-
ures 12(c) and 12(e)), their maximum absolute harmonic
magnitude errors are smaller than those of the phase distor-
tion model (dash-dotted line in Figures 12(d) and 12(f)). In
fact, their maximum absolute harmonic magnitude error is
below 3 dB at all tested fundamental frequencies.
In Figure 12, it can be seen that the post-equalising filter-
ing approach does match well to the analogue oscillator spec-
trum. Therefore, it can be concluded that the post-equalising
EURASIP Journal on Advances in Signal Processing 13
100 1000 8000
−50
−40
−30
−20
Fundamental frequency (Hz)
RMSE (dB)
(a)
100 1000 8000
Fundamental frequency (Hz)
0
2
4
6
8
Max error (dB)
(b)
100 1000 8000
−50
−40
−30
−20
Fundamental frequency (Hz)
RMSE (dB)
(c)
100 1000 8000
Fundamental frequency (Hz)
0
2
4
6
8
Max error (dB)
(d)
100 1000 8000
−50
−40
−30
−20
Fundamental frequency (Hz)
RMSE (dB)
(e)
100 1000 8000
Fundamental frequency (Hz)
0
2
4
6
8
Max error (dB)
(f)
Figure 12: Root mean squared error (RMSE) and the maximum absolute harmonic magnitude error of the filtered (a), (b) the ideally
bandlimited oscillator (solid line), (c), (d) the third-order B-spline BLIT (solid line) and the fourth-order B-spline BLEP (dashed line)
oscillator, and (e), (f) the second- (solid line) and fourth-order (dashed line) DPW oscillator outputs, respectively. The dash-dotted line in
all plots represents the corresponding error of the phase distortion model.
−
100 1000 8000
50
−40
−30
Fundamental frequency (Hz)
RMSE (dB)
(a)
100 1000 8000
Fundamental frequency (Hz)
0
1
2
3
Max error (dB)
(b)
Figure 13: (a) RMSE and (b) the maximum a bsolute harmonic magnitude error of the filtered fourth-order B-spline BLEP sawtooth
oscillator using the polynomial approximation of the filter parameters (solid line), the estimated parameters (crosses), and a fixed filter
that has the parameters estimated for the fundamental frequency of 524 Hz (circles).
14 EURASIP Journal on Advances in Signal Processing
filter approach is a valid model for the Moog sawtooth
oscillator and that the proposed low-order polynomials can
be used to compute the f
0
-dependent filter parameters for
the discussed algorithms. The best performance is obtained
with the fourth-order B-spline BLEP sawtooth oscillator that
has the smallest error measures in all tested fundamental
frequencies. Moreover, since the fourth-order B-spline BLEP
sawtooth oscillator has been demonstrated to be aliasing-free
up to almost 8 kHz [ 32], it can be considered to provide an
excellent model for the Moog sawtooth oscillator. However,
it should be noted that the f
0
-dependent filter parameters
result in a time-varying recursive filter that requires some
attention in its realisation.
4. Conclusions
Previously, discrete-time modelling of the source waveforms
used in subtractive sound synthesis has focused on reducing
aliasing occurring in the waveform synthesis. The target of
these oscillators has been the geometric textbook waveform,
and attempts to model the actual waveform generated by an
analogue oscillator have been neglected until recently. So far,
only two papers have dealt with discrete-time modelling of
an analogue oscillator. In this paper, two new discrete-time
models for the Moog sawtooth oscillator suitable for real-
time implementation were investigated.
The first approach was based on time-domain modelling
of the recorded analogue waveforms using phase distortion
synthesis. A simplified phase distortion function with two
linear segments was used, and parameter estimation for
the model was carried out. The parameter was noted to
be dependent on the fundamental frequency, and a linear
fit for the parameter estimates was computed. The model
parameter fit was tested, and it was found to produce a
faithful imitation of the recorded signals on a wide range
of fundamental frequencies with errors that occur mainly at
harmonics with very high frequency.
The second approach was based on frequency-domain
matching of an antialiasing oscillator spectrum to the
recorded analogue waveform spectrum using a post-
equalising filter. Five antialiasing oscillators were discussed
as the source material, and a first-order IIR filter was
considered as the equalising filter. For each oscillator
algorithm, filter parameters were estimated, and low-order
polynomial approximations of the parameters as a function
of the fundamental frequency were fitted. The polynomial
approximations were tested and the spectral errors between
the filter outputs and the recorded signal were computed. It
was found that the post-equalising filter provides an accurate
match between the antialiasing oscillator and the recorded
spectra, and that with a properly chosen source oscillator (the
fourth-order B-spline BLEP oscillator), t he spectral error can
be reduced to be almost negligible.
Considering all the models discussed in this paper, the
phase distortion model and the fourth-order B-spline BLEP
oscillator filtered with a first-order IIR post-equalising filter
provide the best match to the recorded analogue waveform.
Even though they do have a mismatch to the recorded
Table 4: Coefficients of the polynomial fits for the first-order post-
equalising filter parameters for (a) the third-order B-spline BLIT,
(b) the fourth-order BLEP, (c) the second-order DPW, and (d) the
fourth-order DPW sawtooth oscillator.
(a)
c
i
Filter parameter
i
g
b
1
a
1
0 0.6599 0.9741 0.9963
13.608
× 10
−5
−5.876 × 10
−4
−4.634 × 10
−4
20 5.279 × 10
−8
3.696 × 10
−8
(b)
c
i
Filter parameter
i
g
b
1
a
1
0 0.7105 1.0161 1.0294
13.380
× 10
−5
−5.850 × 10
−5
−4.8921 × 10
−5
20 5.220 × 10
−8
3.974 × 10
−8
(c)
c
i
Filter parameter
i
g
b
1
a
1
0 0.5727 0.5192 0.7027
14.230
× 10
−5
−3.650 × 10
−4
−2.806 × 10
−4
20 2.959 × 10
−8
1.741 × 10
−8
(d)
c
i
Filter parameter
i
g
b
1
a
1
0 0.6603 0.9736 0.9959
13.600
× 10
−5
−5.871 × 10
−4
−4.630 × 10
−4
20 5.272 × 10
−8
3.691 × 10
−8
reference signals at some fundamental frequencies, they do
provide almost bandlimited models of the Moog sawtooth
waveform. Aliasing is suppressed better using the BLEP
method than using the phase distortion model.
This work has demonstrated that the set of algorithms
for virtual analogue oscillators can be expanded further to
include specific oscillator types alongside the more generic
models. Sound examples of the reference oscillator and
the discussed techniques can be found online at
Acknowledgments
This work has been partly funded by the European Union
as part of the 7th Framework Programme (SAME Project,
ref. 215749) and by the Academy of Finland (Project no.
122815).
References
[1] H.F.OlsonandH.Belar,“Electronicmusicsynthesis,”Journal
of the Acoustical Society of America, vol. 27, no. 3, pp. 595–612,
1955.
EURASIP Journal on Advances in Signal Processing 15
[2] J. Lane, D. Hoory, E. Martinez, and P. Wang, “Modeling analog
synthesis with DSPs,” Computer Music Journal, vol. 21, no. 4,
pp. 23–41, 1997.
[3] R. A. Moog, “A voltage-controlled low-pass hig h-pass filter
for audio signal processing,” in Pr oceedings of the 17th Audio
Engineering Society Convention,NewYork,NY,USA,October
1965, preprint 413.
[4] T. Stilson and J. O. Smith, “Analyzing the Moog VCF with
considerations for digital implementation,” in Proceedings of
the International Computer Music Conference, pp. 398–401,
Hong Kong, China, August 1996.
[5] F. Fontana, “Preserving the structure of the Moog VCF in the
digital domain,” in Proceedings of the International Computer
Music Conference, pp. 291–294, Thessaloniki, Greece, Septem-
ber 1997.
[6] A. Huovilainen, “Non-linear digital implementation of the
Moog ladder filter,” in Proceedings of the 7th International
Conference on Digital A udio Effects (DAFx ’04), pp. 61–64,
Naples, Italy, September 2004.
[7] V. V
¨
alim
¨
aki and A. Huovilainen, “Oscillator and filter algo-
rithms for virtual analog synthesis,” Computer Music Journal,
vol. 30, no. 2, pp. 19–31, 2006.
[8] T. E. Stinchcombe, “Analysis of the Moog transistor ladder and
derivative filters,” 2008, />synth/Moog
ladder tf.pdf.
[9] T. H
´
elie, “On the use of Volterra series for real-time simula-
tions of weakly nonlinear analog audio devices: application to
the Moog ladder filter,” in Proceedings of the 9th International
Conference on Digital A udio Effects (DAFx ’06), pp. 7–12,
Montr
´
eal, Canada, September 2006.
[10] T. H
´
elie, “Volterra series and state transformation for r eal-
time simulations of audio circuits including saturations:
application to the Moog ladder filter,” IEEE Transactions on
Audio, Speech and Language Processing, vol. 18, no. 4, pp. 747–
759, 2010.
[11] M. Civolani and F. Fontana, “A nonlinear digital model of the
EMS VCS3 voltage-controlled filter,” in Proceedings of the 11th
International Conference on Digital Audio Effects (DAFx ’08),
pp. 35–42, Espoo, Finland, September 2008.
[12] F. Fontana and M. Civolani, “Modeling of the EMS VCS3
voltage-controlled filter as a nonlinear filter network,” IEEE
Transactions on Audio, Speech and Language Processing,vol.18,
no. 4, pp. 760–772, 2010.
[13] A. Huovilainen, Design of a scalable polyphony-MIDI syn-
thesizer, M.S. thesis, Aalto University S chool of Science
and Technology, Espoo, Finland, May 2010, .fi/
Dipl/2010/urn100219.pdf.
[14] V. V
¨
alim
¨
aki and A. Huovilainen, “Antialiasing oscillators in
subtractive synthesis,” IEEE Signal Processing Magazine,vol.
24, no. 2, pp. 116–125, 2007.
[15] J. Nam, V. V
¨
alim
¨
aki, J. S. Abel, and J. O. Smith, “Efficient
antialiasing oscillator algorithms using low-order fractional
delay filters,” IEEE Transactions on Audio, Speech, and Lan-
guage Processing, vol. 18, no. 4, pp. 773–785, 2010.
[16] V. V
¨
alim
¨
aki, J. Nam, J. O. Smith, and J. S. Abel, “Alias-
suppressed oscillators based on differentiated polynomial
waveforms,” IEEE Transactions on Audio, Speech and Language
Processing, vol. 18, no. 4, pp. 786–798, 2010.
[17] H. Chamberlin, Musical Applications of Microprocessors,chap-
ter 13, World Scientific, Hackensack, NJ, USA, 2nd edition,
1985.
[18] J. Kleimola, Design and implementation of a software sound
synthesizer, M.S. thesis, TKK Helsinki University of Tech-
nology, Espoo, Finland, 2005, .fi/
publications/files/theses/kleimola
mst/.
[19] J.Kleimola,V.Lazzarini,J.Timoney,andV.V
¨
alim
¨
aki, “Phase-
shaping oscillator algorithms for musical sound synthesis,” in
Proceedings of the 7th Sound and Music Computing Conference,
pp. 94–101, Barcelona, Spain, July 2010.
[20] Moog Music Inc., “Minimoog Voyager Old School User’s
Guide,” Asheville, NC, USA, 2008, />manuals/old
school manual 1 0.pdf.
[21] R. A. Moog, “Voltage-controlled electronic music modules,” in
Pr oceedings of the 16th Audio Engineering Society Convention,
New York, NY, USA, October 1964, preprint 346. Reprinted in
J ournal of Audio Engineering Society, vol. 13, no. 3, pp. 200–
206, 1965.
[22] G. De Sanctis and A. Sarti, “Virtual analog modeling in the
wave-digital domain,” IEEE Transactions on Audio, Speech and
Language Processing, vol. 18, no. 4, pp. 715–727, 2010.
[23] M. Ishibashi, “Electronic music instrument,” U.S. patent no.
4,658,691, 1987.
[24] J. Timoney, V. Lazzarini, J. Pekonen, and V. V
¨
alim
¨
aki, “Spec-
trally rich phase distortion s ound synthesis using an allpass
filter,” in Proceedings of the IEEE International Conference on
Acoustics, Speech, and Signal Processing (ICASSP ’09), pp. 293–
296, Taipei, Taiwan, April 2009.
[25]V.Lazzarini,J.Timoney,J.Pekonen,andV.V
¨
alim
¨
aki,
“Adaptive phase distortion synthesis,” in Proceedings of the 12th
International Conference on Digital Audio Effects (DAFx ’09),
pp. 28–35, Como, Italy, September 2009.
[26] V. Lazzarini and J. Timoney, “New perspectives on distortion
synthesis for virtual a nalog oscillators,” Computer Music
Journal, vol. 34, no. 1, pp. 28–40, 2010.
[27] E. Zwicker and H. Fastl, Psychoacoustics, Springer, Berlin,
Germany, 1990.
[28] A. Chaudhary, “Bandlimited simulation of analog synthesizer
modules by additive synthesis,” in Proceedings of the 105th
Audio Engineering Society Convention, San Francisco, Calif,
USA, October 1998, preprint 4779.
[29] P. Burk, “Band limited oscillators using wave table synthesis,”
in Audio Anecdotes II—Tools, Tips, and Techniques for Digital
Audio, K. Greenebaum and R. Barzel, Eds., pp. 37–53, A. K.
Peters, L td, Wellesley, Mass, USA, 2004.
[30] T. Stilson and J. O. Smith, “Alias-free digital synthesis of
classic analog waveforms,” in Proceedings of the International
Computer Music Conference, pp. 332–335, Hong Kong, China,
August 1996.
[31] E. Brandt, “Hard sync without aliasing,” in Proceedings of
the International Computer Music Conference, pp. 365–368,
Havana, Cuba, September 2001.
[32] V. V
¨
alim
¨
aki, J. Pekonen, and J. Nam, “Perceptually informed
synthesis of bandlimited classical waveforms using integrated
polynomial interpolation,” Journal of the Acoustical Society of
America, in press.
[33] A. B. Leary and C. T. Bright, “Bandlimited digital synthesis
of analog waveforms,” U.S. patent no. 7,589,272, September
2009.
[34] V. V
¨
alim
¨
aki, “Discrete-time synthesis of the sawtooth wave-
form with reduced aliasing,” IEEE Signal Processing Letters,vol.
12, no. 3, pp. 214–217, 2005.
[35] S. K. Mitra, DigitalSignalProcessing:AComputerBased
Approach,McGraw-Hill,NewYork,NY,USA,3rdedition,
2005.