Báo cáo hóa học: " Research Article Dynamic Modeling of Internet Traffic for Intrusion Detection" docx
Bạn đang xem bản rút gọn của tài liệu. Xem và tải ngay bản đầy đủ của tài liệu tại đây (2.33 MB, 14 trang )
Hindawi Publishing Corporation
EURASIP Journal on Advances in Signal Processing
Volume 2007, Article ID 90312, 14 pages
doi:10.1155/2007/90312
Research Article
Dynamic Modeling o f Internet Traffic for Intrusion Detection
Khushboo Shah,
1
Edmond Jonckheere,
2
and Stephan Bohacek
3
1
Nevis Networks Inc., Mountain View, CA 94043, USA
2
Department of Electrical Engineering, University of Southern California, Los Angeles, CA 90089, USA
3
Department of Electrical and Computer Engineering, University of Delaware, Newark, DE 19711, USA
Received 27 May 2005; Revised 15 February 2006; Accepted 18 May 2006
Recommended by Frank Ehlers
Computer network traffic is analyzed via mutual information techniques, implemented using linear and nonlinear canonical cor-
relation analyses, with the specific objective of detecting UDP flooding attacks. NS simulation of HTTP, FTP, and CBR traffic
shows that flooding attacks are accompanied by a change of mutual information, either at the link being flooded or at another
upstream or downstream link. This observation appears to b e topology independent, as the technique is demonstrated on the
so-called parking-lot topology, random 50-node topolog y, and 100-node transit-stub topology. This technique is also employed
to detect UDP flooding with low false alarm rate on a backbone link. These results indicate that a change in mutual information
provides a useful detection criterion when no other signature of the attack is available.
Copyright © 2007 Khushboo Shah et al. This is an open access article distributed under the Creative Commons Attribution
License, which permits unrestricted use, distribution, and reproduction in any medium, provided the original work is properly
cited.
1. INTRODUCTION
Attacks on the network have become commonplace and
with them intrusion detection systems (IDSs), firewalls, virus
scanning, and the like have become parts of an ever growing
arsenal of defense tools [1, 2]. If some knowledge of the na-
ture of the attack is available, it would be easily recognizable
by pattern recognition techniques. Hence, signature-based
IDS is p erhaps the most popular IDS technique [3, 4]. How-
ever, when a new attack strikes, no such signature is avail-
able, in which case the only hope is through anomaly detec-
tion [5], meaning detection of some deviation of the overall
system behavior from what is considered normal. Anomaly
detection can be host-based or network-based. Host-based
anomaly detection is at the end user level, while network-
based detection is at the level of network data. The present
paper is relevant to the latter, in the sense that it detects in-
trusion by analysis of the signals at some link.
Within network-based anomaly detection, most tech-
niques are count-based where the rate of occurrence (i.e., the
number of events in a time period) or the absolute value
of some count is monitored. A sufficiently large deviation
of the count from its nominal value is assumed to signify
an attack. Change-point detection schemes such as cumsum
[6] or exponentially weighted moving average may be used
to detect when the deviation of the count occurs [7]. For
example, TCP-SYN attacks are detected by monitoring the
arrival rate of TCP-SYN packets or the number of half-open
connections (see, e.g., [8]). Email worms can be detected by
monitoring the number of emails sent from a mail server and
by examining the number of emails sent to certain classes of
destinations [9]. The rate of DNS lookups [10]andARPre-
quests [11] are used to detect various types of worms. The
arrival rate of certain-sized UDP packets can be used to de-
tectwormssuchasCodeRed(see,e.g.,[12]).
The paper presents an alternative to count-based anom-
aly detection. More specifically, we investigate intrusion
detection that is based on a possibly subtle change relevant
to the dynamical structure of the signal. Arguably that single
parameter that best encodes this dynamical structure is
the order of the model of the observed time series. As
already noted in [13], this model order can be obtained
by either the Akaike information criterion (AIC) or the
minimum descr iption length (MDL) criterion. The former
is a Kullback-Leibler-based criterion, while the latter is a
Kolmogorov complexity-based criter ion [14]. A third avenue
of approach utilizes the Kullback-Leibler information in a
different way to produce the Akaike mutual information
(MI) between past and future of the time series; model
order selection is then viewed as a compromise between
simplicity of the model and its ability to carry most of the
mutual information; this is computationally implemented
2 EURASIP Journal on Advances in Signal Processing
Entropy
theoretic
approach
Complexity
theoretic
approach
Zvonkin-Levin theorem
Kullback-Leibler
information
Kolmogorov
complexity
Mutual
information
AIC (D)
= N log
(MSE(D)) + 2D
MDL (D) = N log
(MSE(D)) + D log N
Model order (D)
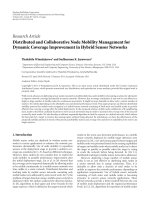
Figure 1: The various approaches to detect a change in the signal
structure. The path taken here is the left-most one. In the Akaike
information criterion (AIC) and the minimum description length
(MDL), the model order D is chosen so as to minimize AIC or MDL,
respectively, where MSE denotes the mean square error and N the
number of sample sets.
in stochastic balancing (see [15] and the references cited
therein). The interrelation among these three approaches
is depicted in Figure 1. The left-hand side of the diagram
refers to properties of the statistics, whereas the right-hand
side refers to properties of sequences. The deeper connec-
tion between the two approaches is formulated by the
Zvonkin-Levin theorem [16], [17,Theorem1],[18,page
227]: for a stationary ergodic source emitting symbols
y(k) over a finite alphabet, lim
n→∞
(K(y(1), , y(n))/n) =
lim
n→∞
(H(y(1), , y(n))/n), where K(y(1), , y(n))
is the complexity of the sequence y(1), , y(n)and
H(y(1), , y(n)) is the entropy of the probability distri-
bution of y(1), , y(n). The other connection between
complexity and mutual information, marked as a dotted
line in Figure 1, is more specific to intrusion detection and
expanded upon in the next section.
The specific path taken in this paper is the extreme left of
the diagram of Figure 1, except that we stop short of detect-
ing a change in model order, but rather endeavor to detect a
change in mutual information.
1.1. Mutual information versus
Kolmogorov complexity
Since the MI and Kolmogorov complexity both endeavor to
find model order, the two approaches ought to be somehow
related. To understand the similarities/discrepancies, some
more formal concepts are already in order.
The mutual information between the past y
−
and the
future y
+
is the amount by which the Shannon entropy of
the future decreases when we are given the past, that is,
H(y
+
) − H(y
+
| y
−
). Practically, the past/future MI is re-
lated to the (properly weighted) mean square error between
the data and the optimal predictor model. In the Gaussian
case, the modeling is traditionally done by the classical inno-
vations representation [19], while, in the non-Gaussian case,
the modeling could be done by such well-known statistical
modeling techniques as the alternating conditional expecta-
tion (ACE) [20].
TheKolmogorovcomplexityK(y)ofastring y is the
length of the shortest composite string
T : u such that if
the string u is the input tape to the Turing machine T it pro-
duces y on the output tape and then stops [21, Definition
6.20], [14, 16].
Information-based and complexity-based intrusion
detections can be related by the sometimes loosely stated
fact that high complexity means low information. Precisely,
Kolmogorov proved that the most complex binary sequences
are those that approach random coin tosses [18, page 227],
[21, page 218], which have vanishing mutual information.
To generalize the latter to arbitrary shift dynamics T : Ω
→ Ω
with invariant measure μ, it is convenient to use Markov par-
titioning Ω
=
i
A
i
, so as to reduce the problem to symbolic
dynamics. However, even after this conversion, the connec-
tion between complexity and mutual information does not
appear to hold without the crucial φ-mixing condition, that
is,
|(μ(A
i
T
−k−n
A
j
))/(μ(A
i
)μ(A
j
)) − 1|≤φ(k)forsome
decaying function φ(k), and uniformly for all n.Forexample,
consider the automorphism of the torus y(k +1)
= Fy(k)
mod 1
=: Ty(k), where F ∈ Z
2×2
and det F =±1, in which
case the entropy is relative to the Lebesgue measure μ [22].
This entropy is well known to be h(y
+
) = log(|λ(F)|
max
)and
the decay rate of the correlation is given by φ(k)
∼|λ(F)|
−k
max
[23]. By the Zvonkin-Levin theorem, the Kolmogorov
complexity rate is given by log(
|λ(F)|
max
). As the complexity
increases, the correlation decreases faster; hence so does
i, j
μ(A
i
T
−k
A
j
)log((μ(A
i
T
−k
A
j
))/(μ(A
i
)μ(T
−k
A
j
)))
as k
→∞, and from there on it can be shown [24] that the
past/future mutual information
i
k
, j
l
μ((
l≥0
T
l
A
j
l
)
(
k≥0
T
−k
A
i
k
))log((μ((
l≥0
T
l
A
j
l
)
(
k≥0
T
−k
A
i
k
)))/(μ(
l≥0
T
l
A
j
l
)
μ(
k≥0
T
−k
A
i
k
))) decreases.
1.2. Fundamental concepts
A key assumption of the techniques investigated here is that
some network attacks change the structure of the traffic. In
an effort to understand self-similarity, several aspects of the
structure of network traffic have been extensively investi-
gated. It has been widely reported that various aspects of the
network and traffic impact the structure. For example, the
autocorrelation, more specifically, the rate of decay of the
autocorrelation, has been widely used to study traffic[25].
This rate of decay is related to the Hurst parameter and is
known to be related to the application layer parameters such
as file size distribution [26]. In [27], a wavelet-based anal-
ysis of traffic revealed a cascade structure that is dependent
on transport and application protocols as well as user behav-
ior such as mouse clicks and session duration. While much
of this previous work focuses on long time scales, in [28],
the short-time scale behavior of the “packet pattern” was
studied and it was found that this pattern depends on cer-
tain network parameters such as loss rate. Here, the mutual
information is used, but instead of examining the variation
over different time scales to u nderstand self-similarity or
Khushboo Shah et al. 3
scaling, the temporal variation is used to understand the type
of traffic, specifically, to determine whether an attack is oc-
curring.
The premise of the information theoretic approach to in-
trusion detection is that any kind of intrusion would disturb
the dynamical structure, and hence the infor mation struc-
ture, which the signal inherits from the interaction of TCP
with the malicious flow. For example, in case of constant
bit-rate (CBR) UDP flooding, packet arrival rates may be-
come more stable than those that occur under typical TCP
file transfers. In this case, the signal becomes more determin-
istic, hence more predictable; that is, CBR flood results in
the past packet arrival rate holding more information about
the future packet arrival rate. Next to CBR flooding, there
are other attacks that would rather decrease the information,
making the signal less predictable. It appears therefore that
the traffic has to be monitored for a change in information,
which should trigger the alarm. On the other hand, while
flooding-based attacks may impact the mutual information,
traffic anomalies that do not impact the dynamic structure
would not cause a change in the mutual information. Other
techniques are required to detect such attacks.
From a broader perspective, since as shown in the preced-
ing section, the connection between rate of decay of correla-
tion and mutual information does not appear to hold with-
out a stronger version of mixing, it is believed that mutual
information adds, next to rate of decay of correlation, a new
dimension to traffic analysis.
1.3. Practical Implementation
Numerically, the mutual information between the past and
the future of the traffic signal, or any process for that mat-
ter, is computed via canonical correlation analysis (CCA) be-
tween the past and the future of the process [15, 19]. In case
of a Gaussian process, the linear CCA is adequate in the sense
that the mutual information can easily be computed from the
linear canonical correlation coefficients (CCCs). If the traffic
signal is non-Gaussian, the linear CCCs underestimate the
mutual information. However, after a nonlinear preprocess-
ing, the resulting nonlinear CCCs would yield an estimate
that approaches the mutual information as closely as possi-
ble, depending on the amount of nonlinear processing that is
consistent with online intrusion detection.
Several signals (e.g., link utilization, packet arrival, and
queue length) are candidates for mutual information analy-
sis by canonical correlation. However, our experiments have
shown that the change in mutual information concurrent
with an attack is more sizable if the average utilization over a
sample period is analyzed. Since the number of arrivals dur-
ing a sample period and the average utilization during a sam-
ple period differ only by a scaling factor, the mutual informa-
tion of the utilization is the same as the mutual information
of the number of packet arrivals.
In Section 4 , three topologies are analyzed: parking-lot
topology, random 50-node topology, and 100-node transit-stub
topology. We do not consider a widely used single-bottleneck
dumbbell topology in this paper, as it was shown in [13] that
intrusion detection on the dumbbell topology is straightfor-
ward. The random 50-node and the 100-node transit-stub
topologies are generated by Georgia Tech’s topology gener-
ator (Gt-Itm). We use the network simulator (NS) [29]to
integrate these topologies and to generate traffic. For each
topology, our study is 2-fold: linear versus nonlinear canon-
ical correlation analysis, for varying sampling periods (rang-
ing from 0.1 to 20 s). Furthermore, in Section 6, this mutual
information-based detection scheme is applied to backbone
network traces.
While the simulation and experiment results are promis-
ing in that they indicate that the traffic anomalies result in
a significant change in the mutual information, the results
should not be taken as definitive proof of the deployability
of mutual information-based detection mechanisms. Rather,
the intent of this paper is to illustrate the potential utility of
signal processing techniques such as mutual information for
the detection of network traffic anomalies. A comprehensive
examination of the performance in terms of false positives
and false nega tives over the very wide range of types of traffic
found in the Internet is currently under investigation.
1.4. Outline
An outline of the paper follows. Section 2 gives a brief
overview of the related work in this area. Section 3 deals
with the linear and nonlinear canonical correlation analyses,
the mutual information, and the resulting models. Section 4
presents the simulation setup. In Section 5 the simulation re-
sults are analyzed.
2. RELATED WORK
Today, there are generally two types of intrusion detection
systems (IDS): misuse detection and anomaly detection. Mis-
use detection techniques attempt to model attacks on a sys-
tem as specific patterns, then systematically scan the system
for occurrences of these patterns [3, 4]. Anomaly detection
approaches attempt to detect intrusions by noting significant
departures from normal behavior [13, 30–34]. Our approach
falls under network-based anomaly detection as we detect in-
trusion by analysis of traffic signals.
Many techniques have been proposed for anomaly de-
tection. Several of them analyze different data streams, such
as data mining for network traffic[35], statistical analysis
for audit record [32], sequence analysis for operating system
calls [36], information retrieval [37], and inductive learn-
ing [38]. Statistical methods have also been developed for
network anomaly detection [5, 39]. Change point detection
technique has been used for detection of various flooding at-
tacks [40, 41].
Signal processing techniques, the focus of our work, have
been used previously to analyze malicious network traffic
and to detect ongoing attacks. In [42], the authors have used
wavelet coefficients across resolution levels to locate smooth
and abrupt changes in variance and frequency in the given
time series. Reference [43] has proposed a statistical sig-
nal processing technique based on abrupt change detection.
4 EURASIP Journal on Advances in Signal Processing
Reference [44] has used flow-level information to identify
frequency characteristics of anomalous network traffic. Ref-
erences [45, 46] have developed spectral analysis-based ap-
proach to detect DoS attack. Further, wavelets and other sig-
nal processing techniques have been extensively used to an-
alyze both wired and wireless network traffic[47, 48]. Per-
haps the most relevant approach along the lines of our work
is Kolmogorov complexity approach to intrusion detection
described in [49]. The fundamental difference between our
work and this work is highlighted in the introduction.
3. CANONICAL CORRELATION ANALYSIS
Here
{y(k) ∈ [−b,+b]:k = , −1, 0, +1, } is the cen-
tered link utilization signal (i.e., the total number of bytes
that arrived during the sample period divided by the max-
imum possible number of bytes that could arrive during
the sample period). y
k
is bounded by the bandwidth and
is viewed as weakly stationary process with finite covari-
ance E(y(i)y( j))
= Λ
i− j
defined over the probability space
(Ω, A, μ). As such, there is no need to take infinite variance
processes (e.g., α-stable, H-self-similar processes [50]) into
consideration. The past and the future of the process are de-
fined, respectively, as
y
−
[L] =
y(k), y(k − 1), , y(k − L +1)
T
,
y
+
[L] =
y(k +1), , y(k + L)
T
,
(1)
where L is the “lag.” We will drop the notation [L]when-
ever the size of the past or the future is irrelevant. The mu-
tual information between the past and the future [19, 51–53]
is the amount of information we acquire about the future
when we are given the past. Since, technically, the ent ropy of
a continuous-valued process does not exist, the mutual in-
formation is most easily defined in terms of past-measurable
partitions A and future-measurable partitions B of the sam-
ple space Ω,
I
y
−
, y
+
= sup
A,B
H(A) − H(A | B)
=
sup
A,B
i
j
log
μ
A
i
∩ B
j
μ
A
i
μ
B
j
μ
A
i
∩ B
j
=
log
p
y
−
, y
+
p
y
−
p
y
+
p
y
−
, y
+
dy
−
dy
+
.
(2)
In the above, H(A) is the entropy of the partitioning A
and H(A
| B) is the conditional entropy of the partition-
ing A given the partitioning B. The last equality in the
above is valid only under absolute continuity conditions,
in which case p(y
−
, y
+
) is the Radon-Nikodym derivative,
μ(dy
−
, dy
+
)/dy
−
dy
+
and p(y
−
), p(y
+
) are the marginal den-
sities. As such, I(y
−
, y
+
) is the Kullback-Leibler “distance”
between p(y
−
, y
+
)andp(y
−
)p(y
+
). In this setup, it could
be argued that, because y(k) is a packet count under band-
width limitation, it takes only finitely many values, so that
the mutual information can still be defined as I(y
−
, y
+
) =
H(y
+
) − H(y
+
| y
−
), where H(y
+
) is the entropy of the fu-
ture and H(y
+
| y
−
) is the conditional entropy of the future
given the past.
3.1. Linear canonical correlation
The linear canonical correlation analysis (CCA) is a second
moment technique for computing the mutual information
under the standard Gaussian assumption. Since the process
y(k) is bounded, the Gauss property is only an approxima-
tion of the true distribution.
Factor the covariances of the past and the future as
E
y
−
(k)y
T
−
(k)
=
L
−
L
T
−
,
E
y
+
(k)y
T
+
(k)
=
L
+
L
T
+
(3)
and then construct the canonical correlation matrix Γ along
with its singular value decomposition (SVD),
Γ
y
−
, y
+
:= L
−1
−
E
y
−
(k)y
T
+
(k)
L
−T
+
= U
T
ΣV,(4)
where U and V are orthogonal matrices and
Σ
=
⎛
⎜
⎜
⎜
⎝
σ
1
0
.
.
.
.
.
.
.
.
.
0
··· σ
L
⎞
⎟
⎟
⎟
⎠
,1 σ
1
··· σ
L
0. (5)
The σ’s are called canonical correlation coefficients (CCCs).
Since they are all bounded by 1, it follows that, even as L
→
∞
, the canonical correlation operator is bounded as Γ≤
1, where ·denotes the spectral norm. If the process is
Gaussian, it is well known that
−
1
2
log det
I − Γ
T
y
−
, y
+
Γ
y
−
, y
+
=
I
y
−
, y
+
.
(6)
The fact that Γ is a bounded operator does not imply that
I(y
−
, y
+
)isboundedasL →∞,becauseσ
i
≤ 1doesnot
imply that
−(1/2) log Π
∞
i=1
(1 − σ
2
i
) exists. We will come back
to this point at the end of the next subsection.
In general, with a noisy, finite length L data record, the se-
quence of CCCs still shows a fairly clear cutoff.Practically,in
all cases, a break point σ
D
σ
D+1
is identified and a reduced
model of order D is obtained after resetting the L
− D tail co-
efficients to 0. The latter is formalized in stochastic balancing
and Hankel norm reduction [15].
A few numerical remarks
It is customary to define L
±
to be lower triangular (Cholesky
factorization), although L
±
could be defined upper triangu-
lar (“anti-Cholesky” factorization), in which case Γ is near-
Hankel and in fact, for L
=∞,itwillbetheHankelop-
erator associated with the phase of the spectral factor of y
Khushboo Shah et al. 5
[15]. The particular way the factorization is done does not
affect the CCCs. E(y
±
(k)y
T
±
(k)) might be marginally positive
definite, resulting in problems with the Cholesky factoriza-
tion; there is thus a need to monitor the condition number
of E(y
±
(k)y
T
±
(k)). If the covariance matrix is poorly condi-
tioned, a generalized eigenvalue approach to compute the σ’s
should be used.
3.2. Nonlinear canonical correlation
If the process y is not Gaussian, (6) is no longer valid. This
motivates the nonlinear canonical correlation [51, 53, 54]as
a modified technique to reach the mutual information in the
non-Gaussian setup; precisely, we have the following.
Theorem 1. Let
{y(k) ∈ [−b,+b]:k = , −1, 0, +1, }
be a bounded valued weakly stationary process defined over the
probability space (Ω, A, μ). Let I(y
−
, y
+
) be the mutual infor-
mation between the past and the future and let Γ(
·, ·) denote
the canonical correlation. The n
sup
f ,g
−
1
2
log det
I − Γ
T
f
y
−
, g
y
+
Γ
f
y
−
, g
y
+
≤
I
y
−
, y
+
,
(7)
where f , g :[
−b,+b]
L
→ R
L
are functions such that f ◦
y
−
, g ◦ y
+
∈ L
2
(Ω, A, μ), E( f (y
−
)) = E(g(y
+
)) = 0,
and for convenience normalized as E( f
T
(y
−
) f (y
−
)) = 1,
E(g
T
(y
+
)g(y
+
)) = 1. Furthermore, equality is achieved if and
only if f (y
−
) and g(y
+
) can be made jointly Gaussian, in which
case the joint past/future process is called diagonally equivalent
to Gaussian.
Proof. See [51, 53].
To motivate the left-hand side optimization in a practi-
cal estimation setup, consider a linear regression of g(y
+
)on
f (y
−
). It is easily found that
min
A
E
g
y
+
− Af
y
−
T
L
+
L
T
+
−1
g
y
+
− Af
y
−
=
L − Trace
Γ
T
f
y
−
, g
y
+
Γ
f
y
−
, g
y
+
.
(8)
Clearly, the best choice of f and g is the one that maximizes
Trace(Γ
T
( f (y
−
), g(y
+
))Γ( f (y
−
), g(y
+
)))anditisreadilyseen
that this is achieved for the same distortion functions f and
g. This latter technique calls for the maximization of the trace
of Γ
T
( f (y
−
), g(y
+
))Γ( f (y
−
), g(y
+
)), as was done in the ap-
proach of Larimore and Baillieul (see [54]), rather than the
maximization of the mutual information, as done by Jonck-
heere and Wu (see [51, 53]). Not surprisingly, by how much
Trace(Γ
T
( f (y
−
), g(y
+
))Γ( f (y
−
), g(y
+
))) can be increased by
means of nonlinear distortion should be bounded by the mu-
tual information; in fact, the following is true.
Theorem 2. Under the same assumptions as in Theorem 1,
max
f ,g
Trace
Γ
T
f
y
−
, g
y
+
Γ
f
y
−
, g
y
+
≤
2I
y
−
, y
+
(9)
and furthermore equality holds if and only if the processes y
−
and y
+
are independent.
Proof. See [51, 53].
Using the above, it follows that
MSE
:
= lim
L→∞
1
L
L − sup
f ,g
Trace
Γ
T
f
y
−
, g
y
+
Γ
f
y
−
,
g
y
+
≥
1 − 2lim
L→∞
I
y
−
, y
+
L
.
(10)
We defi ne ι(y
−
, y
+
):= lim
L→∞
(I(y
−
, y
+
)/L) to be the mutual
information rate.Incaseι<1/2, the mutual information rate
is too weak and will result in a nonvanishing MSE. It can be
shown that if the system is φ-mixing, the mutual information
rate vanishes [24], so that MSE
≥ 1.
Invoking the finite variance property, we construct
Hilbert space bases for the subspaces of L
2
(Ω, A, μ)ofpast
and future measurable functions Ω
→ R. The distortion
functions f and g will be expressed as linear combinations of
those basis functions, leading to yet another computational
implementation of the nonlinear CCA in addition to the se-
quential selection of Larimore and Bal l ieul (see [54]) and the
integral equation approach of [51, 53]. In case of finite lag L,
since y(k)isdefinedoveracompactset[
−b,+b], by a well-
known theorem, any function of y
−
, y
+
can be uniformly
approximated by polynomials; hence we choose polynomi-
als p
j
(y
−
), q
j
(y
+
), j = 1, 2, such that E
−
p
j
= E
+
q
j
= 0,
and forming bases of the Lebesgue spaces of zero-mean past-
measurable, future-measurable functions, respectively. Since
f
i
y
−
=
lim
N→∞
N
j=1
φ
ij
p
j
y
−
,
g
i
y
+
=
lim
N→∞
N
j=1
γ
ij
q
j
y
+
(11)
for least squares fitting coefficients φ
ij
and γ
ij
, the nonlinear
CCA therefore reduces to
sup
φ,γ
−
1
2
log det
I −Γ
φp
y
−
, γq
y
+
Γ
T
φp
y
−
, γq
y
+
,
(12)
where φ and γ are the arrays made up with the coefficients φ
ij
and γ
ij
. The solutions φ and γ are far from unique even under
the normalization condition on f and g, because there is still
the freedom to premultiply φ and γ by orthogonal transfor-
mations. If L<
∞, the above supremum is nontrivial and is
6 EURASIP Journal on Advances in Signal Processing
easily accomplished via linear CCA of p(y
−
)andq(y
+
), that
is, via SVD of Γ(p(y
−
), q(y
+
)). Specifical ly, do the factoriza-
tions
E
p
y
−
p
y
−
T
=
L
−
L
T
−
,
e
q
y
+
q
y
+
T
=
L
+
L
T
+
(13)
along with the SVD
Γ
p
y
−
, q
y
+
=
u
1
U
2
T
Σ
1
0
0 Σ
2
V
1
V
2
, I ≥Σ
1
Σ
2
≥0.
(14)
The coefficients of the optimal distortion functions are given
by
φ
= U
1
L
−1
−
, γ = V
1
L
−1
+
. (15)
Even when L<
∞, the Hilbert space basis will still be
infinite-dimensional, so that the arrays φ and γ will be “fat.”
In this case, we have
sup
φ,γ
−
1
2
log det
I −Γ
φp
y
−
, γq
y
+
Γ
T
φp
y
−
, γq
y
+
≤−
1
2
log det
I −Γ
p
y
−
, q
y
+
Γ
T
p
y
−
, q
y
+
.
(16)
In other words, the CCA of the Hilbert space basis (the right-
hand side) provides a bound on what the nonlinear CCA can
achieve (the left-hand side).
A feature that is already present in the linear CCA of
traffic signals, but that becomes much more pronounced
in the nonlinear CCA, is that the head of the CCC se-
quence, σ
1
, σ
2
, σ
3
, , σ
D
, remains close to one before drop-
ping abruptly near zero. This phenomenon is, to our knowl-
edge, unique to traffic sig nals and points to some determin-
istic features in the dynamics.
Numerical remark
Practically , p and q are chosen as simple monomials or
Chebyshev polynomials in the components of the past and
the future. It is important to scale the large powers appear-
ing in p(y
−
)andq(y
+
), for otherwise the high power terms
become dominant over the low power terms.
4. SIMULATION SETUP
We used the network simulator (NS) developed by LBNL
to set up our simulation environment [29]. NS is a discrete
event simulator widely accepted for networking research. It
provides a substantial support for simulation of TCP, rout-
ing, and multicast protocols over wired and wireless (local
and satellite) networks. Moreover, NS generates constant bit
rate (CBR), TELNET, FTP, HTTP, and so forth traffic. The
simulator also has a small collection of mathematical func-
tions that can be used to implement exponential, uniform,
Pareto, and so forth random variables. We used this capabil-
ity to set up the network environment that synthesized HTTP
and CBR traffic.
A dynamical model for normal TCP traffic was synthe-
sized from the signals obtained by sending HTTP trafficfrom
the sources to the destinations at random times. For HTTP
traffic, the file size distribution was modeled as a general
ON/OFF behavior with a combination of heavy-tailed and
light-tailed sojourn times, while the interpage time and the
interobject per page time distributions were set to be expo-
nential. The page size was set to be constant and the ob-
jectperpagesizetobeParetotoreplicatetoday’snetwork
bursty traffic[55, 56]. In summary, HTTP trafficcanbe
parametr ized by the following parameters in NS: number of
sessions, intersession time, session size, interpage time, page
size, interobject time, average object size, and shape parame-
ter of objec t size (exponent (α) in Pareto distribution).
In addition to this background (HTTP) traffic, a large
number of small size CBR packets were sent over some UDP
connections from the attack scenario model [57]. CBR traffic
can be parameterized by packet size and interval.
We ran several trials to cover a wide range of param-
eters for each topological setting. Each run was executed
for 30 000 simulated seconds, logging the traffic at the 0.01-
second granularity.
5. RESULTS AND INTERPRETATION
In this section, we show how the mutual information
changes under CBR attack. Three topologies are considered:
parking-lot topology, 50-node random topology, and 100-
node transit-stub topology. For parking-lot topology, we car-
ried out two experiments. The first experiment gives an idea
of how the mutual information is affected under the attack,
while the second experiment shows how the attack can be
detected at a link different than the attacked link. In a more
complicated setting, we consider 50-node random topology.
Moreover, to see if the mutual information is a u seful tool in
detection of infrastructure attacks, such as flooding a bottle-
neck link, we use 100-node transit-stub topology.
5.1. Parking-lot topology
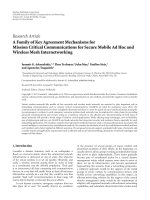
Figure 2 shows the “parking-lot” topology. The nodes S
i
(i =
8, 10, 12) are sources and the nodes D
i
(i = 9, 11, 13) are des-
tinations. The sources send traffic to their downstream des-
tinations. In addition to this background (HTTP) traffic, a
large number of CBR packets are sent over several UDP con-
nections from source nodes to the victim node to model the
attack scenario [57]. Specifically, source nodes 8 and 10 each
sends 15 CBR flows to the victim node 4. The intensity of
Khushboo Shah et al. 7
0
1
2
3
4
5
6
7
8
10
12
9
11
13
Normal traffic
UDP flooding
attack
Node
under
attack
Figure 2: Parking-lot topology. Normal trafficisanHTTPtraffic,
while UDP packet storm attack is simulated by sending CBR traffic
downstream from the sources 8 and 10 to the vicitm 4.
Table 1: CBR traffic parameters for parking-lot topology.
Trial
CBR traffic
Packet size Interval (sec)
1 250 0.06
2
300 0.07
3
350 0.08
4
400 0.09
5
450 0.1
CBR and HTTP trafficisvariedineachtrial.Here,weshow
the results for 5 trials. The parameters of CBR and HTTP
traffic for each trial are shown in Tables 1 and 2. Here the link
speed is 10 Mbps and the latency of the each link is 20 ms.
Experiment 1 (HTTP traffic under CBR attack, monitored
link the same as the flooded link, linear versus nonlinear
analysis). In this experiment, the impact of intensity of traf-
fic on the ability to detect an attack is explored. Here, the
background traffic is HTTP and the attack trafficisCBR.
Intensity of HTTP traffic can be varied by changing such
parameters as number of sessions, number of pages, num-
ber of objects, and so forth in NS (Tab le 2 ). The intensity
of CBR traffic is also varied (Ta ble 1). The link under attack
is 3-4 and the monitored link for the detection is also 3-4
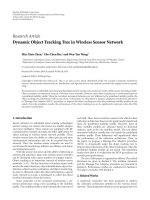
in Figure 2. The upper frames of Figure 3 show the linear
mutual information for different sample intervals for nor-
mal and attack traffic. Note that the mutual information is
derived from the average link utilization over the sample pe-
riod (i.e., the number of bytes that arrived during the sample
period divided by the maximum possible number of bytes
that could arr ive during the sample period). Note that the
mutual information for the normal tr affic remains the same
for different trials. The justification of the latter is that the
mutual infor mation is unchanged under scaling; it only de-
pends on the dynamics, which in this case remains that of
HTTP traffic. From trial 1 to trial 5, the intensity of HTTP
traffic increases while the intensity of CBR trafficdecreases.
As the relative intensity of CBR traffic increases, the traffic
becomes more predictable. This can be seen as the increase
in the mutual information in the attack traffic. Observe that
for trial 1, the increase in the mutual information under at-
tack is small; the justification is the small amount of CBR
traffic. Another experiment was performed in which the in-
tensity of CBR traffic was kept constant. This experiment also
showed a clear increase in mutual information under signif-
icantamountofCBRtraffic.
The lower frames of Figure 3 show the nonlinear mutual
information for normal and attack traffic. Observe that for
normal traffic the nonlinear mutual information is higher
than the linear mutual information. Since TCP has compli-
cated dynamics, higher correlation and hence higher mu-
tual information are achieved by nonlinear distortion of the
past and the future. This also holds true for the attack traf-
fic. However, for this setup, the relative increase in linear and
nonlinear mutual information remains almost the same.
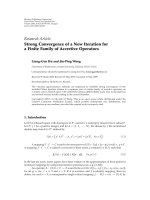
Experiment 2 (monitored link downstream of the flooded
link). In this experiment, the flooded link is still 3-4, but the
link utilization is monitored along link 4-5. The simulation
set-up is the same as that of Experiment 1. The linear mutual
information is computed for the link utilization 4-5. Figure 4
shows significant increase in the linear mutual information
for the attack traffic as compared to the normal traffic. In
conclusion, the mutual information can pick up the differ-
ence in the statistical structure of the signal, even when the
signal is not recorded on the flooded link. This diff
ers from
count-based schemes that typically focus on observing the
attack directly.
5.2. Random 50-node topology
In the more complicated “50-node” random topology
(Figure 5) generated by Georgia Tech’s topology generator
(Gt-Itm), 20 nodes are set as the sources and 20 nodes are
set as the destinations. The maximum link speed is 1.5 Mbps
while the minimum link speed is 10 Mbps. The propagation
delay varies between 20 to 120 ms. HTTP requests are sent a t
random times from random clients to random servers. All
the sources send 5 CBR flows to the target node 14 dur-
ing the attack. The CBR and HTTP traffic parameters for
various trials for this set-up are listed in Tables 3 and 4.
8 EURASIP Journal on Advances in Signal Processing
Table 2: HTTP t raffic parameters for parking-lot topology.
Trial
HTTP traffic
Number of Intersession
Session size
Interpage
Page size
Interobject Average object Object size
sessions time (s) time (s) time (s) size shape parameter
1 2500 2.5 1000 75 5 0.05 60 1.1
2
3000 3 1200 90 6 0.06 72 1.2
3
3500 3.5 1400 105 7 0.07 84 1.3
4
4000 4 1600 120 8 0.08 96 1.4
5
4500 4.5 1800 135 9 0.09 108 1.5
00.10.20.30.40.5
1
2
3
4
5
Sampling period
Tri a l 1
Tri a l 2
Tri a l 3
Tri a l 4
Tri a l 5
Mutual information
Linear mutual information: normal data
(a)
00.10.20.30.40.5
0
4
8
12
16
Sampling period
Tri a l 1
Tri a l 2
Tri a l 3
Tri a l 4
Tri a l 5
Mutual information
Linear mutual information: attack data
(b)
00.10.20.30.40.5
2
3
4
5
6
7
8
9
Sampling period
Tri a l 1
Tri a l 2
Tri a l 3
Tri a l 4
Tri a l 5
Mutual information
Nonlinear mutual information: normal data
(c)
00.10.20.30.40.5
0
5
10
15
20
25
Sampling period
Tri a l 1
Tri a l 2
Tri a l 3
Tri a l 4
Tri a l 5
Mutual information
Nonlinear mutual information: attack data
(d)
Figure 3: Mutual information versus sample period for parking-lot topology. The upper frames show the linear mutual information while
the lower frames show nonlinear mutual information. The left-hand side plots are for normal traffic while the right-hand side plots are for
attack traffic.
Each trial was executed for 30 000 simulated seconds, logging
the traffic at 0.01-second granularity. The monitored link is
14–30.
Figure 6 shows the linear and nonlinear mutual informa-
tion for the monitored link. The results are consistent with
the results obtained for the parking-lot topology, meaning
that the mutual information increases in case of an attack.
Furthermore, the increase in the mutual information under
attack is much more sizable for this topology as compared
with the elementary baseline topology.
Khushboo Shah et al. 9
00.10.20.30.40.5
0
5
10
15
20
25
Sampling period
Tri a l
= 1
Tri a l
= 2
Tri a l
= 3
Tri a l
= 4
Tri a l
= 5
Mutual information
Linear mutual information: normal data
(a)
00.10.20.30.40.5
0
5
10
15
20
25
Sampling period
Tri a l
= 1
Tri a l
= 2
Tri a l
= 3
Tri a l
= 4
Tri a l
= 5
Mutual information
Linear mutual information: attack data
(b)
Figure 4: Linear mutual information versus sample period for parking-lot topology. The flooded link is 3-4 while the monitored link is 4-5.
Observe the difference between the mutual information.
HTTP sources
Attack
destination
Link
monitored
Figure 5: 50-node random topology. The target node 14 and the
monitored link is 14–30.
Table 3: CBR traffic parameters for random 50-node and 100-node
transit-stub topologies.
Trial
CBR traffic
Packet size Interval (s)
1 25 0.11
2
50 0.12
3
75 0.13
4
100 0.14
5
125 0.15
5.3. 100-node transit-stub topology
CERT has noted that DoS attacks on links and routers are in-
creasing [58]. A coordinated attack can be planted by many
end hosts that all send packets that will eventually t raverse
the same link thereby hogging all link bandwidth. In the
present experiment, we explore the possibility of detecting
such an attack. A 100-node transit-stub topology is generated
by Georgia Tech’s topology generator (Gt-Itm). As shown in
Figure 7, there is only one HTTP server and 20 HTTP clients.
There are 13 attack sources a nd 13 attack destinations. Each
attack source sends 20 CBR flows to every attack destination.
All the attack sources use bottleneck link 2–0 to send t raffic.
The focus here is the HTTP client that uses the link 0–2 to
send HTTP requests and the link 2–0 to receive the HTTP
server response. We ran 5 different trials by varying CBR and
HTTP traffic par ameters (see Tables 3 and 4). Each trial was
executed for 30 000 simulated seconds, logging the trafficat
0.01-second granularity. The monitored link is 2–0.
Figure 8 shows the time series of link utilization of var-
ious links. The left frame in Figure 8 shows the link utiliza-
tion for the upstream server link, the center frame shows the
link utilization for the bottleneck link, and the right frame
shows the link utilization for the upstream client link. It can
be seen that, during the attack, the client of interest has zero-
link utilization, meaning the client completely stops getting
HTTP data packets since almost all the bandwidth of the link
2–0 is used by the attack traffic. On the other hand, there is
no visible difference in the link utilization of upstream server
link nor in the link utilization of the bottleneck link after the
attack.
To detect this attack, we use the nonlinear mutual in-
formation computed for the link utilization observed on the
bottleneck link 2–0. Figure 9 shows the mutual information
plots for this experiment for different trials. It can be seen
that there is a significant change in the mutual information,
10 EURASIP Journal on Advances in Signal Processing
Table 4: HTTP t raffic parameters for random 50-node and 100-node transit-stub topologies.
Trial HTTP traffic
Number of Intersession
Session size
Interpage
Page size
Interobject Average object Object size
sessions time (s) time (s) time (s) size shape parameter
1 400 1 200 15 1 0.01 12 1.1
2
800 2 400 30 2 0.02 24 1.2
3
1200 3 600 45 3 0.03 36 1.3
4
1600 4 800 60 4 0.04 48 1.4
5
2000 5 1000 75 5 0.05 60 1.5
00.02 0.04 0.06 0.08 0.10.12 0.14 0.16
0
2
4
6
8
10
12
Sampling period
Tri a l
= 1
Tri a l
= 2
Tri a l
= 3
Tri a l
= 4
Tri a l
= 5
Mutual information
Linear mutual information: normal data
(a)
00.02 0.04 0.06 0.08 0.10.12 0.14 0.16
0
10
20
30
40
50
60
70
80
90
Sampling period
Tri a l
= 1
Tri a l
= 2
Tri a l
= 3
Tri a l
= 4
Tri a l
= 5
Mutual information
Linear mutual information: attack data
(b)
00.02 0.04 0.06 0.08 0.10.12 0.14 0.16
0
2
4
6
8
10
12
14
16
Sampling period
Tri a l
= 1
Tri a l
= 2
Tri a l
= 3
Tri a l
= 4
Tri a l
= 5
Mutual information
Nonlinear mutual information: normal data
(c)
00.02 0.04 0.06 0.08 0.10.12 0.14 0.16
0
50
100
150
200
250
300
350
Sampling period
Tri a l
= 1
Tri a l
= 2
Tri a l
= 3
Tri a l
= 4
Tri a l
= 5
Mutual information
Nonlinear mutual information: attack data
(d)
Figure 6: 50-node random topolog y. The upper frames show the linear mutual information while the lower frames show nonlinear mutual
information. The left-hand side plots are for normal traffic while the right-hand side plots are for attack traffic.
even though the attack cannot be seen by visual inspection of
the link utilization plots. It is important to note that since the
link utilization remains constant during the attack, count-
based methods that simply consider the amplitude of the link
utilization during a sample period are unable to detect the at-
tack.
6. EXPERIMENTAL STUDY
To further investigate mutual information-based detection
schemes, traces from a backbone link were used. Specifically,
we examine packet traces captured on SONET OC-48 links
by CAIDA monitors. The link runs from San Jose, Calif, to
Khushboo Shah et al. 11
HTTP clients
Attack destinations
Attack sources
Link under attack
HTTP client
HTTP server
100
100
10
10
10
10
10
1
2
3
0
45
45
5
43
5
45
10
10
10
Figure 7: 100-node transit-stub topolog y. The link under attack is
0–2.
Seattle, Wash, and belongs to US tier 1 backbone Internet ser-
vice provider (ISP). The traces were collected by Linux-based
monitor with Dag 4.11 network cards and packet capture
software originally developed at the University of Waikato
and currently produced by Endace. The data was collected
over a 1-hour period on August 8, 2002. During this time,
the average link utilization was 14.7%. The packet trace cap-
tured a UDP-flooding attack. The detection of this attack is
used as a test case for examining the performance of mutual
information-based detection.
The mutual information of the time series of the aver-
age link utilization over a 62 ms sample intervals was com-
puted. Based on the first 1000 samples, the nominal mutual
information was determined. We denote this nominal value
as
¯
I, whereas the mutual information found after processing
anewobservationisdenotedbyI
k
. We take the lag to be 30
and compute the mutual information based on a window of
1000 observations. We employ the cumsum [6] technique to
distinguish normal mutual information from abnormal mu-
tual information. Specifically, an attack is declared when S
k
>
threshold, where S
k+1
= max(0, S
k
+ I
k
−
¯
I), with S
0
= 0.
Figure 10 shows the time series of S before and during the
UDP-flooding attack. The start of the attack can easily be ob-
served by the sharp r ise in S toward the end of the trial.
Clearly, the performance of the detection scheme is re-
lated to the value of threshold. Figure 11 shows the relation-
ship between the false alarm rate and threshold. A false alarm
is said to occur if S
k
exceeds threshold without attack. After a
false alarm, S is reset to 0 and the time series is continued to
be processed. As expected, as threshold grows, the false alarm
rate decreases. No false alarms occurred for threshold above
160, hence no points are included for threshold > 160. How-
ever, as long as threshold is below 1600, the attack is detected.
7. CONCLUDING REMARKS
Theinvestigationsreportedherehavedemonstratedthat
some specific attack scenarios, while perhaps not visible by
Link utilization
Attack starts
Time
0 0.5 1 1.5 2 2.5 3 3.5 4
10
5
0
0.05
0.1
0.15
0.2
0.25
0.3
0.35
0.4
Upstream server link
(a)
Link utilization
Attack starts
Time
0 0.5 1 1.5 2 2.5 3 3.5 4
10
5
0
0.1
0.2
0.3
0.4
0.5
0.6
0.7
Link under attack
(b)
Link utilization
Attack starts
Time
0 0.5 1 1.5 2 2.5 3 3.5 4
10
5
0
0.1
0.2
0.3
0.4
0.5
0.6
0.7
Upstream client link
(c)
Figure 8: Link utilization versus time.
naked eye observation of tra ffic plots, nevertheless create dy-
namical shift substantial enough for the mutual information
to be affected in a sizable manner. It appears that the signal
to be monitored is the link utilization at some link in the
vicinity of the target of the attack. Results have shown that
mutual information is espe cially useful in detecting flooding
attacks such as CBR attacks. Other attacks, like SYN, which
disrupts the normal sequencing of control and data pack-
ets, would require a distinction between control and data
packets, which is left for further research. From a broader
12 EURASIP Journal on Advances in Signal Processing
00.02 0.04 0.06 0.08 0.10.12 0.14 0.16
0
5
10
15
20
25
30
35
40
45
50
Sampling period
Tri a l
= 1
Tri a l
= 2
Tri a l
= 3
Tri a l
= 4
Tri a l
= 5
Mutual information
Full nonlinear mutual information: normal data
(a)
00.02 0.04 0.06 0.08 0.10.12 0.14 0.16
0
10
20
30
40
50
60
70
Sampling period
Tri a l
= 1
Tri a l
= 2
Tri a l
= 3
Tri a l
= 4
Tri a l
= 5
Mutual information
Full nonlinear mutual information: attack data
(b)
Figure 9: 100-node transit-stub topology. The plot shows the nonlinear mutual information.
0 1000 2000 3000 4000
0
500
1000
1500
2000
Seconds
S
k
Figure 10: Time series of S
k
, the cumsum of the mutual informa-
tion. This data is from a backbone link. The steep increase at around
the 10000th sample is due to a UDP flooding attack.
perspective, it appears that TCP traffichasamutualinfor-
mation signature distinct from that of non-TCP traffic, so
that any deviation, malicious or not, from TCP would be de-
tectable. While the utility of mutual information has been
demonstrated through simulations and experiments, further
work is required to determine the performance under the
wide range of trafficscenariosfoundinrealnetworks.
REFERENCES
[1] S. Kent, “On the trail of intrusions into information systems,”
IEEE Spectr um, vol. 37, no. 12, pp. 52–56, 2000.
[2] D. Moore, G. Voelker, and S. Savage, “Inferring internet denial
of service activity,” in Proceedings of the 10th USENIX Security
Symposium, Washington, DC, USA, August 2001.
10
0
10
1
10
2
10
4
10
3
10
2
10
1
Threshold
False alarm rate (1/sec)
Figure 11: False alarm rate versus threshold. No false alarms oc-
curred for threshold above 160. However, the attack was detected if
threshold is below 1600.
[3] V. Paxson, “Bro: a system for detecting network intruders in
real-time,” IEEE Computer Networks, vol. 31, no. 23-24, pp.
2435–2463, 1999.
[4] M. Roesch, “Snort-lightweight int rusion detection for net-
works,” in Proceedings of the USENIX LISA Conference on Sys-
tem Administration, pp. 229–238, Seattle, Wash, USA, Novem-
ber 1999.
[5] S. Staniford, J. A. Hoagland, and J. M. McAlerney, “Practical
automated detection of stealthy portscans,” Journal of Com-
puter Security, vol. 10, no. 1-2, pp. 105–136, 2002.
[6] M. Basseville and I. Nikiforov, Detection of Abrupt Changes:
Theory and Application, Prentice Hall, Englewood Cliffs, NJ,
USA, 1993.
[7] H. Wang, D. Zhang, and K. G. Shin, “Change-point moni-
toring for the detection of DoS attacks,” IEEE Transactions on
Khushboo Shah et al. 13
Dependable and Secure Computing, vol. 1, no. 4, pp. 193–208,
2004.
[8] V. A. Siris and F. Papagalou, “Application of anomaly detection
algorithms for detecting SYN flooding attacks,” in Proceedings
of the IEEE Global Telecommunications Conference (GLOBE-
COM ’04), vol. 4, pp. 2050–2054, Dallas, Tex, USA, November-
December 2004.
[9] C. Wong, S. Bielski, J. M. McCune, and C. Wang, “A study of
mass-mailing worms,” in Proceedings of the ACM C CS Work-
shop on Rapid Malcode (WORM ’04), Washington, DC, USA,
October 2004.
[10] D. Whyte, E. Kranakis, and P. C. van Oorschot, “DNS-based
detection of scanning worms in an enterprise network,” in Pro-
ceedings of the 12th Annual Network and Distributed System Se-
curit y Symposium (NDSS ’05),SanDiego,Calif,USA,Febru-
ary 2005.
[11] D. Whyte, E. Kranakis, and P. C. van Oorschot, “ARP-based
detection of scanning worms within an enterprise network,” in
Proceedings of the 21st Annual Computer Security Applications
Conference (ACSAC ’05), Tucson, Ariz, USA, December 2005.
[12] J. Mirkovic, G. Prier, and P. L. Reiher, “Attacking DDoS at the
source,” in Proceedings of the IEEE International Conference
on Network Protocols (ICNP ’02), pp. 312–321, Paris, France,
November 2002.
[13] K. Shah, S. Bohacek, and E. Jonckheere, “On the predictability
of data network traffic,” in Proceedings of the American Con-
trol Conference (ACC ’03), vol. 2, pp. 1619–1624, Denver, Colo,
USA, June 2003.
[14] C. S. Wallace and D. L. Dowe, “Minimum message length and
Kolmogorov complexity,” The Computer Journal,vol.42,no.4,
pp. 270–283, 1999.
[15] E. Jonckheere and J. Helton, “Power spectrum reduction by
optimal hankel norm approximation of the phase of the
outer spectral factor,” IEEE Transactions on Automatic Control,
vol. 30, no. 12, pp. 1192–1201, 1985.
[16] A. Zvonkin and L. Levin, “The complexity of finite objects and
the development of the concepts of information and random-
ness by means of the theory of algorithms,” Russian Mathe-
matical Surveys, vol. 25, no. 6, pp. 83–124, 1970.
[17] D. M. Sow and A. Eleftheriadis, “Complexity distortion the-
ory,” IEEE Transactions on Information Theory, vol. 49, no. 3,
pp. 604–608, 2003.
[18] Y. I. Manin, A Course in Mathematical Logic, Springer, New
York, NY, USA, 1977.
[19] H. Akaike, “Markovian representation of stochastic processes
by canonical variables,” SIAM Journal on Control, vol. 13, no. 1,
pp. 162–173, 1975.
[20] L. Breiman and J. H. Friedman, “Estimating optimal transfor-
mations for multiple regression and correlation,” Journal of the
American Statistical Association, vol. 80, pp. 580–619, 1985.
[21] M. Sipser, Introduction to the Theory of Computation,PWS,
Boston, Mass, USA, 1997.
[ 22] V. V. Nem yt sk ii an d V. V. St ep an ov, Qualitative Theory of Dif-
ferential Equations, Dover, New York, NY, USA, 1989.
[23] F. Brini, S. Siboni, G. Turchetti, and S. Vaienti, “Decay of cor-
relations for the automorphism of the torus
T
2
,” Nonlinearity,
vol. 10, no. 5, pp. 1257–1268, 1997.
[24] N. Haydn and E. A. Jonckheere, “On mutual information,”
2005, />[25] W. Stallings, High-Speed Networks TCP/IP and ATM Design
Principles, Prentice Hall, Englewood Cliffs, NJ, USA, 1st edi-
tion, 1998.
[26] M. E. Crovella and A. Bestavros, “Self-similarity in world wide
web traffic: evidence and possible causes,” IEEE/ACM Transac-
tions on Networking, vol. 5, no. 6, pp. 835–846, 1997.
[27] A. Feldmann, A. C. Gilbert, and W. Willinger, “Data networks
as cascades: investigating the multifractal nature of Internet
WAN tr affic,” in Proceedings of the ACM Conference on Appli-
cations, Technologies, Architectures, and Protocols for Computer
Communication ( SIGCOMM ’98), pp. 42–55, Vancouver, BC,
Canada, August-September 1998.
[28] N. X. Liu and J. S. Baras, “On scaling property of network traf-
fic in small scales,” submitted to Computer Networks.
[29] />[30] D. E. Denning, “An intrusion detection model,” IEEE Transac-
tions on Software Eng ineering, vol. 13, no. 2, pp. 222–232, 1987.
[31] A. Ghosh, J. Wanken, and F. Charron, “Detection anoma-
lous and unknown intrusions agains programs,” in Proceedings
of the 14th Annual Computer Security Applications Conference
(ACSAC ’98), pp. 259–267, Scottsdale, Ariz, USA, Decemeber
1998.
[32] H. S. Javitz and A. Valdes, “The SRI IDES statistical anomaly
detector,” in Proceedings of the IEEE Computer Soc iety Sympo-
sium on Research in Securit y and Privacy, pp. 316–326, Oak-
land, Calif, USA, May 1991.
[33] C. Ko, M. Ruschitzka, and K. Levitt, “Execution monitor-
ing of security-critical programs in distributed systems: a
specification-based approach,” in Proceedings of the IEEE Com-
puter Society Symposium on Research in Security and Privacy,
pp. 175–187, Oakland, Calif, USA, May 1997.
[34] T. Lane and C. E. Brodley, “Temporal sequence learning and
data reduction for anomaly detection,” in Proceedings of the 5th
ACM Conference on Computer and Communications Security
(CCS ’98), pp. 150–158, San Francisco, Calif, USA, November
1998.
[35] W. Lee and S. Stolfo, “A framework for constructing features
and models for intrusion detection systems,” in Proceedings
of the 5th ACM SIGKDD International Conference on Knowl-
edge Discovery and Data Mining,SanDiego,Calif,USA,Au-
gust 1999.
[36] S. Forrest, S. A. Hofmeyr, A. Somayaji, and T. A. Longstaff,
“A sense of self for unix processes,” in Proceedings of the IEEE
Symposium on Security and Privacy, pp. 120–128, Oakland,
Calif, USA, May 1996.
[37] R. Anderson and A. Khattak, “The use of information retrieval
techniques for intrusion detection,” in Proceedings of the 1st
International Wor kshop on the Recent Advances in Intrusion
Detection (RAID ’98), Louvain-la-Neuve, Belgium, September
1998.
[38] H. S. Teng, K. Chen, and S. C Y. Lu, “Adaptive real-time
anomaly detection using inductively generated sequential pat-
terns,” in Proceedings of the IEEE Computer Society Symposium
on Research in Security and Privacy, pp. 278–284, Oakland,
Calif, USA, May 1990.
[39] T. Lunt, A. Tamaru, F. Gilham, et al., “A real-time intrusion de-
tection expert system (IDES),” Tech. Rep., Computer Science
Laboratory, SRI International, Menlo Park, Calif, USA, 1992.
[40] R. B. Blazek, H. Kim, B. Rozovskii, and A. Tartakovsky, “A
novel approach to detection of denial-of service attacks via
adaptive sequential and batch sequential change-point detec-
tion methods,” in Proceedings of the 2nd Annual IEEE Systems,
Man, and Cybernetics Information Assurance Workshop,New
York, NY, USA, June 2001.
[41] H. Wang, D. Zhang, and K. Shin, “Detecting SYN flooding
attacks,” in Proceedings of the 21st Annual Joint Conference of
the IEEE Computer and Communications Societies (INFOCOM
’02), vol. 3, pp. 1530–1539, New York, NY, USA, June 2002.
14 EURASIP Journal on Advances in Signal Processing
[42] V. Alarcon-Aquino and J. A. Barria, “Anomaly detection in
communication networks using wavelets,” IEE Proceedings:
Communications, vol. 148, no. 6, pp. 355–362, 2001.
[43] M. Thottan and C. Ji, “Anomaly detection in IP networks,”
IEEE Transactions on Signal Processing, vol. 51, no. 8, pp. 2191–
2204, 2003.
[44] P. Barford, J. Kline, D. Plonka, and A. Ron, “A signal analysis
of network traffic anomalies,” in Proceedings of the 2nd ACM
SIGCOMM Interne t Measurement Workshop (IMW ’02),pp.
71–82, Marseille, France, November 2002.
[45] C M. Cheng, H. T. Kung, and K S. Tan, “Use of spectral anal-
ysis in defense against DoS attacks,” in Proceedings of the IEEE
Global Telecommunications Conference (GLOBECOM ’02),
vol. 3, pp. 2143–2148, Taipei, Taiwan, November 2002.
[46] A. Hussain, J. Heidemann, and C. Papadopoulos, “A frame-
work for classifying denial of service attacks,” in Proceedings
of the ACM Conference on Applications, Technologies, Archi-
tectures, and Protocols for Computer Communications (SIG-
COMM ’03), pp. 99–110, Karlsruhe, Germany, August 2003.
[47] C. Partridge, D. Cousins, A. Jackson, R. Krishnan, T. Saxena,
and W. T. Strayer, “Using signal processing to analyze wireless
data traffic,” in Proceedings of the ACM Workshop on Wireless
Securit y, Atlanta, Ga, USA, September 2002.
[48] Z L. Zhang, V. Ribeiro, S. Moon, and C. Diot, “Small-
time scaling behaviors of Internet backbone traffic: an em-
pirical study,” in Proceedings of the 22nd Annual Joint Con-
ference of the IEEE Computer and Communications Societies
(INFOCOM ’03), vol. 3, pp. 1826–1836, San Francisco, Calif,
USA, March-April 2003.
[49] S. Evans, S. F. Bush, and J. Hershey, “Information assurance
through Kolmogorov complexity,” in Proceedings of the 2nd
DARPA Information Sur vivability Conference and Exposition II
(DISCEX-II ’01), Anaheim, Calif, USA, June 2001.
[50] G. Samoradnitsky and M. S. Taqqu, Stable Non-Gaussian Ran-
dom Processes, Stochastic Models with Infinite Variance, Chap-
man & Hall, New York, NY, USA, 1994.
[51] E. Jonckheere and B F. Wu, “Mutual Kolmogorov-Sinai en-
tropy approach to nonlinear estimation,” in Proceedings of the
IEEE Conference on Decision and Control, pp. 2226–2232, Tuc-
son, Ariz, USA, December 1992.
[52] S. Kullback, Information Theory and Statistics,Dover,New
York, NY, USA, 1968.
[53] B. F. Wu, “Identification and control of chaotic processes—
the Kolmogorov-Sinai entropy approach,” Ph.D. dissertation,
Department of Electrical Engineering, University of Southern
California, Los Angeles, Calif, USA, 1992.
[54] W. E. Larimore, “Identification and filtering of nonlinear sys-
tems using canonical variate analysis,” in Nonlinear Modeling
and Forecasting, vol. 12 of SFI Studies in the Sciences of Com-
plexity, pp. 283–303, Addison-Wesley, Reading, Mass, USA,
1991.
[55] W. Leland, M. Taqqu, W. Willinger, and D. Wilson, “On
the self-similar nature of Ethernet traffic (extended version),”
IEEE/ACM Transactions on Networking, vol. 2, no. 1, pp. 1–15,
1994.
[56] P. Pruthi and A. Erramilli, “Heavy-tailed ON/OFF source
behavior and self-similar traffic,” in IEEE International
Conference on Communications, vol. 1, pp. 445–450, Seattle,
Wash, USA, June 1995.
[57] CERT, “CERT advisory CA-96.01: UDP port denial-of-service
attack,” />advisories/ca-96.01.udp
service denial.
[58] ERT Coordination Center, “Overview of attack trends,” http://
www.cert.org/archive/pdf/attacktrends.pdf.
Khushboo Shah received her B.S. degree in
electrical engineering from L.D. College of
Engineering, India, in 1998 and M.S. de-
gree in electrical engineering from the Uni-
versity of Southern California, Los Angeles,
in 2001. She spent Summer 2003 at CAIDA
working on internet traffic analysis. She re-
ceived her Ph.D. degree in electrical engi-
neering from the University of Southern
California, in 2006. Currently, she is work-
ing as a Research Scientist at Nevis Networks Inc. Her main focus
is network security for enterprise networks. Her research interests
also include traffic characterization and modeling, TCP modeling,
and congestion control.
Edmond Jonckheere received the Electrical
Engineer degree from the University of Lou-
vain, Belgium, in 1973, the Doctor in En-
gineering degree in aerospace engineering
from the University of Toulouse, France, in
1975, and the Ph.D. degree in electrical en-
gineering from the University of Southern
California, in 1978. From 1973 to 1975, he
was with the Laboratory for Systems Anal-
ysis and Architecture, Toulouse, France, as
a Research Fellow of the European Space Agency. From 1975 to
1978, he was a Fulbright/Hays Fellow in the Department of Electri-
cal Engineering–Systems of the University of Southern California.
From 1979 to 1980, he was with the Philips Research Laboratory,
Brussels, Belgium. In 1980, he returned to the University of South-
ern California, where he is currently a Full Professor of Electrical
Engineering and Mathematics, an Associate Member of the Center
for Applied Mathematical Sciences (CAMS), and a Member of the
Center for Computer Systems Security (CCSS) of the Information
Sciences Institute (ISI) of the University of Southern California. He
is a Fellow of the Institute of Electrical and Electronics Engineers
(IEEE) and he is currently an Associate Editor of the IEEE Transac-
tions on Automatic Control.
Stephan Bohacek re ceived the B.S. degree
in electrical engineering from the Univer-
sity of California at Berkeley, in 1989. He
received the Ph.D. degree in electrical en-
gineering from the University of Southern
California, in 1999. He is currently an Assis-
tant Professor in the Department of Elect ri-
cal and Computer Engineering at the Uni-
versity of Delaware. His research focuses on
the design, analysis, and control of data net-
works. His current interests include congestion control and routing
for wireless and wireline networks, modeling mobile wireless net-
works, and cross-layer design for wireless networks.