Báo cáo hóa học: " Research Article On the Vectorization of FIR Filterbanks Jayme Garcia Arnal Barbedo and Amauri Lopes" pptx
Bạn đang xem bản rút gọn của tài liệu. Xem và tải ngay bản đầy đủ của tài liệu tại đây (814.84 KB, 10 trang )
Hindawi Publishing Corporation
EURASIP Journal on Advances in Signal Processing
Volume 2007, Article ID 91741, 10 pages
doi:10.1155/2007/91741
Research Article
On the Vectorization of FIR Filterbanks
Jayme Garcia Arnal Barbedo and Amauri Lopes
Department of Communications, FEEC, State University of Campinas (UNICAMP), P.O. Box 6101, 13083-970 Campinas, SP, Brazil
Received 20 October 2005; Revised 23 May 2006; Accepted 22 June 2006
Recommended by Roger Woods
This paper presents a vectorization technique to implement FIR filterbanks. The word vectorization, in the context of this work,
refers to a strategy in which all iterative operations are replaced by equivalent vector and matrix operations. This approach allows
that the increasing parallelism of the most recent computer processors and systems be properly explored. The vectorization tech-
niques are applied to two kinds of FIR filterbanks (conventional and recursive), and are presented in such a way that they can be
easily extended to any kind of FIR filter banks. The vectorization approach is compared to other kinds of implementation that do
not explore the parallelism, and also to a previous FIR filter vectorization approach. The tests were performed in Matlab and C,in
order to explore different aspects of the proposed technique.
Copyright © 2007 J. G. A. Barbedo and A. Lopes. This is an op en access article distributed under the Creative Commons
Attribution License, which permits unrestricted use, distribution, and reproduction in any medium, provided the original work is
properly cited.
1. INTRODUCTION
Since its beginning, the fast Fourier t ransform (FFT) has
been one of the most popular techniques for time-frequency
decomposition. The arising of faster FFT algorithms [1, 2]
caused an even more pronounced supremacy. However, the
properties of the time-frequency decomposition performed
by FFT do not match with the requirements of certain appli-
cations, especially when good temporal and spectral resolu-
tions are demanded at the same time. In those cases, other
techniques must be considered. One of such alternatives is
the finite impulse response (FIR) filterbank.
Although filterbanks have several advantages over FFT
[3], the high computational complexity associated to them
often implies their replacement by FFT, even with sacrifice
of the temporal or spectral resolution. In this context, this
paper aims to provide a fast and effective implementation of
FIR filterbanks by using vectorization techniques which are
able to efficiently explore the increasing parallelism of mod-
ern microprocessors, vector processors, and supercomputers.
Moreover, it is intended that the information presented in
this paper inspire the development of new efficient codes in
different areas of digital signal processing.
The word vectorization is often associated to the high-
performance computational field, by using supercomputers
with great number of parallel processors or vector processors
highly specialized to deal with vector and matrix operations
[4–7]. Nevertheless, the microprocessors used in personal
computers have gradually incorporated parallel computa-
tional capabilities in order to improve their performance. In
the context of this work, the vectorization is associated to the
substitution of iterative segments of a code by vector and ma-
trix operations.
All tests to assess the performance of the vectorization
techniques proposed here were carried out in a computer
with conventional processor. Codes written in C were used
whenever the main goal was to compare the proposed ap-
proach with previous techniques, which are often imple-
mented in C. On the other hand, codes written in Matlab
were preferred when the main goal was showing the relative
difference between the runtimes of vectorized and nonvec-
torized codes. In this context, Matlab shows several desirable
characteristics, like easier implementation and better visual-
ization of the vectorization effects, since purely vector codes
written in this tool can be much faster than their loop-based
versions. This occurs because Matlab uses the processor’s reg-
isters to store the vectors instead of sending and recovering
them from memory, saving lots of time and making the exe-
cution much faster. In other words, it automatically uses the
parallelism capability of the processor.
The vectorizing techniques to be presented next are use-
ful not only in cases where the implementations are car-
ried out in Matlab or C, but also in situations where other
general purpose programming languages are used together
2 EURASIP Journal on Advances in Signal Processing
with vectorizing compilers. In this last case, the information
present in the paper can make the construction of vectoriz-
able loops quite straightforward. In the case of Matlab, the
procedureisevensimpler,sincetheequationsmustbeim-
plemented exactly as presented in the following Sections.
Finally, it is important to underline that the following
sections include some optimization techniques that are not
directly related to vectorization. The most important of such
techniques is the division of the signals into frames, which
aims to reduce memory requirements. This procedure is par-
ticularly effective when long signals are considered, b ecause
the memory requirements are no longer determined by the
length of the entire signal, but by the length of each frame.
The association of the signal division with vectorization tech-
niques led to good results, as presented in Section 5.
The paper is divided as follows. Section 2 presents a brief
discussion about related works; Section 3 explores the vector-
ization applied to decimation finite impulse response filter-
banks; Section 4 presents a vectorization technique applied
to a specific example of a recursive FIR filterbank, which
combines characteristics from both FIR and IIR filterbanks,
as well as some particular features; Section 5 describes the
tests and corresponding results; finally, Section 6 presents
some conclusions.
2. RELATED WORKS
The optimization of filters and filterbanks computational
performance is not a new task. The efforts to find efficient
implementations have begun practically together with the
digital signal processing field itself, and lots of techniques
have been proposed so far. This section presents some of
the most important of those works. The first part of the sec-
tion presents some general proposals, while the second part
is dedicated to works dealing with vectorization.
An interesting early work dealing with the efficient im-
plementation of filterbanks was [8]. The author presented an
optimized implementation of a decimation filterbank used
in speech recognition applications. The techniques used to
reduce the computational complexity were dithering and the
Winograd Fourier transform algorithm.
In [9], the authors use genetic algorithms to design low
complexity digital FIR filters. The proposed method also uses
a primitive operator directed graph implementation to re-
duce the computational complexity.
A combination of minimum-adder canonic signed digit
(CSD) multiplier blocks with a technique that trades adders
fordelaysisusedin[10] to reduce the hardware require-
ments for fixed coefficient FIR filters.
In [11], the authors present a public domain Matlab
program that generates optimized VHDL descriptions of
filter implementations, u sing CSD or DM (Dempster and
Macleod) techniques.
An optimized structure for decimation filterbanks to be
used in mobile systems is the focus of the techniques pro-
posed in [12].Thefinalgoalisahardwareefficient VLSI im-
plementation.
The optimization of nearly perfect reconstruction FIR
cosine-modulated filterbanks is presented in [13]. The im-
plementation is based on a new expression for the analysis
bank.
The optimization procedures of the works presented next
are al l based on vectorization techniques.
An important early work dealing specifical ly with vector-
ization was [14]. The authors present a number of vectoriza-
tion methods applied to the implementation of digital filters
in pipelined vector processors.
Reference [15] deals with the subject of high sampling
rate realizations for transversal adaptive filters. A parallel al-
gorithm is mapped onto a linear array of highly pipelined
processing modules, resulting in a system able to efficiently
implement transversal adaptive filters.
In [16], the authors present a tool that eases the conver-
sion of conventional DSP programs into vector operations
using simple vector units.
An efficient implementation of recursive digital filters
into vector SIMD DSP architectures is presented in [17]. Vec-
tor DSPs are also the focus of references [18, 19].
Some ideas present in previous works inspired part of the
strategy presented in this paper, but the general approach of
the method is quite different from its predecessors, as will be
seen in next sections.
3. VECTOR IMPLEMENTATION OF DECIMATION
FIR FILTERBANK
There are several situations that require some kind of signal
decimation. It is common that the decimation be associated
to a filtering process. In general, both procedures can be com-
bined in such a way that computational resources are saved.
This situation has motivated the use of a decimation FIR fil-
terbank instead of a regular one, making the techniques pre-
sented here more general. The procedure for nondecimation
FIR filterbanks can be obtained by simply making the deci-
mation factor presented in (1)equaltoone.
In this section, a signal x(n), 1
≤ n ≤ N
s
,tobefilteredby
a decimation FIR filter b ank, is considered. The kth filter, 1
≤
k ≤ K,hascoefficients b
ki
,1≤ i ≤ C
fk
. The corresponding
signal at the output of the kth filter is
y
k
(n) =
C
fk
i=1
b
ki
· x(n − i), n = D,2D,3D, ,(1)
where D is the desired decimation factor.
The vectorial procedure to implement the filtering pro-
cess has three main goals: (1) the FIR filtering convolutions
must be carried out using multiplication of matrices instead
of loops; (2) all filters in the filterbank must be applied at
once; (3) the decimation must be performed during the fil-
tering, and not after, in such a way that the calculations are
done only for those output samples to be considered after the
decimation. This particular filtering process was chosen be-
cause it contains a number of procedures commonly used in
the implementation of filters. In this way, the techniques can
be easily extended both to simpler and more complex imple-
mentations.
J. G. A. Barbedo and A. Lopes 3
Other filters—(C
f
-x) coefficientsx/2 zeros x/2 zeros
Longest filter—C
f
coefficients
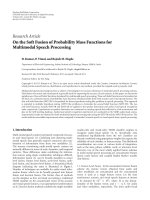
Figure 1: Filter length equalization.
The strategy to be presented can be divided into six steps:
(1) the coefficient vectors of the filters are prepared to be
submitted to the next processing in step (2);
(2) the coefficient vectors are grouped into a single matrix,
the coefficient matrix;
(3) the signal to be filtered is divided into frames;
(4) each frame is split into subframes, which are grouped
into a matrix, the frame matrix;
(5) each frame matr ix is multiplied by the coefficient ma-
trix, producing the corresponding convolved matrix,
that is, the matrix composed of the corresponding fil-
terbank output;
(6) the convolved matrices are concatenated, generating
the final time-frequency decomposition of the signal.
As can be seen, the first two steps are related to the pre-
processing of the filters, the next two prepare the signal for
filtering and the last two perform the filtering. The details of
the steps are presented next.
3.1. Preparing the filters for the vector processing
Firstly, the number of coefficients of each filter must be ad-
justed to match the number of coefficients of the filter with
longest impulse response. Moreover, the coefficient vectors
must be aligned in such a way that the center coefficients
match the same position along the vectors. This procedure
is necessary to prepare the coefficients for the convolution to
be performed in following steps.
This adjustment is done by adding zeros at the beginning
andattheendofeachcoefficient vector, as shown in Figure 1.
If the difference between the number of coefficients is odd, an
extra null coefficient must be located at the beginning of the
vector .
After the length adjustment, each sequence of coefficients
must be reversed, meaning that the last coefficient becomes
the first, the penultimate becomes the second, and so on.
Finally, the reversed coefficient vectors are grouped into
a single K-by-C
f
matrix, here named C
k
,whereC
f
is the
length of the longest impulse response. Note that the kth
row of matrix C
k
is the reversed coefficient vector for the kth
filter.
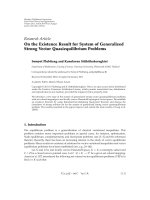
3.2. Division of signal
The sig nal must be divided into frames aiming to reduce the
amount of data to be stored in the memory at a time. This
procedure has practically no impact on the number of math-
ematical operations, but makes storing, accessing, and re-
trieving the data much faster, as can be seen in the results
Whole signal
N
f
-sample frame
S
p
N
f
-sample frame
.
.
.
N
f
-sample frame
Figure 2: Division of the signal into frames.
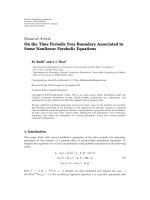
ith subframe
of frame k
D
(i + 1)th subframe
of frame k
Figure 3: Delay between consecutive frames.
presented in Section 5. The designer must choose a frame
size adequate to the available computational resources and
the characteristics of his project. Figure 2 illustrates this divi-
sion.
In Figure 2, N
f
is the length of the frames and S
p
is the
superposition between the frames. This superposition is nec-
essary to assure that the filtering will be correctly performed,
as will be seen in Section 3.3.
3.3. Subdivision of the frames
Each frame is divided into subframes with C
f
samples. Each
subframe corresponds to the ensemble of samples necessary
to produce an output sample. Also, the beginning of a sub-
frame is D samples after the beginning of the last subframe,
as shown in Figure 3, in order to take into account the desired
decimation factor D.
Figure 4 shows that the last subframe of a frame will
not necessarily exactly fit the end of the respective frame.
In this case, a number of samples will remain unprocessed
(a in Figure 4). Those samples must be considered in the
next frame. As a consequence, the beginning of the next
frame must be at the sample located at D samples after the
beginning of the last subframe. This a rrangement justifies
the superposition between consecutive frames mentioned in
Section 3.2.
The superposition between frames is
S
p
= N
f
− D · (1 + R), (2)
where R
=(N
f
− C
f
)/D.
After this division, the subframes of the ith frame are
concatenated into an R-by-C
f
matrix, named X(i), as shown
in Figure 5. This matrix allows that the filter coefficients be
4 EURASIP Journal on Advances in Signal Processing
C
f
ith frame
(N
f
samples)
C
f
a
DD
Superposition
C
f
D
D
(i + 1)th frame
(N
f
samples)
C
f
Figure 4: Superposition between the frames.
ith frame (N
f
samples)
C
f
D
DD
C
f
a
C
f
C
f
Frame 1—sample 1 to C
f
Frame 2—sample 1 + D to C
f
+ D
Frame R—sample 1 + rD to C
f
+ rD
.
.
.
Figure 5: Concatenation of subframes into a matrix.
applied matricially to the whole signal, in such a way that all
K filters are applied at a time.
3.4. Matrix filtering
Next, the matr ix filtering is performed according to
C
K×C
f
· X
T
C
f
×R
(i) = F
K×R
(i), (3)
where X
T
denotes the transposed of X.Therowsofmatrix
F(i) are the signals at the output of the filters, corresponding
to the ith frame at the input. This procedure is repeated for
allframes(indexi in (3)).
3.5. Concatenation of results
The matrices F(i) are concatenated into a single matrix G
according to (4), where M is the number of frames. The rows
of matrix G are the signals at the output of the filterbank,
corresponding to the entire signal x( n) at the input,
G
=
F(1) F(2) ··· F(M)
. (4)
Note that the procedure described here can be applied to
signals of any length. Moreover, the procedure can be applied
even if the length is unknown. In any circumstance there will
be an output delay of one frame or more.
4. VECTOR IMPLEMENTATION OF DECIMATION
RECURSIVE FIR FILTERBANK
This section presents vectorization techniques for a specific
FIR filterbank implemented in a recursive way. This recur-
sion is obtained by means of a pole added to the system func-
tion; a zero, at the same position, cancels the pole. This par-
ticular form is motivated by a proposal presented in [3]fora
bandpass filterbank.
4.1. Description of the filterbank
The kth filter of the bank, 1
≤ k ≤ K, is described by the
difference equation
y
k
(n) =
D−1
m=0
a
km
· x(n−m)−a
∗
km
· x
n − m − 1+D + C
fk
+ b
k
· y(n − D),
(5)
J. G. A. Barbedo and A. Lopes 5
where
n
= 1, D +1,2D +1, ,
a
km
= e
[ j·(M−(C
fk
+D−1/2))·Ω
Ck
]
,
b
k
= e
j·D·Ω
Ck
for n ≤ 0 −→ y(n) = 0, x(n) = 0,
(6)
D is the decimation factor, which must be smaller than the
order C
jk
of the filters. Note that the recursive part of the
filters corresponds to the feedback of a single output sample.
The nonrecursive part involves two terms. Each of those
termsusesonlyD samples of the signal x(n)toproducean
output sample. This is a special situation that demands ad-
ditional vectorization procedures because the application of
the procedures presented in Section 3 wouldleadtoasparse
coefficient matrix, with zero elements in the positions that
do not play a role in the filtering. This sparse matrix would
demand useless computational effort due to multiplications
by zero.
Therefore, it is necessary to create a procedure to calcu-
late the nonrecursive part of (5).
4.2. Implementation of the nonrecursive part
This proposal follows the same general strategy described in
Section 3. Then, the first task is the division of the signal x(n)
into frames with N
f
samples in order to reduce memory re-
quirements.
Next, each frame is divided into subframes. However, the
frame division must be p erformed carefully, since some ques-
tions must be considered: (1) the length C
fk
of the filters can
vary considerably, depending on the passband width of each
filter; (2) the relative position of the filter coefficients and the
signal must be adjusted in order to keep the filtered versions
of the signal aligned. This implies that the center coefficient
of each filter must be aligned with the same signal sample;
(3) as can be seen in (5), the first term of the nonrecursive
part uses the samples x(n), x(n
− 1), , x(n − D +1),while
the second term uses the samples x(n
− 1+D + C
fk
), x(n −
2+D + C
fk
), , x(n + C
fk
). Those samples are located at
the opposite extremes of a segment of a signal with length of
C
fk
+ D samples.
The frame division proposed here creates subframes with
D samples (equal to the decimation factor). This is because
each term of the nonrecursive part in (5) uses only D samples
of x(n) to produce an output sample.
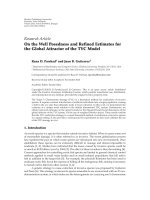
The frame division is illustrated in Figure 6, where the
decimation factor is D
= 8 and the highest filter order is
C
f
= 60. A 40th-order filter is also shown in the example.
Each frame is, therefore, divided into 8-sample segments.
The following procedures must be carried out.
(i) In the case of the highest-order filter (Figure 6(a)), the
first D
= 8coefficients are applied to the first eight
samples of the signal (situation 1). Unless the order of
the filter is a multiple of eight, the last eight coefficients
of the filter will not be applied to the correct samples,
as in the example. To align the last eight coefficients of
Signal segmentation
8samp8samp8samp8samp8samp
8samp
MismatchMatch
Filter with highest order (60)
44 ignored coefficients
Signal segmentation (new division)
match
1
2
8samp8samp8samp8samp
8samp
(a)
Signal segmentation
8 samp 8 samp 8 samp 8 samp 8 samp 8 samp
MismatchMismatch
Another filter (40)
24 ignored coefficients
Signal segmentation (new division)
matchmatch
3
48 samp 8 samp 8 samp 8 samp 8 samp 8 samp
(b)
Figure 6: Strategy to adjust the filter coefficients.
the highest-order filter with the correct samples of the
signal, a new splitting must be applied. In the example,
the new division must begin at the 5th sample of the
signal, ignoring the first four samples; thus, a correct
alignment is accomplished (situation 2).
(ii) The situation shown in Figure 6(b) refers to the 40th-
order filter, whose center must be aligned to the center
of the highest-order filter. In this case, the eight first
coefficients of the 40th-order filter will not be applied
to the eight first samples of the signal, and in most
cases, the samples to be weighted by the coefficients
will be located in different segments of the signal (sit-
uation 3). To correct this mismatch, the new splitting
must begin at the 3rd sample, ignoring the first two
samples (situation 4). As this filter has an order that is
a multiple of the decimation factor, this alignment is
also appropriate for the last coefficients. If this was not
true, a new splitting must be carr ied out.
The same procedure must be applied to all other lower
order filters of the bank.
As can be seen, depending on the number of filters, the
signal must be split as many times as the decimation fac-
tor. This situation increases the amount of data to be stored,
justifying the first division of the signal into fr a mes. How-
ever, despite the frame division, the additional processing
demanded by the splitting can be a problem if the decima-
tion factor is high. One possible solution, which was adopted
here, is to force the filter orders to be a multiple of some
number. For instance, in a case where D
= 32 and the or-
der of the filters is forced to be a multiple of 8, there will
be at most 8 possible different alignments, as illustrated in
Figure 7.
6 EURASIP Journal on Advances in Signal Processing
Ignored
coefs
Ignored
coefficients
Ignored coefficients
Ignored coefficients
Ignored coefficients
Ignored coefficients
Ignored coefficients
Ignored coefficients
32 samples 32 samples
Part of the signal
8th filter—72th order
7th filter—80th order
6th filter—88th order
5th filter—96th order
4th filter—104th order
3rd filter—112th order
2nd filter—120th order
1st filter—128th order
4samples
8samples
12 samples
16 samples
20 samples
24 samples
28 samples
Figure 7: Example of filterbank design.
The number of samples shown in the left of Figure 7 indi-
cates the number of samples to be discarded from the signal
for each case. In the case of Figure 7, the number of splits
to be applied to the signal is determined by half the differ-
ence between the lengths of two consecutive filters. This is
because the filters must have the center coefficients aligned
and the difference between their lengths will be equally dis-
tributed between both extremities. Therefore, the number of
splits for this example is 32/4
= 8.
This is the maximum number of splits required when the
filter orders are multiples of a number H.Thismaximum
occurs w h en there are as many filter orders as the multiples
of H inside the range between the lowest to highest orders.
Therefore, the maximum number S of splits for the proposed
procedure is
S
=
2 · D
H
. (7)
Note that increasing the value of H reduces the filter de-
sign flexibility. The designer must determine the compromise
between flexibility and memory requirements based on the
characteristics of the project.
Finally, it is important to emphasize that al l possible sig-
nal splits are performed and stored before applying the filters
to the signal. This procedure increases the amount of data
to be stored, but saves lots of computational resources, since
each split is performed only once.
4.3. Performing the summation
As described before, all split versions of a frame will be gen-
erated before the filtering procedure and will be stored. Ad-
ditionally, the filters will be grouped according to the cor-
responding split version required. Hence, the number of
groups will be equal to the number of splits applied to the
signal. The expression to determine in which group a given
filtermustbeisgivenby
s
=
C
fk
mod 2D
+2D
H
,(8)
where “mod 2D” is the module 2D operation.
Using the example of Figure 7, the first filter pertains to
group 8, the second to group 7, and so on, until the eighth
filter, which pertains to group 1. The possible following filters
would repeat such classifications, being grouped accordingly.
In this case, the 64th-order filter would be grouped together
with the 128th-order filter, the 56th with the 120th, and so
on.
In order to present the proposed concatenation of the fil-
ter coefficients, note that the expression inside the summa-
tion in (5) is divided into two terms: the first one makes use
of the first D coefficients of the filters, here called f
k
(i); the
second one makes use of the last D coefficients of the filters,
here called g
k
(i).
The coefficients f
k
(i)andg
k
(i) of the filters pertaining
to a certain group are arr anged into matrices F
s
and G
s
,re-
spectively. The index s varies from 1 to S, and indicates the
filter groups. The rows of matrix F
s
are the coefficients f
k
(i)
of those filters that pertain to group s. In the same way, the
rows of matrix G
s
are the coefficients g
k
(i) of the filters that
pertain to group s . Therefore, matrices F
s
and G
s
have D
columnsandanumberofrowsequaltothenumberoffilters
that pertain to group s.
The subframes corresponding to the split group s are
concatenated as the columns of a matrix X
s
with dimensions
D
×N
f
/D. After that, the summation of each term in (5)
J. G. A. Barbedo and A. Lopes 7
is calculated by
P
s
= F
s
· X
s
,
Q
s
= G
s
· X
s
.
(9)
At this point, matrices P
s
and Q
s
, for all values of s,con-
tain a number of patterns resulting from the filtering pro-
cess, but they are not correctly ordered, because the previous
grouping of filters does not respect the original sequence of
filters. Therefore, the matrices P
s
and Q
s
must not only be
concatenated, but the sequence of filters must be restored.
This procedure is indicated by the operator O(
·) in the fol-
lowing equations:
P
= O
P
s
,
Q
= O
Q
s
.
(10)
Finally, the matrices P and Q are combined according to
(5)as
C
= P − Q. (11)
This procedure completes the nonrecursive part of (5)
for a frame.
4.4. Implementation of the recursive part
The factor b
k
that multiplies y
k
in the last part of (5)isa
constant for each filter. Considering that the summation of
the nonrecursive part has already been determined, (5)can
be rewritten as
y
k
(i) = c
k
(i)+b
k
· y
k
(i − 1). (12)
In (12), i varies from 1 to L (length of the frames at the
output of the filters) and c
k
(i) is the summation vector for
the kth filter and ith sample, extracted from the matrix C.
Expanding (12) results in
y
k
(1) = c
k
(1),
y
k
(2) = c
k
(2) + b
k
· c
k
(1),
y
k
(3) = c
k
(3) + b
k
· c
k
(2) + b
2
k
· c
k
(1),
.
.
.
y
k
(L) = c
k
(L)+b
k
· c
k
(L − 1) + ···+ b
L−1
k
· c
k
(1).
(13)
Equation (13) is equivalent to a convolution between the vec-
tors c
k
(i) and the vectors [
1 b
k
b
2
k
··· b
L−2
k
b
L−1
k
]. Both
sets of vectors can be grouped into matrices in such a way
that (13)canbewrittenas
Y
= C ⊗ B, (14)
where
⊗ is the convolution between the corresponding lines
of matrices C and B. Performing this convolution in time-
domain implies a high computational cost. Thus, the best al-
ternative is to perform the convolution in the frequency do-
main, as given by
D
=
[ZB]
, E =
[ZC]
, (15)
Y
=
−1
{D · E}. (16)
In (15)and(16),
indicates the FFT,
−1
the inverse FFT,
Z is an all-zero matrix with the same dimensions of matrices
B and C, and the multiplication in (16) is scalar, meaning
that an element of one matrix will multiply only its corre-
spondent in the other one. The matrix Z is concatenated with
the other ones in order to change the convolution from cir-
cular to linear.
It is important to note that matrix B depends only on the
filters. Therefore, matrix B is known a priori a nd its FFT can
be calculated and stored before the filtering. This procedure
can save lots of computation, and the only shortcoming is
the physical memory resources needed. Nevertheless, the size
of the matrix is almost always insignificant compared to the
computational resources available in most systems.
The matrix Y resulting from the process corresponds to
the time-domain output of the filterbank.
4.5. Considerations on the IIR filterbanks vectorization
Due to the intrinsic recursive nature of IIR filters, only the
nonrecursive part of this kind of structure can be directly
vectorized using the strategies described in Section 3.How-
ever, some particular implementations can benefit from the
techniques described in this section. The degree of vector-
ization that can be reached in such cases will depend on the
characteristics of the project and also on the ability of the de-
signer in identifying possible vectorizable code segments.
5. TESTS AND RESULTS
5.1. Description of the filterbank used in the tests
The filterbank used in the tests is an approximate model to
the frequency separation performed by the human ear, which
consists of 40 filters [20–22]. The passbands have different
widths in Hertz, but are equally spaced and have a constant
bandwidth when measured in a perceptual scale. The center
frequencies vary from 50 Hz to 18 kHz. The envelopes of the
impulse responses have a cos
2
shape. The filter coefficients
are given by [22]
h(k, n)
=
⎧
⎪
⎪
⎪
⎪
⎪
⎪
⎨
⎪
⎪
⎪
⎪
⎪
⎪
⎩
4
N[k]
· sen
2
π · n
N[k]
·
cos
2π · f [k] ·
n −
N[k]
2
·
T
,0≤ n<N[k],
0; otherwise,
(17)
where k is the filter index, n is the time sample index, T is the
time between two samples, N[k] is the length of the impulse
response, and f (k) is the center frequency of the kth band
in Hertz. Dur ing the filtering, the signals are decimated by
a factor of 32. This filterbank was implemented using both
strategies presented in Sections 3 (FIR filterbank) and 4 (re-
cursive FIR filterbank).
8 EURASIP Journal on Advances in Signal Processing
5.2. Results
The tests were designed to compare the performance of the
proposed strategy with nonvectorized codes, and also with
another vectorization strategy found in the literature. The re-
sults achieved for conventional and recursive FIR filterbanks
are presented separately.
5.2.1. FIR filterbank
Six different implementations were tested for the filterbank,
as described in the following.
(1) All-sample approach using loops: in this implementa-
tion, the filtering is done using loops; additionally, the deci-
mation is done after the signal has been filtered.
(2) Selected-sample approach using loops: this version also
uses loops, but calculates only those samples to be considered
after the decimation.
(3) Quant ization of the filter coefficients: there are some
applications for which the quality of the filtered signal re-
mains satisfactory if the filter coefficients are quantized; this
procedure reduces drastically the number of multiplications,
since it is possible to group and sum samples to be submitted
to a same quantized coefficient before performing the multi-
plication; decimation is performed during the filtering, as de-
scribed in the second approach; this strategy also uses loops.
(4) Frequency-domain multiplication: the signals and fil-
ter coefficients are submitted to a fast Fourier transform
(FFT), the resulting patterns are multiplied and the inverse
FFT is calculated; the decimation is performed after the fil-
tering procedure.
(5) Overlap-and-save approach: it is quite similar to the
previous approach, but it reduces the amount of memory re-
quired at a time by dividing the signal into frames and com-
bining the filtered segments according to the overlap-and-
save methodolog y [23]; decimation is also performed after
the filtering procedure.
(6) Vectorized approach: it uses the procedure described
in Section 3.
Two audio excerpts sampled at 48 kHz and with dura-
tions of 2 and 20 seconds were used in the tests. The exper-
iments were performed in a microcomputer with processor
AMD Athlon 2000+, 512 MB of RAM, and Microsoft Win-
dows XP as operational system. All tests and implementa-
tions were performed using Matlab 6.5. The results for each
approach are shown in Table 1, and the comments are pre-
sented in the following.
It is important to highlight that the computation time
required by each algorithm was used as parameter of com-
parison, instead of the number of flops. This is b ecause the
number of flops is related to the number of operations,
but the techniques proposed here were developed having in
mind not only the reduction of the number of operations,
but also the reduction of memory requirements. Therefore,
techniques that do not result in fewer operations, but re-
duce the time needed to access memory, as the division of
the signals into frames, can be properly considered and as-
sessed.
Table 1: Results for the FIR filterbank.
Approach
Time required Time required
RI
2 seconds signal 20 seconds signal
1 441.19 s 14.563.5s 0.303
2
8.07 s 96.9s 0.833
3
26.01 s 945.3s 0.275
4
6.70 s 53.7s 1.247
5
3.73 s 50.4s 0.741
6
0.99 s 9.93 s 0.997
Another fac tor that has been considered in the compari-
son of the approaches is the index RI given by
RI
=
t
1
t
2
·
d
2
d
1
, (18)
where t
1
and t
2
are the time spent to filter the first and the
second signals, respectively, and d
1
and d
2
are the durations
of first and second signals. This index indicates how the com-
putation time varies with the length of the signal:
(i) if RI
= 1, the time required wil l vary linearly with the
length of the signals;
(ii) if RI < 1, the time spent will raise exponentially as the
length of the signal is increased;
(iii) if RI > 1, the time will raise logarithmically as the
length of the signal is increased.
High values of RI indicate good computational perfor-
mance for longer signals. It is desirable that RI be at least
0.95.
The following remarks are drawn from Table 1.
(i) Approach 1 is the worst option, due to the excessive
number of multiplications and the large amount of data to
be stored and retrieved from memory during the process.
The RI index indicates that the required computation time
increases exponentially with the length of the signal, which
is mostly due to the huge amount of memory required when
the entire signal is considered at once.
(ii) The number of calculations for approach 2 is 32 times
smaller than approach 1. Moreover, fewer samples are being
considered. As a consequence, the memory resources are less
stressed. However, although a lot of time has been saved, the
overall time spent is stil l too expensive. The RI indicates that
this approach is not appropriate to long signals, essentially
due to the same reasons pointed out for approach 1.
(iii) The performance of approach 3 is very disappoint-
ing, because it was expected that the great reduction in the
number of multiplications would improve the performance
of the filtering. However, this approach requires that a large
amount of data be continuously stored and retrieved from
memory, making the process slower. The RI value does not
recommend the use of this method for long signals.
(iv) Approach 4 was inefficient due to the large amount
of data to be stored in the memory. RI is high, but its use
only becomes advantageous for very long signals. However,
in such cases the memory required can exceed the computa-
tional resources.
(v) Technique 5 presents better results than the previous
ones, but its execution is still too slow. This is due to the
J. G. A. Barbedo and A. Lopes 9
Table 2: Results for the recursive FIR filterbank.
Approach Time demanded (s)
1 592.5
2
307.3
3
11.8
impossibility to perform the decimation directly during the
calculation of the inverse FFT, yielding lots of unnecessary
calculations. Nevertheless, fixing this problem would not be
enough to make its performance superior to the vectorized
approach. The RI is low.
(vi) As can be seen, the proposed technique (approach
6) is the fastest, confirming the effectiveness of such a strat-
egy. Additionally, the high RI makes it appropriate for longer
signals. In order to test the effect of splitting the signal into
frames, approach 6 was also tested with the entire signal at
once. This version spent, in average, twice the time required
using the frame division, confirming the effectiveness of this
action.
The implementation of the filterbank using approach
6 was also written in C. This version was compared with
an implementation based on the VIOL (vectorizing inner
and outer loops) appr oach presented in [19]. The proposed
strategy is almost 2.5 times faster than the VIOL-based im-
plementation. This means that the st rategy not only pro-
vides a significant speedup over nonvectorized codes, but
also presents a good performance compared with other FIR
filter vectorization approaches.
5.2.2. Recursive FIR filterbank
The signal used here is the same as the 20-second excerpt
used in the tests of the FIR filterbank (see Section 5.2.1). The
specifications of the filterbank used here are also the same
as that used in Section 5.2.1. The results for each approach
are shown in Ta ble 2, and the comments are presented in the
following.
In approach 1, the filtering was implemented using for-
loops instead of a vector-based approach, and the signal was
not divided into frames. As can be seen, the results were very
poor, since the parallelism of the processor was not explored
at all. Furthermore, the time demanded increases exponen-
tially with the length of the signal.
Approach 2 follows the same strategy of the first one, but
here the memory requirements are reduced by dividing the
signal into 96.000 sample frames. As a result, the time spent
dropped nearly 50%, and this reduction tends to increase
as longer signals are considered. Additionally, the time de-
manded increases almost linearly with the length of the sig-
nal. However, this strategy is still too slow.
Approach 3 is the one presented in Section 4.Thepro-
gram has run 26 times faster than the code implemented us-
ing the second approach, and its performance varies prac-
tically linearly with the length of the signal. These remarks
support the theoretical advantages of vectorization.
This last approach was also tested using a C code. In
this case, the proposed strategy was 3.2 times faster than the
VIOL-based implementation. This result is even better than
that one achieved for the regular FIR filterbank, confirming
the effectiveness of the vectorization approaches of FIR filter-
banks proposed in this paper.
6. CONCLUSION
A vectorized implementation of FIR filters, which is able to
explore the growing parallelism present in modern computer
processors, has been proposed. The technique has been pre-
sented in a generalized form, in such a way it can be extended
to a large number of different FIR filter architectures.
The performance of the proposed strategy was assessed
using codes written in both Matlab and C, and the results
were compared with nonvectorized codes and also with a
previous approach. In all cases, the proposed technique has
provided significant speedup.
ACKNOWLEDGMENT
Special thanks are extended to FAPESP for supporting this
work under Grants 01/04144-0 and 04/08281-0.
REFERENCES
[1] A. Edelman, P. McCorquodale, and S. Toledo, “The future
fast Fourier transform?” SIAM Journal on Scient i fic Comput-
ing, vol. 20, no. 3, pp. 1094–1114, 1999.
[2] M. Frigo and S. G. Johnson, “FFTW: an adaptive software ar-
chitecture for the FFT,” in Proceedings of IEEE International
Conference on Acoustics, Speech and Signal Processing (ICASSP
’98), vol. 3, pp. 1381–1384, Seattle, Wash, USA, May 1998.
[3] T. V. Thiede, Perceptual audio quality assessment using a non-
linear filter bank, Ph.D. thesis, Technical University of Berlin,
Berlin, Germany, 1999.
[4] M. Weinhardt and W. Luk, “Pipeline vectorization,” IEEE
Transactions on Computer-Aided Design of Integrated Circuits
and Systems, vol. 20, no. 2, pp. 234–248, 2001.
[5] T. Fahringer and B. Scholz, “A unified symbolic evaluation
framework for parallelizing compilers,” IEEE Transactions on
Parallel and Distributed Systems, vol. 11, no. 11, pp. 1105–
1125, 2000.
[6] W. Blume, R. Eigenmann, K. Faigin, et al., “Polaris: the next
generation in parallelizing compilers,” in Proceedings of the 7th
International Wor kshop in Languages and Compilers for Paral-
lel Computing (LCPC ’94), pp. 10.1–10.18, Ithaca, NY, USA,
August 1994.
[7] H. Zima and B. Chapman, Supercompilers for Parallel and Vec-
tor Computers, Addison-Wesley, New York, NY, USA, 1990.
[8] H. F. Silverman, “A high-quality digital filterbank for speech
recognition which runs in real time on a standard micropro-
cessor,” IEEE Transactions on Acoustics, Speech, and Signal Pro-
cessing, vol. 34, no. 5, pp. 1064–1073, 1986.
[9] D.W.RedmillandD.R.Bull,“DesignoflowcomplexityFIR
filters using genetic algorithms and directed graphs,” in Pro-
ceedings of the 2nd International Conference on Genetic Algo-
rithms in Engineering Systems: Innovations and Applications,
pp. 168–173, Glasgow, UK, September 1997.
[10] M. A. Soderstrand, L. G. Johnson, H. Arichanthiran, M. D.
Hoque, and R. Elangovan, “Reducing hardware requirement
in FIR filter design,” in Proceedings of IEEE International Con-
ference on Acoustics, Speech and Signal Processing (ICASSP ’00),
vol. 6, pp. 3275–3278, Istanbul, Turkey, June 2000.
10 EURASIP Journal on Advances in Signal Processing
[11]K H.Tan,W.F.Leong,S.Kadam,M.A.Soderstrand,and
L. G. Johnson, “Public-domain matlab program to generate
highly optimized VHDL for FPGA implementation,” in Pro -
ceedings of IEEE International Symposium on Circuits and Sys-
tems (ISCAS ’01), pp. 514–517, Sydney, Australia, May 2001.
[12] D. Br
¨
uckmann, “Optimized digital signal processing for flex-
ible receivers,” in Proceedings of IEEE International Conference
on Acoustics, Speech and Signal Processing (ICASSP ’02), vol. 4,
pp. 3764–3767, Orlando, Fla, USA, May 2002.
[13] F. Cruz-Rold
´
an and M. Monteagudo-Prim, “Efficient im-
plementation of nearly per fect reconstruction FIR cosine-
modulated filterbanks,” IEEE Transactions on Signal Processing,
vol. 52, no. 9, pp. 2661–2664, 2004.
[14] W. Sung and S. K. Mitra, “Implementation of digital filtering
algorithms using pipelined vector processors,” Proceedings of
the IEEE, vol. 75, no. 9, pp. 1293–1303, 1987.
[15] M. D. Meyer and D. P. Agrawal, “Vectorization of the DLMS
transversal adaptive filter,” IEEE Transactions on Signal Process-
ing, vol. 42, no. 11, pp. 3237–3240, 1994.
[16] D. Kim and G. Choe, “AMD’s 3DNow!
TM
vectorization for
signal processing applications,” in Proceedings of IEEE Inter-
national Conference on Acoustics, Speech, and Signal Process-
ing (ICASSP ’99), vol. 4, pp. 2127–2130, Phoenix, Ariz, USA,
March 1999.
[17] J. P. Robelly, G. Cichon, H. Seidel, and G. Fettweis, “Imple-
mentation of recursive digital filters into vector SIMD DSP ar-
chitectures,” in Proceedings of IEEE International Conference on
Acoustics, Speech and Signal Processing (ICASSP ’04), vol. 5, pp.
165–168, Montreal, Canada, May 2004.
[18] M. Van Der Horst, K. Van Berkel, J. Lukkien, and R. Mak,
“Recursive filtering on a vector DSP with linear speedup,” in
Proceedings of IEEE International Conference on Application-
Specific Systems, Architectures and Processors, pp. 379–386,
Samos, Greece, July 2005.
[19] A. Shahbahrami, B. H. H. Juurlink, and S. Vassiliadis, “Ef-
ficient vectorization of the FIR filter,” in Proceedings of the
16th Annual Workshop on Circuits, Systems and Signal Process-
ing (ProRisc ’05), pp. 432–437, Veldhoven, The Netherlands,
November 2005.
[20] J. G. A. Barbedo and A. Lopes, “A new cognitive model for ob-
jective assessment of audio quality,” Journal of the Audio Engi-
neering Society, vol. 53, no. 1-2, pp. 22–31, 2005.
[21] J. G. A. Barbedo and A. Lopes, “A new strategy for objective
estimation of the quality of audio signals,” IEEE Latin-America
Transactions, vol. 2, no. 3, 2004.
[22] ITU-R Recommendation BS-1387, “Method for Objective
Measurements of Perceived Audio Quality,” 1998.
[23] A. V. Oppenheim and R. W. Schafer, Discrete-Time Signal Pro-
cessing, Prentice Hall, Englewood Cliffs, NJ, USA, 1989.
Jayme Garcia Arnal Barbedo received the
B.S. degree in electrical engineering from
the Federal University of Mato Grosso do
Sul, Brazil, in 1998, and the M.S. and Ph.D.
degrees for research on the objective as-
sessment of speech and audio quality from
the State University of Campinas, Brazil, in
2001 and 2004, respectively. From 2004 to
2005 he worked with the Source Signals En-
coding Group of the Digital Television Di-
vision at the CPqD Telecom & IT Solutions, Campinas, Brazil.
Since 2005 he has been with the Department of Communications
of the School of Electrical and Computer Engineering of the State
University of Campinas as a Researcher, conducting postdoctoral
studies in the areas of content-based audio signal classification, au-
tomatic music transcription, and audio source separation. His in-
terests also include audio and video encoding applied to digital tele-
vision broadcasting and other digital signal processing areas.
Amauri Lopes received his B.S., M.S., and
Ph.D. degrees in electrical engineering from
the State University of Campinas, Brazil, in
1972, 1974, and 1982, respectively. He has
been with the Electrical and Computer En-
gineering School (FEEC) at the State Uni-
versity of Campinas since 1973, where he
has served as a Chairman in the Department
of Communications, Vice Dean of the Elec-
trical and Computer Engineering School,
and currently is a Professor. His teaching and research interests
include analog and digital signal processing, circuit theory, digital
communications, and stochastic processes. He has published over
100 refereed papers in some of these areas and over 30 technical
reports about the development of telecommunications equipment.