Báo cáo hóa học: " IEEE 802.11 Wireless LANs: Performance Analysis and Protocol Refinement" pot
Bạn đang xem bản rút gọn của tài liệu. Xem và tải ngay bản đầy đủ của tài liệu tại đây (682.29 KB, 12 trang )
EURASIP Journal on Applied Signal Processing 2005:1, 67–78
c
2005 Hindawi Publishing Corporation
IEEE 802.11 Wireless LANs: Performance Analysis
and Protocol Refinement
P. C ha tz im is io s
Multimedia Communications Research Group, School of Design, Engineering and Computing, Bournemouth University,
Fern Barrow, Poole, Dorset BH12 5BB, UK
Email:
A. C. Boucouvalas
Multimedia Communications Research Group, School of Design, Engineering and Computing, Bournemouth University,
Fern Barrow, Poole, Dorset BH12 5BB, UK
Email:
V. Vitsas
Information Technology Department, Technological Educational Institute of Thessaloniki, 54101 Thessaloniki, Greece
Email:
Received 25 February 2004; Revised 1 November 2004; Recommended for Publication by C. C. Ko
The IEEE 802.11 protocol is emerging as a w idely used standard and has become the most mature technology for wireless local
area networks (WLANs). In this paper, we focus on the tuning of the IEEE 802.11 protocol parameters taking into consideration,
in addition to throughput efficiency, performance metrics such as the average packet delay, the probability of a packet being
discarded when it reaches the maximum retransmission limit, the average time to drop a packet, and the packet interarrival time.
We present an analysis, which has been validated by simulation that is based on a Markov chain model commonly used in the
literature. We further study the improvement on these performance metrics by employing suitable protocol parameters according
to the specific communication needs of the IEEE 802.11 protocol for both basic access and RTS/CTS access schemes. We show that
the use of a higher initial contention window size does not considerably degrade performance in small networks and performs
significantly better in any other scenario. Moreover, we conclude that the combination of a lower maximum contention window
size and a higher retry limit considerably improves performance. Results indicate that the appropriate adjustment of the protocol
parameters enhances performance and improves the services that the IEEE 802.11 protocol provides to various communication
applications.
Keywords and phrases: IEEE 802.11, wireless LANs, DCF, packet delay, protocol tuning.
1. INTRODUCTION
During the past few years, the field of wireless local area net-
works (WLANs) has witnessed a massive development and
has become one of the fastest growing areas in telecommu-
nications and networking [1]. Continuing advances in wire-
less technology and mobile communications have equipped
portable devices with wireless capabilities that allow net-
worked communication even while a user is mobile. WLANs
have found widespread use and have become an essential tool
in many people’s professional and personal life. To satisfy the
This is an open-access article distributed under the Creative Commons
Attribution License, which per m its unrestricted use, distribution, and
reproduction in any medium, provided the original work is properly cited.
growing needs of wireless data networking, the IEEE working
group proposed the 802.11 protocol family [2].
The IEEE 802.11 protocols have become the domi-
nant standard for WLANs and can offer high data rates of
11 Mbit/s [3] and 54 Mbit/s [4]. The IEEE 802.11 standard
specifies two different medium access control (MAC) mech-
anisms for WLANs; the contention-based distributed coor-
dination function (DCF) and the polling-based point co-
ordination function (PCF). The mandatory DCF supports
asynchronous data transfer and best suits delay insensitive
data whereas the optional PCF provides time b ounded ser-
vices (TBS). DCF employs a carrier sense multiple access
with collision avoidance (CSMA/CA) access scheme using
binary exponential backoff. Under DCF, data packets are
transmitted through two access mechanisms, the basic access
68 EURASIP Journal on Wireless Communications and Networking
and the request-to-send/clear-to-send (RTS/CTS) reserva-
tion scheme.
Many research efforts have been conducted on model-
ing the performance of DCF since the standardization of
IEEE 802.11 MAC. Bianchi in [5]andWuetal.in[6]use
Markov chain models to analyze the throughput of 802.11
protocol. In particular, Bianchi assumes that packet retrans-
missions are unlimited and that a packet is being transmit-
ted continuously until its successful reception. Wu in [6]
extends Bianchi’s analysis to include the finite packet retry
limits as defined in the IEEE 802.11 standard [2]. In [7],
we provide a new performance analysis of the 802.11 proto-
col, which is based on the extensively-used-in-the-literature
Markov chain model of [6] and allows the calculation of
the packet delay, the packet drop probability, and the packet
drop time. Ziouva in [8] develops a Markov chain model
that introduces an additional transition state to the models
of [5, 6, 7] and actually allows stations to t ransmit consecu-
tive packets without activating the backoff procedure.
1
This
feature, which is not specified in any IEEE 802.11 standard,
causes an unfair use of the medium since stations are not
treated in the same way after a successful transmission. The
proposed model in [8] lacks of any validation using simula-
tion results and the calculation of average packet delay uti-
lizes a very complicated approach since it calculates the aver-
age number of the collisions of a packet before its successful
reception and the average time a station’s backoff timer re-
mains stopped.
Several other papers in the literature [9, 10, 11]have
attempted to improve IEEE 802.11 performance by either
modifying the backoff mechanism or by fine-tuning certain
protocol parameters. Carvalho and Garcia-Luna-Aceves in
[9] considered the impact of the minimum contention win-
dow (CW) size and the corresponding capacity improvement
that is achieved when CW increases but not combined with
packet retry limits and other protocol parameters. Cali et
al. in [10] proposes a method of estimating the number of
active stations via the number of empty slots and exploits
the estimated value to tune the CW parameter based on a
p-persistent version of the IEEE 802.11 protocol. Aad and
Castelluccia in [11] suggests three different ways to enhance
802.11 performance; by scaling the CW based on the priority
factor of each station or by giving each priority level with a
different value of DIFS or different maximum packet length.
In this paper, we concentrate on the performance en-
hancement of IEEE 802.11 DCF by simply modifying specific
protocol parameter values. In order to adjust the protocol pa-
rameters, the mathematical description of the system turns
out to be extremely helpful in observing the effect on the
considered performance metrics of any parameter changes
made. Our work reports and explores several performance
metrics such as the average packet delay, the packet drop
probability, the average time to drop a packet, the packet in-
1
According to the authors of [8], this takes place when a station detects
that its previous transmitted packet was successfully received and the chan-
nel is idle.
terarrival time, and the throughput efficiency. OPNET simu-
lation results validate the accuracy of our performance analy-
sis. Moreover, a performance comparison of (a) the proposed
delay analysis in [8], (b) our validated delay analysis, and
(c) simulation results, demonstrates that the analysis based
on Wu’s model, which takes into account packet retry lim-
its, predicts very accurately DCF packet delay performance.
We then propose a simple-to-implement appropriate tuning
of the backoff algorithm for the basic access scheme (the con-
clusions are also applicable to the RTS/CTS scheme) depend-
ing on the specific communication requirements. The pro-
posed fine-tuning does not depend on the employed access
scheme or the packet size and aims to improve the services
that the protocol provides to higher layers of the communi-
cation protocol stack.
2. DISTRIBUTED COORDINATION FUNCTION
In DCF basic access mode, a station with a packet to transmit
monitors the medium activity. If the medium is idle, the sta-
tion t ransmits the data packet. If the medium is sensed busy,
the station waits until the medium becomes idle for more
than a distributed interframe space (DIFS) time interval. The
station then defers transmission for a randomly selected in-
terval in order to minimize collisions and transmits the data
packet. A station that receives a data packet replies by a posi-
tive acknowledgement packet (ACK) after a short interframe
space (SIFS) interval. If the source station does not receive
an ACK, the data packet is assumed to have been lost and a
retransmission is scheduled. Each station maintains a station
short retry count (SSRC) that has an initial value of zero for
every new packet. The short retry count indicates the max-
imum number of retransmission attempts of a data packet
when the basic access scheme is utilized.
In IEEE 802.11, a station waits a random backoff inter-
val before initiating a packet transmission. The backoff timer
value for each station is uniformly chosen in the interval
[0, W
i
− 1] where W
i
is the current CW size and i is the
backoff stage. The backoff timer is decremented when the
medium is idle, is frozen when the medium is sensed busy,
and resumes only after the medium has been idle for longer
than DIFS. A station initiates a packet transmission when the
backoff timer reaches zero. The value of W
i
depends on the
number of failed transmissions of a packet; at the first trans-
mission attempt, W
0
= CW
min
= W. After each retransmis-
sion due to a packet collision, W
i
isdoubleduptoamaxi-
mum value, W
m
= CW
max
= W2
m
,wherem
is the number
of backoff stages. Once W
i
reaches CW
max
,itwillremainat
this value until it is reset to CW
min
in the following cases: (a)
after the successful transmission of a data packet or (b) when
SSRC reaches the short retry limit. When the short retry limit
is reached, retry attempts will cease and the packet will be dis-
carded. The SSRC is reset to 0 whenever an ACK is received
in response to a data packet.
3. MATHEMATICAL MODELING
In this paper, we assume that the network consists of n
contending stations and each station always has a packet
IEEE 802.11 Performance Analysis 69
b(t)changes
backoff timer changes
s(t)changes
CW changes
0, 0 0, 1 0, 2 0, W
0
− 20,W
0
− 1
1 − p
1111 1
···
.
.
.
.
.
.
.
.
.
.
.
.
p/W
1
.
.
.
.
.
.
i,0 i,1 i,2
i, W
i
− 2 i, W
i
− 1
···
1 − p
1 − p
111 1 1
i +1,0
1
i +1,1 i +1,2
i +1,W
i+1
− 2 i +1,W
i+1
− 1
1111 1 1
m,0
111 1
m,1 m,2
m, W
m
− 2 m, W
m
− 1
··· ···
p/W
i+1
.
.
.
.
.
.
.
.
.
.
.
.
.
.
.
.
.
.
.
.
.
p/W
m
··· ···
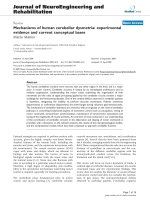
Figure 1: Markov chain model.
available for transmission. The main assumption of our
model is that the collision probability of a data packet trans-
mission is constant and independent of the number of colli-
sions the packet has suffered in the past.
Let b(t)ands(t) be the stochastic processes represent-
ing the backoff timer and the backoff stage, respectively,
for a given station at slot time t. T he discrete-time Markov
chain illustrated in Figure 1 is employed to model the bi-
dimensional process {b(t), s(t)}.Letb
i,k
= lim
t→∞
P{s(t) =
i, b(t) = k} be the stationary distribution of the Markov
chain denoting the probability of a station to be in state (i, k),
where i ∈ [0, m], k ∈ [0, W
i
− 1], and m is the station retry
limit. By considering that b
i,0
= pb
i−1,0
, i ∈ (0, m], we have
the following relation for b
i,0
:
b
i,0
= p
i
b
0,0
,0<i≤ m. (1)
Following the same reasoning with [6, 7]andbymeans
of the above Markov chain model, the probability τ that a
station transmits a packet in a randomly chosen slot t ime is
presented by (we consider the case of m>m
, which is usu-
ally the case)
τ =
2(1 − 2p)
1 − p
m+1
W
1 − (2p)
m
+1
(1 − p)+(1− 2p)
W2
m
p
m
+1
1 − p
m−m
+1− p
m+1
. (2)
The probability p that a transmitted packet encounters
a collision is the probability that at least one of the n − 1
remaining stations transmits in the same slot time. If all sta-
tions transmit with probability τ, the conditional collision
probability p is given by
p = 1 − (1 − τ)
n−1
. (3)
Equations (2)and(3) form a nonlinear system with two
unknowns τ and p. This nonlinear system can be solved
utilizing numerical methods and has a unique solution.
2
4. PERFORMANCE ANALYSIS
Our performance analysis, as already shown in the previ-
ous section, includes the effect of packet retry limits and
2
The full proof as well as additional details for the derived analysis can
be found in the appendix.
70 EURASIP Journal on Wireless Communications and Networking
considers the following metrics, which are good indicators
for the performance of IEEE 802.11 WLANs. We consider
throughput efficiency, average packet delay, probability of a
packet being discarded when it reaches the maximum re-
transmission limit, the average time to drop a packet, and
packet interarrival time.
4.1. Saturation throughput
Let P
tr
be the probability that at least one station transmits
a packet in a randomly selected slot time and P
s
the proba-
bility that an occurring packet transmission is successful. For
awirelessLANofn contending stations, the probabilities P
tr
and P
s
are given by
P
tr
= 1 − (1 − τ)
n
,
P
s
=
nτ(1 − τ)
n−1
1 − (1 − τ)
n
.
(4)
Considering that a random slot is empty with probability
(1 − P
tr
) contains a successful transmission with probability
P
tr
P
s
and a collision with probability P
tr
(1 − P
s
), the satura-
tion throughput S is given by
S =
P
tr
P
s
l
E[slot]
=
P
tr
P
s
l
1 − P
tr
σ + P
tr
P
s
T
s
+ P
tr
1 − P
s
T
c
,(5)
where E[slot] is the average length of a slot time, l is the
length of the transmitted packet, σ is the duration of an
empty slot, T
s
and T
c
are the average durations the medium is
sensed busy due to a successful transmission and a collision,
respectively. We have
T
s
= DIFS +T
header
+ T
DA T A
+ δ + SIFS +T
ACK
+ δ. (6)
In order to explicitly specify the value of the time in-
terval T
c
, we have to categorize stations in two groups: the
listening (noncolliding) and the colliding stations. In the
case of the “listening” stations, a packet collision w ill re-
sult in an error reported by the PHY (by utilizing the PHY-
RXEND.indication) and the time interval T
c
for those sta-
tions is equal to an extended interframe space (EIFS) after
the packet transmission. For the “colliding” stations the time
interval T
c
is equal to an ACK Timeout following the packet
transmission. As it is specified in the IEEE 802.11 standard
[2], the ACK Timeout is equal to EIFS (almost equal since
the latter is shorter by a slot time). Thus, the values of T
s
and
T
c
, which both depend on the medium access mechanism, in
the case of basic access are
T
s
= T
c
= DIFS +T
header
+ T
DA T A
+ δ + SIFS +T
ACK
+ δ,
(7)
where T
header
is the time required to transmit the MAC and
the physical packet header, T
DA T A
= l/C is the time required
to transmit the packet data payload of l bits, when C is the
data rate, T
ACK
= l
ACK
/C
control
is the time required to trans-
mit the ACK packet of l
ACK
bits, C
control
is the control (base)
rateatwhichtheACKpacketissentandδ is the propagation
delay.
4.2. Packet drop probability
The packet drop probability is defined as the probability that
a packet is dropped when the retry limit is reached. A packet
is found in the last backoff stage m if it encounters m colli-
sions in the previous stages and it will be discarded if it expe-
riences another collision. Therefore, packet drop probability
can be expressed as a function of the last backoff stage (by
means of (1)) and the collision probability p as
3
p
drop
=
b
m,0
b
0,0
p = p
m
p = p
m+1
. (8)
4.3. Average packet delay
The delay D for a successfully transmitted packet is defined
to be the time interval from the time the packet is at the head
of its MAC queue ready for transmission, until an acknowl-
edgementforthispacketisreceived.Ifapacketisdropped
because it has reached the specified retry limit, the time de-
lay for this packet will not be included in the calculation of
the average packet delay since this packet is not successfully
received.
The average packet delay E[D]isgivenby
E[D] = E[X]E[slot], (9)
where E[X] is the average number of slot times required for
a successful packet transmission and can be found by mul-
tiplying the number of slot times d
i
the packet is delayed in
each backoff stage by the probability q
i
for the packet to uti-
lize this backoff stage:
E[X] =
m
i=0
d
i
q
i
. (10)
The average number of slot times d
i
a station utilizes in
the i stage (including the transmission slot) is given by
d
i
=
W
i
+1
2
, i ∈ [0, m]. (11)
The probability q
i
that a packet reaches the i backoff
stage, provided that this packet is not discarded, is given by
q
i
=
p
i
− p
m+1
1 − p
m+1
, i ∈ [0, m] (12)
since packets that are not dropped (with probability 1− p
m+1
)
arrive at the i stage with probability (p
i
− p
m+1
)(wehave
to deduct the probability p
m+1
of dropped packets from the
probability p
i
of the total number of packets arriving at the i
stage).
Combining (10), (11), and (12), E[X]isgivenby
E[X] =
m
i=0
p
i
− p
m+1
W
i
+1
/2
1 − p
m+1
. (13)
3
Note that the packet drop probability is independent of the employed
access scheme (basic access or RTS/CTS).
IEEE 802.11 Performance Analysis 71
4.4. Average time to drop a packet
A packet is dropped when it reaches the last backoff stage
and experiences another collision. The average time to drop
apacketisequalto
E
D
drop
= E
X
drop
E[slot], (14)
where E[X
drop
] is the average number of slot times required
for a packet to experience m + 1 collisions in the (0, 1, , m)
stages. Given that the average number of slot times a station
defers in the i stage is (W
i
+1)/2, then E[X
drop
]isgivenby
E
X
drop
=
m
i=0
W
i
+1
2
=
W
2
m
+1
−1
+W2
m
(m − m
)+(m+1)
2
.
(15)
4.5. Packet interarrival time
The packet interarrival time is defined as the time interval
between two successful packet receptions at the receiver and
can be simply obtained from throughput:
E
D
inter
=
l
S/n
. (16)
Using the same reasoning with (9), the packet interarrival
time E[D
inter
] is also given by
E
D
inter
=
∞
j=0
p
j(m+1)
m
i=0
p
i
W
i
+1
2
E[slot], (17)
which after some algebra reaches (16).
Intuitively, the average packet delay, interarrival time,
and drop time are related by
E[D] = E
D
inter
−
p
drop
1 − p
drop
E
D
drop
, (18)
where E[D
inter
]isgivenby(16)or(17), p
drop
is given by
(8), and E[D
drop
]isgivenby(14). The expression p
drop
/(1 −
p
drop
) = p
m+1
/(1 − p
m+1
) represents the average number of
dropped packets needed for a successful transmission. The
expression in (18) is of key importance since it g ives insights
of the delay characteristics of the IEEE 802.11 backoff mech-
anism and relates the average packet delay with the packet
interarrival time, the packet drop probability, and the aver-
age time to drop a packet.
5. MODEL VALIDATION
The mathematical analysis presented in this paper is vali-
dated by comparing analytical with simulation results ob-
tained using our IEEE 802.11 simulator. This IEEE 802.11
simulator is developed using the OPNET modeler communi-
cation networks modeling and simulation software package.
OPNET modeler is an event-driven simulator and provides
a powerful graphical tool to display simulation statistics.
In fact, our OPNET 802.11 simulator emulates the real op-
eration of a wireless station as closely as possible, by imple-
menting the collision avoidance procedures and all param-
eters such as packet transmission times, propagation delays,
turnaround times, and so forth. The simulator closely fol-
lows all timer values and packet element transmission times
defined by IEEE 802.11 specifications. Furthermore, we have
suitably modified the model of the IEEE 802.11 wireless sta-
tion provided in the standard library of OPNET in order to
employ saturation conditions, that is, all stations always have
a packet ready for transmission.
The Markov chain analysis presented in the previous sec-
tions is independent of physical layer parameters and can be
applied to all IEEE 802.11 PHY standards. The parameters
used in both the analytical model and our simulations fol-
low the parameters in [6, 7] and are summarized in Table 1.
The system parameter values are those specified for the di-
rect spread sequence spectrum (DSSS) physical layer utilized
in IEEE 802.11b [3].
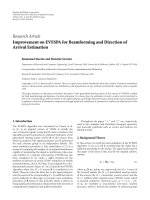
Figures 2 and 3 confirm the accuracy of the considered
assumptions in the mathematical analysis.
4
The figures pro-
vide performance results (throughput efficiency, packet de-
lay, packet drop time, and packet drop probability) versus
the number of contending stations. Figure 2 depicts an al-
most exact match observed between analytical results (lines)
and simulation outcome (symbols) illustr a ting that the an-
alytical model that considers retry limits predicts very ac-
curately DCF throughput performance, a conclusion not
clearly drawn in [6] which added packet retry limits in the
analytical model in [5]. Figure 2 also displays packet de-
lay calculated using our delay analysis as well as Ziouva’s
model [8] against OPNET simulation results. The perfor-
mance comparison shows that our packet delay analysis gives
results in high agreement with OPNET simulations. We can
observe that the model in [8],whichislessconformantto
the IEEE 802.11 standard than our model, causes a high
overestimation of packet delay due to the adoption of the
additional transition state and the absence of packet retry
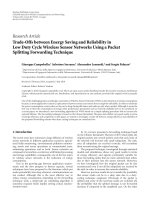
limits. Figure 3 also validates our analysis for the other two
considered performance metrics: packet drop time and drop
probability.
6. TUNING OF PROTOCOL PARAMETERS
AND PERFORMANCE RESULTS
There are a variety of performance requirements according to
the various communication needs or application desires. For
example, time bounded applications that exchange query-
like messages, require low packet loss and low delivery delay.
Conversely, applications that provide delay insensitive ser-
vices (i.e., email, ftp) are not concerned much with packet
timely deliverance and maximising throughput performance
is of prime importance in this case. Additionally, there are
many applications that lie somew h ere in the middle and may
4
Note that simulation results are acquired with a 95% confidence interval
lower than 0.002
72 EURASIP Journal on Wireless Communications and Networking
Table 1: DSSS system parameters in IEEE 802.11b.
Parameter Value Parameter Value
Slot time, σ 20 µs Packet payload, l 1023 or 1500 bytes
MAC header, l
MAC
272 bits DIFS 50 µs
PHY header, l
PHY
192 bits SIFS 10 µs
Data header time, T
header
(l
PHY
+ l
MAC
)/C
control
Minimum CW, W
0
32
ACK packet, l
ACK
112 bits + l
PHY
Number of CW sizes, m
5
Channel bit rate, C 11 Mbit/s Short retry limit, m 6
Control rate, C
control
1 Mbit/s Propagation delay, δ 1 µs
0.85
0.8
0.75
0.7
0.65
0.6
0.55
5 10152025303540455055606570
Number of stations
Throughput efficiency
Delay, no retry limits, (Bianchi)
Delay, m = 6, (Wu)
Delay, (OPNET simulation)
Delay, (Ziouva in [8])
Throughput, no retry limits, (Bianchi)
Throughput, m = 6, (Wu)
Throughput, (OPNET simulation)
2
1.8
1.6
1.4
1.2
1
0.8
0.6
0.4
0.2
0
Packet delay (s)
Packet
delay
Figure 2: Throughput efficiency and packet delay: analysis versus simulation (l = 1023 bytes).
9
8
7
6
5
4
3
2
1
0
5 10152025303540455055606570
Number of stations
Packet drop time (s)
Drop time, basic access (simulation)
Drop probability (simulation)
Drop time, basic access (analysis)
Drop probability (analysis)
0.04
0.035
0.03
0.025
0.02
0.015
0.01
0.005
0
Packet drop probability
Drop time
Figure 3: Packet drop time and packet drop probability: analysis versus simulation (l = 1023 bytes).
demand low delivery delay but will not be sensitive to some
loss of packets or may demand low loss but not small delay.
For example, multimedia applications are not able to tolerate
high delay or jitter but may tolerate some packet loss whereas
HTTP-like applications can tolerate delay but require mini-
mum data loss.
IEEE 802.11 Performance Analysis 73
Table 2: Packet delay and throughput efficiency for a small network size (l = 1500 bytes).
Number of stations
IEEE 802.11 standard
W = 64, m = 6, m
= 5
W = 32, m = 6, m
= 5
Packet delay (s) Throughput efficiency Packet delay (s) Throughput efficiency
n = 2 0.003779 0.577334 0.004049 0.538847
n = 3 0.005664 0.577849 0.005843 0.560091
n = 4 0.007624 0.572318 0.007683 0.567978
n
= 5 0.009647 0.565203 0.009564 0.570292
n = 6 0.011722 0.557878 0.011485 0.569902
In order to fulfil specific communication needs, we pro-
pose the adjustment of certain protocol parameters to differ-
ent values than those proposed by the IEEE standard. Three
parameters are b eing examined: the initial contention size
(W), the packet retry limit (m), and the number of back-
off stages (m
). Our performance analysis examines the fol-
lowing metrics as good indicators for the performance of the
IEEE 802.11 protocol, namely, the throughput efficiency, the
average packet delay, the packet drop probability as well as
the average time to drop a packet.
By employing the analytical model presented previously,
varioussetsofprotocolparametervalueshavebeenexam-
ined and compared with parameter values that the IEEE
802.11 standard proposes in order to identify potential im-
provements on protocol performance. After an extensive
performance study, we have identified three sets of pa-
rameter values. Each set of parameter values achieves bet-
ter performance on some particular metrics and it can be
employed according to the specific communication needs.
For example, one set of parameter values can signifi-
cantly improve the throughput efficiency whereas another
combination of parameters can considerably reduce the
packet drop probability or the packet drop time.
The following three sets of parameter values that are be-
ing employed for the basic access scheme, for the case of
“long” packets of l = 1500 bytes
5
and compared with the val-
ues that the IEEE 802.11 protocol proposes (W = 32, m = 6,
m
= 5) are
(a) W = 64, m = 5, m
= 4,
(b) W = 64, m = 5, m
= 3,
(c) W = 64, m = 7, m
= 3.
In all considered cases, we increase the value of W to re-
duce the number of collisions. In the first case, the CW
max
value that the standard proposes (CW
max
= 1024) is utilized
by decreasing m
to 4; a lower retry limit (m = 5) is consid-
ered sufficient since increasing W to 64 reduces the collision
probability. In the second set, we study the effect of reducing
CW
max
to 512 by decreasing m
to 3; this set is ex pected to
5
Results for the RTS/CTS scheme and other packet sizes such as “short”
VoIP packets of l = 200 bytes have reached exactly the same conclusions,
denoting that the proposed improvement does not depend on the employed
access scheme or the packet payload size.
0.03
0.025
0.02
0.015
0.01
0.005
0
5 10152025303540455055606570
Number of stations
Packet drop probability
W = 32, m = 6, m
= 5
W = 64, m = 5, m
= 3
W = 64, m = 5, m
= 4
W = 64, m = 7, m
= 3
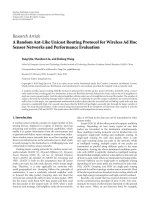
Figure 4: Packet drop probability against number of stations (l =
1500 bytes).
improve the average packet delay. Finally, in the last set, the
retr y limit is increased to the value of 7. As a result, a con-
tending station utilizes two more times the (relatively) small
last backoff stage (CW
max
= 512) aiming to reduce the packet
drop probability while keeping a fairly low packet delay.
At a first glance, it might seem that the choice of a higher
value for the initial CW size (W = 64) comparing to the
value of the standard (W = 32) will cause a performance
decrease in a small network scenario. A closer study to the
case of a small network size (2 ≤ n ≤ 6) was performed and
Table 2 presents the packet delay and throughput efficiency
for the two different values of the initial contention window
W. The table illustrates that the adjustment of W to a higher
value does not cause a considerable effect on both the packet
delay and throughput efficiency for very small networks; on
the contrary performance is improved in networks with five
or more contending stations.
The efficiency of each set of parameter values on the
packet drop probability is explored in Figure 4 against the
number of contending stations. When the standard proposed
valuesareemployed,apacketsuffers the highest drop prob-
ability comparing to the other three cases. The choice of a
higher W value improves the drop probability since fewer
74 EURASIP Journal on Wireless Communications and Networking
0.18
0.16
0.14
0.12
0.1
0.08
0.06
0.04
0.02
0
5 10152025303540455055606570
Number of stations
Packet delay (s)
W = 32, m = 6, m
= 5
W = 64, m = 5, m
= 3
W = 64, m = 5, m
= 4
W = 64, m = 7, m
= 3
Figure 5: Packet delay against number of stations (l = 1500 bytes).
collisions are taking place. When W = 64, m = 5, m
= 3are
employed, the packet drop probability increases rapidly and
gradually attains the same value with the standard proposed
values in a large network scenario (n = 70). This is justified
by noting that employing W = 64 and m
= 3, the maximum
value of the CW size will be lower (CW
max
= 512) compared
to the one that the IEEE standard proposes (CW
max
= 1024)
resulting in an increased number of collisions when the num-
ber of contending stations is high. The lowest packet drop
probability is achieved when W = 64, m = 7, and m
= 3
since the packet drop probability is reduced up to 75% com-
pared to the IEEE standard proposed values despite of the
decrease of CW
max
.
Figure 5 depicts that the packet delay increases when the
network size grows in all cases due to the higher number of
collisions. The figure also shows that the packet delay is not
significantly affected by the employment of different param-
eter values. The only exception is when W = 64, m = 7,
m
= 3, the packet delay increases faster than in the other
cases when n>35 and a packet experiences an increase
on delay of up to 10% in a large network (n = 70). How-
ever, by means of Figure 4 the situation is easily explained
since a larger number of packets are transmitted successfully
and not discarded. The small increase of the packet delay is
the small price we pay for significantly decreasing the packet
drop probability.
Figure 6 plots the average time to drop a packet when it
reaches the maximum retransmission limit against the num-
ber of contending stations. For all sets of parameter values,
the packet drop time increases when the network size in-
creases. The figure shows that the employment of any of the
considered sets of parameter values, as compared to the IEEE
standard parameters, results in a significant improvement on
the packet drop time. The highest packet drop time is at-
tained using the parameter values suggested in the standard,
whereas the case of W = 64, m = 5, m
= 3 achieves the
lowest packet drop time with a reduction of about 40% for a
large network size (n = 70).
1.8
1.6
1.4
1.2
1
0.8
0.6
0.4
0.2
0
5 10152025303540455055606570
Number of stations
Packet drop time (s)
W = 32, m = 6, m
= 5
W = 64, m = 5, m
= 3
W = 64, m = 5, m
= 4
W = 64, m = 7, m
= 3
Figure 6: Packet drop time against number of stations (l = 1500
bytes).
0.6
0.5
0.4
0.3
0.2
0.1
0
5 10152025303540455055606570
Number of stations
Throughput efficiency
W = 32, m = 6, m
= 5
W = 64, m = 5, m
= 3
W = 64, m = 5, m
= 4
W = 64, m = 7, m
= 3
Figure 7: Throughput efficiency against number of stations (l =
1500 bytes).
Figure 7 examines the throughput efficiency that each
considered set of parameter values achieves with varying the
number of contending stations. When any of the proposed
value sets is employed, the achiev able throughput efficiency
is higher compared to the standard parameter values mainly
because the larger W value decreases the number of colli-
sions. Especially when W = 64, m = 5, m
= 4, the increase
on throughput can be up to 10% compared to the case when
the standard parameter values are employed.
Finally, Figure 8 studies packet interarrival time, which is
defined as the time interval between two successful packet re-
ceptions at the receiver. As expected, packet interarrival time
for the standard para meter v alues is considerably higher than
any other case. This can be easily justified by noting that
packet interarrival time also includes the time for packets
that have been discarded; this time is much greater for the
case of W = 32, m = 6, m
= 5 due to the high drop proba-
bility values (Figure 4).
IEEE 802.11 Performance Analysis 75
0.2
0.18
0.16
0.14
0.12
0.1
0.08
0.06
0.04
0.02
0
5 10152025303540455055606570
Number of stations
Interarrival time (s)
W = 32, m = 6, m
= 5
W
= 64, m = 5, m
= 3
W = 64, m = 5, m
= 4
W = 64, m = 7, m
= 3
Figure 8: Packet interarrival time against number of stations (l =
1500 bytes).
Performance results reported in the previous figures
show that when (W = 64, m = 5, m
= 4), lower packet
drop probability, packet drop time, packet interarrival time,
and better throughput performance are achieved compared
to the values proposed by the standard. When the CW
max
is
decreased to a lower value (CW
max
= 512) for the same retry
limit (m = 5), we attain the lowest packet drop time com-
pared to any other case but the drop probability increases
considerably. On the contrary, the adjustment of the retry
limit to a higher value (W = 64, m = 7, m
= 3) results in the
lowest packet drop probability and a small increase of packet
drop time and delay due to the larger number of packets not
being discarded and transmitted successfully. Each combi-
nation of parameters achieves an improved performance on
some specific metrics compared to the standard proposed
values and the choice of which set of protocol parameters
should be employed depends on the specific communication
requirements.
7. CONCLUSIONS
In this paper, we have focused on the performance enhance-
ment of the IEEE 802.11 MAC protocol using several perfor-
mance metrics such as the average packet delay, the packet
drop probability, the average time to drop a packet, the
packet interarrival t ime, and the throughput efficiency. Per-
formance results obtained from our analysis fully agree with
OPNET simulations confirming the improvements in accu-
racy when retry limits are considered. We a lso compared
throughput and delay results for different models presented
in the literature. With the infinite retry limit model [5], per-
formance results deviate from simulations as the number
of contending stations increases. Moreover, for the model
[8]basedonadifferent operational mode of IEEE 802.11
MAC results revealed that it overestimates packet delay p er-
formance.
We have also examined the effect of the initial con-
tention window size on performance by employing a higher
value (W = 64) compared to the standard proposed value
(W = 32). Results indicate that this adjustment does not
considerably degrade performance in very small WLANs but
improves performance in networks with five or more con-
tending stations. Based on performance results for the ba-
sic access scheme (the same conclusions are derived for the
RTS/CTS scheme), we have proposed an appropriate tun-
ing of the backoff algorithm to improve the services that
the IEEE 802.11 protocol provides. We have shown that the
high value of CW
max
that the IEEE standard has proposed
couldbesafelyloweredandwhencombinedwithahigher
retr y limit, then the performance can be improved. Finally,
we have proposed three sets of parameter values for initial
contention window size, retry limit, and number of backoff
stages and we have concluded that each proposed set achieves
better performance on particular metrics and it could be em-
ployed to match specific communication needs.
APPENDIX
Let b
i,k
= lim
t→∞
P{s(t) = i, b(t) = k} be the station-
ary distribution of this Markov chain, where i ∈ [0, m],
k ∈ [0, W
i
−1]. Based on the two-dimensional Markov chain
illustrated in Figure 1 and by considering that b
1,0
= p · b
0,0
and b
2,0
= p · b
1,0
= p
2
· b
0,0
, we have the following relation
for b
i,0
:
b
i,0
= pb
i−1,0
= p
i
b
0,0
,0<i≤ m. (A.1)
Owing to chain regularities and by means of equation
(A.1), all b
i,k
valuesareexpressedasafunctionofb
0,0
and
p as
b
i,k
=
W
i
− k
W
i
· b
i,0
,0≤ i ≤ m,0≤ k ≤ W
i
− 1. (A.2)
Applying the normalization condition for this stationary dis-
tribution
1 =
m
i=0
W
i
−1
k=0
b
i,k
=
m
i=0
b
i,0
·
W
i
−1
k=0
W
i
− k
W
i
=
m
i=0
b
i,0
·
W
i
+1
2
=
m
i=0
p
i
· b
0,0
·
W
i
+1
2
=
b
0,0
2
·
m
i=0
p
i
· W
i
+
m
i=0
p
i
,
(A.3)
from which
b
0,0
=
2
m
i=0
p
i
· W
i
+
m
i=0
p
i
,(A.4)
and after some algebra,
76 EURASIP Journal on Wireless Communications and Networking
b
0,0
=
2(1 − 2p)(1 − p)
W
1 − (2p)
m
+1
(1 − p)+(1− 2p)
W2
m
p
m
+1
1 − p
m−m
+1− p
m+1
. (A.5)
By utilizing the Markov chain model, the probability τ
that a station transmits a packet in a randomly chosen slot
time is equal to
τ =
m
i=o
b
i,0
=
m
i=o
p
i
· b
0,0
= b
0,0
·
1 − p
m+1
(1 − p)
(A.6)
and b
0,0
can be acquired from (A.5). From (A.6), we observe
that the transmission probability τ depends on the condi-
tional probability p, which is defined as the probability that
a transmitted packet collides and is given by
p = 1 − (1 − τ)
n−1
. (A.7)
As we stated before, (A.6)and(A.7) represent a nonlinear
system with two unknowns τ and p. This nonlinear system,
which has a unique solution, can be solved utilizing numer-
ical methods evaluating t and p for a certain W, m,andm
combination. Since the system of the two equations is differ-
ent from the one in [5], a detailed proof of the uniqueness of
thissolutionisderivednext.
Equation (A.7)canberewrittenas
τ
∗
(p):τ = 1 − (1 − p)
1/(n−1)
. (A.8)
The function τ
∗
(p) is a continuous and monotone in-
creasing function in the range p ∈ (0, 1). It increases from
τ
∗
(0) = 0toτ
∗
(1) = 1. Function τ(p)givenby(A.6) is also
continuous in the same range;
6
continuity in correspondence
of the critical value p = 1/2 is simply proven by using (A.5)
as follows:
b
0,0
=
2
m
i=0
1/2)
i
W
i
+
m
i=0
(1/2)
i
,
=
2
m
i=0
(1/2)
i
2
i
W
+
m
i=m
+1
(1/2)
i
2
m
· W
+
1 − (1/2)
m+1
/(1 − 1/2)
=
2
m
i=0
W +
2
m
· W
m
i=m
+1
(1/2)
i
+
1 − (1/2)
m+1
/(1/2)
=
2
W(m
+1)+
2
m
· W
1 − (1/2)
m−m
/(1 − 1/2)
(1/2)
m
+1
+
1 − (1/2)
m+1
/(1/2)
=
2
W(m
+1)+W
2
m−m
− 1
2
m−m
/(1/2)
(1/2) +
2
m+1
− 1
/2
m+1
/(1/2)
=
2
W(m
+1)+W
2
m−m
− 1
/2
m−m
+
2
m+1
− 1
/2
m
.
(A.9)
Therefore, when p = 1/2, (A.6)becomes
τ
1
2
=
m
i=o
b
i,0
=
m
i=o
1
2
i
b
0,0
=
2
m+1
− 1
2
m
b
0,0
=
2
m+1
− 1
2
m−1
W(m
+1)+W
2
m−m
− 1
/2
m−m
+
2
m+1
− 1
/2
m
.
(A.10)
IEEE 802.11 Performance Analysis 77
Moreover, when p = 1andbymeansof(A.5), we have
b
0,0
=
2
m
i=0
W
i
+
m
i=0
1
i
=
2
m
i=0
2
i
· W
+
m
i=m
+1
2
m
· W
+(m +1)
=
2
m
i=0
2
i
· W
+2
m
· W(m − m
)+(m +1)
=
2
W
1 − 2
m
+1
/(1 − 2)
+2
m
W(m − m
)+(m +1)
=
2
W
2
m
+1
− 1
+2
m
W(m − m
)+(m +1)
.
(A.11)
Therefore, when p = 1, (A.6)becomes
τ(1) =
m
i=0
b
i,0
=
m
i=0
b
0,0
= (m +1)b
0,0
=
2(m +1)
W
2
m
+1
− 1
+2
m
W(m − m
)+(m +1)
.
(A.12)
Function τ(p) is continuous and monotone decreasing in the
range p ∈ (0, 1) since it decreases from τ(0) = 2/(W +1)to
τ(1) given by (A.12). Uniqueness of the solution is proven by
considering that τ(0) >τ
∗
(0) and τ(1) <τ
∗
(1).
ACKNOWLEDGMENT
The authors would like to thank Professor Giuseppe Bianchi
at the University of Roma Tor Vergata for useful discussions
and for his valuable comments that helped to improve the
quality and readability of this paper.
REFERENCES
[1] R. van Nee, G. Awater, M. Morikura, H. Takanashi, M. Web-
ster, and K. W. Halford, “New high-rate wireless LAN stan-
dards,” IEEE Commun. Mag., vol. 37, no. 12, pp. 82–88, 1999.
[2] ISO/IEC, “IEEE standard for wireless LAN medium ac-
cess control (MAC) and physical layer (PHY) specifications,”
ISO/IEC 8802-11:1999(E), 1999.
[3] IEEE, “IEEE standard for w ireless LAN medium access con-
trol (MAC) and physical Layer (PHY) specification: higher-
speed physical layer extension in the 2.4 GHz band,” IEEE
802.11b, 1999.
[4] IEEE, “Ieee standard for wireless LAN medium access control
(MAC) and physical layer (PHY) specification: higher-speed
physical layer in the 5 GHz band,” IEEE 802.11a, 1999.
[5] G. Bianchi, “Performance analysis of the IEEE 802.11 dis-
tributed coordination function,” IEEE J. Select. Areas Com-
mun., vol. 18, no. 3, pp. 535–547, 2000.
6
Note that if p = 1orp = 1/2, the expression for τ in (A.6) cannot be
used.
[6] H. Wu, Y. Peng, K. Long, S. Cheng, and J. Ma, “Performance
of reliable transport protocol over IEEE 802.11 wireless LAN:
analysis and enhancement,” in Proc. 21st Annual Joint Confer-
ence of the IEEE Computer and Communications Society (IN-
FOCOM ’02), vol. 2, pp. 599–607, Piscataway, NJ, USA, June
2002.
[7] P. Chatzimisios, A. C. Boucouvalas, and V. Vitsas, “IEEE
802.11 packet delay—a finite retry limit analysis,” in Pro c.
IEEE Global Telecommunications Conference (GLOBECOM
’03), vol. 2, pp. 950–954, San Francisco, Calif, USA, Decem-
ber 2003.
[8] E. Ziouva and T. Antonakopoulos, “CSMA/CA performance
under high traffic conditions: throughput and delay analysis,”
Computer Communications, vol. 25, no. 3, pp. 313–321, 2002.
[9] M. M. Carvalho and J. J. Garcia-Luna-Aceves, “Delay analysis
of IEEE 802.11 in single-hop networks,” in Proc. 11th IEEE
International Conference on Network Protocols (ICNP ’03),pp.
146–155, Atlanta, Ga, USA, November 2003.
[10] F. Cali, M. Conti, and E. Gregori, “IEEE 802.11 protocol:
design and performance evaluation of an adaptive backoff
mechanism,” IEEE J. Select. Areas Commun., vol. 18, no. 9,
pp. 1774–1786, 2000.
[11] I. Aad and C Castelluccia, “Differentiation mechanisms for
IEEE 802.11,” in Proc. 20th Annual Joint Conference of the
IEEE Computer and Communications Societies (INFOCOM
’01), vol. 1, pp. 209–218, Anchorage, Alaska, USA, April 2001.
P. Chatzimisios received his B.S. degree in
informatics from the Technological Edu-
cational Institute of Thessaloniki, Greece,
in 2000. He is currently pursuing a Ph.D.
in wireless communication protocols with
the School of Design, Engineering and
Computing (DEC), Bournemouth Univer-
sity, United Kingdom. His research focuses
on performance modelling and analysis as
well as discrete-event simulation of wireless
communication protocols and communication networks. He has
published over 20 papers in the areas of wireless communications
(especially IEEE 802.11 and IrDA) and network management. He
is in the Technical Program Committee of the International Con-
ference on Cybernetics and Information Technologies, Systems and
Applications (CITSA 2005). Mr. Chatzimisios is a Student Member
of IEEE and IEE, and a Professional Member of ACM.
A. C. Boucouvalas has worked at GEC
Hirst Research Centre, and became a Group
Leader and a Divisional Chief Scientist un-
til 1987, when he joined Hewlett Packard
(HP) Laboratories as a Project Manager. At
HP Labs, he worked in the areas of optical
communication systems, optical networks,
and instrumentation, until 1994, when he
joined Bournemouth University. In 1996, he
became a Professor in multimedia commu-
nications, and in 1999 became a Director of the Microelectron-
ics and Multimedia Research Centre. His current research inter-
ests span the fields of wireless communications, optical fibre com-
munications and components, multimedia communications, and
human-computer interfaces, where he has published over 200 pa-
pers. He has contributed to the formation of IrDA as an indus-
try standard and he is now a Member of the IrDA Architectures
Council. He is a Fellow of the Royal Society for the encouragement
78 EURASIP Journal on Wireless Communications and Networking
of Ar ts, Manufacturers and Commerce (FRSA) and a Fellow of IEE
(FIEE). In 2002, he became a Fellow of the Institute of Electrical
and Electronic Engineers (FIEEE), for contributions to optical fibre
components and optical wireless communications. He is a Mem-
ber of the New York Academy of Sciences, and the Association for
Computing Machinery (ACM). He is an Editor of numerous jour-
nals and in the organising committees of many conferences.
V. Vi t s a s received his B.S. degree in electri-
cal engineering from the University of Thes-
saloniki, Greece, in 1983, his M.S. degree
in computer science from the University
of California, Santa Barbara, in 1986, and
his Ph.D. degree in wireless communica-
tions from Bournemouth University, UK, in
2002. In 1988, he joined Hellenic Telecom-
munications Organisation where he worked
in the field of X.25 packet switching net-
works. In 1994, he joined the Information Technology Department,
the Technological Educational Institution of Thessaloniki, Greece,
as a Lecturer in computer networks. In 2003, he became an Assis-
tant Professor at the same department. His current research inter-
ests lie in wireless and multimedia communications. He is a Mem-
ber of the Technical Committee of IEEE Globecom 2002. Dr. Vit-
sas is a Member of the Greek Computer Society and the Technical
Chamber of Greece.