Báo cáo hóa học: " On the Compensation of Delay in the Discrete Frequency Domain" pot
Bạn đang xem bản rút gọn của tài liệu. Xem và tải ngay bản đầy đủ của tài liệu tại đây (654.59 KB, 11 trang )
EURASIP Journal on Applied Signal Processing 2004:13, 2042–2052
c
2004 Hindawi Publishing Corporation
On the Compensation of Delay in
the Discrete Frequency Domain
Gareth Parker
Defence Science and Technology Organisation, P.O. Box 1500, Edinburgh, South Australia 5111, Australia
Email:
Received 31 October 2003; Revised 19 February 2004; Recommended for Publication by Ulrich Heute
The ability of a DFT filterbank frequency domain filter to effect time domain delay is examined. This is achieved by comparing the
quality of equalisation using a DFT filterbank frequency domain filter with that possible using an FIR implementation. The actual
performance of each filter architecture depends on the particular signal and transmission channel, so an exact general analysis is
not practical. However, as a benchmark, we derive expressions for the performance for the particular case of an allpass channel
response with a delay that is a linear function of frequency. It is shown that a DFT filterbank frequency domain filter requires
considerably more degrees of freedom than an FIR filter to effect such a pure delay function. However, it is asserted that for the
more general problem that additionally involves frequency response magnitude modifications, the frequency domain filter and
FIR filters require a more similar number of degrees of freedom. This assertion is supported by simulation results for a physical
example channel.
Keywords and phrases: frequency domain, FDAF, transmultiplexer, equaliser, delay.
1. INTRODUCTION
The term “frequency domain adaptive filter” (FDAF) [1]is
often applied to any adaptive digital filter that incorporates
a degree of frequency domain processing. Some time do-
main adaptive filtering algorithms, such as the least mean
square (LMS), may be well approximated using such “fre-
quency domain” processing, by employing fast Fourier trans-
form (FFT) algorithms to perform the necessary convolu-
tions [1]. The computational complexity of such implemen-
tations of these adaptive filters can be, for a large number of
taps, considerably less than the explicit time domain forms.
It is this computational advantage that is often the main mo-
tivation for using these architectures. Other advantages also
exist, such as the ability to achieve a uniform rate for all con-
vergence modes (see, e.g., [1]).
Architectures that could be more deservedly labelled “fre-
quency domain” can be achieved by transforming the time
domain input signal into a form in which individual fre-
quency components can be directly modified. This process
can be approximated using a filterbank “analyser” [2], shown
in Figure 1, which channels the input x(n) into relatively nar-
row, partially overlapping subbands, or “bins.” For clarity
of illustration, the complex oscillator inputs to the multi-
pliers in the analyser, e
− j2πnf
k
/f
s
, are denoted simply by − f
k
,
k = 0 ···K − 1. In the synthesiser, the conjugate oscillators
e
j2πnf
k
/f
s
are similarly denoted by f
k
.
With a sampling frequency f
s
Hz, the output of a K
bin filterbank analyser with decimation M at time mM/ f
s
is
a vector of bins X(m) = [X(m, f
0
), , X(m, f
K−1
)]. The kth
bin contains an estimate of the complex envelope of the nar-
row bandpass filtered component of x(n)centredat f
k
Hz. If
the bins are uniformly spaced between − f
s
/2and f
s
/2, then
the filterbank can be implemented using the discrete Fourier
transform (DFT) and it is then known as a DFT filterbank
[2]. As with other frequency domain filters, computation-
ally efficient implementations of the DFT filterbank, incor-
porating FFT algorithms, also exist [2]. When used for fre-
quency domain filtering, the DFT filterbank is sometimes
also known as a transmultiplexer [1, 3].
The contents of the bins can be modified by mul-
tiplication with possibly time varying, complex scalar
weights W(m) = [W(m, f
0
), , W(m, f
K−1
)], so that fil-
tering is performed in a manner that is analogous to
the explicit application of a transfer function to the
Fourier transform of a continuous time signal. A filter-
bank synthesiser reconstitutes a time domain output y(n)
by appropriately combining the modified bins Y(m) =
[Y(m, f
0
), , Y(m, f
K−1
)].
Importantly, it is possible to design the filterbank so that
the contents of a particular frequency bin can be modi-
fied, with relatively little impact on adjacent frequency com-
ponents. This approximate independence can be achieved
by designing the analysis and synthesis lowpass filters, h(n)
On the Compensation of Delay in the Discrete Frequency Domain 2043
− f
0
− f
1
− f
k
− f
K−1
x(n)
h(n)
h(n)
.
.
.
h(n)
.
.
.
h(n)
M
M
M
M
X(m, f
0
)
X(m, f
1
)
X(m, f
k
)
X(m, f
K−1
)
W
0
W
1
W
k
W
K−1
Y(m, f
0
)
Y(m, f
1
)
Y(m, f
k
)
Y(m, f
K−1
)
M
M
M
M
f (n)
f (n)
.
.
.
f (n)
.
.
.
f (n)
f
0
f
1
f
k
f
K−1
y(n)
Analyser Synthesiser
Figure 1: K-channel DFT filterbank conceptual diagram.
and f (n), respectively, so that only adjacent bins experi-
ence significant spectral overlap. This can be achieved, to
almost arbitrary precision, by using appropriately long im-
pulse responses, N
h
and N
f
for h(n)and f (n). In FDAF
applications, it is typical [1]todesignN
h
= N
f
= RK,
where R is around 3 or 4. Approximate bin indepen-
dence is ideal for filtering functions whose main objective
is the modification of spectral magnitude, such as “inter-
ference excision” (see, e.g., [4, 5]), a narrowband interfer-
ence mitigation technique in which frequency components
that comprise strong interference have weights set equal
to zero. In that application, the smaller the overlap be-
tween adjacent filterbank bins, the better. However, this is
not necessarily the case in applications that require a de-
lay to be applied to the signal. The ability to effect de-
lay is important in applications such as channel equalisa-
tion, echo cancellation, and the exploitation of cyclostation-
arity [6]. The requirement may vary from the need to ef-
fect a constant delay, as in a noise canceller, through to the
equaliser requirement that the delay may be frequency de-
pendent.
Figure 2 shows an example to illustrate the limitations of
the DFT filterbank FDAF. A source signal s(n)istransmitted
over a channel and is received as x(n). A delayed version of
s(n) is available as a desired response signal, d(n) = s(n − λ).
A filter is to be designed to process x(n)tomakeitas“close”
as possible to d(n). Assume that the channel is such that x(n)
is equal to s(n), other than for a delay that may vary with
frequency, but that is constant within each bin width of an
FDAF solution. A time domain adaptive filter solution may
be to filter x(n) using a finite impulse response (FIR) filter,
s(n)
Channel
c(n)
x(n)
Filter
y(n)
e(n)
−
+
d( n)
Figure 2: Example filtering problem.
with a tap weight vector w(n) that is adapted according to the
error e(n) = d(n)− y(n) using an algorithm such as LMS [7].
With an FDAF solution, both x(n)andd(n)arechan-
nelised into approximate frequency domain representa-
tions X(m, f
k
)andD(m, f
k
). Each frequency component,
X(m, f
k
), is multiplied by a complex scalar W(m, f
k
)so
that Y (m, f
k
) = W(m, f
k
)X(m, f
k
), and the inverse trans-
form is then applied to generate y(n), the estimate of
d(n). Figure 3 shows an illustration of this filtering pro-
cess.
If bin independence is assumed, the objective can be
achieved by making, for every bin, Y(m, f
k
) as close as possi-
ble to D(m, f
k
) and the frequency domain weights vector can
also be optimised using simple algorithms such as LMS [1].
Let the delay that the transmission channel has imposed on
the kth filterbank bin of the primary signal be denoted by .
If the filterbank decimates the time domain data by a factor
of M, then the delays λ and become λ/M and /M samples,
2044 EURASIP Journal on Applied Signal Processing
x(n)
K-point
analyser
X
0
X
1
.
.
.
X
K−1
W
0
−
+
W
1
−
+
W
K−1
−
+
D
K−1
D
1
D
0
d(n)
K-point analyser
Y
0
Y
1
.
.
.
Y
K−1
K-point
synthesiser
y(n)
Figure 3: K-channel frequency domain adaptive filter.
respectively , and we require
W
m, f
k
S
m −
M
, f
k
≈ D
m, f
k
= S
m −
λ
M
, f
k
=⇒ W
m, f
k
S
m, f
k
≈ S
m −
(λ − )
M
, f
k
.
(1)
Equality is clearly not possible. In general, modification of
the magnitude and phase within a filterbank bin is not suffi-
cient to perfectly achieve any nontrivial delay. In this paper,
we present an analysis to quantitatively determine the deg ree
to which a filterbank FDAF can compensate or effect delay.
The paper is structured as follows. A discussion of previous
related research is given in the next section. In Section 3,an
analysis is presented of the accuracy with which an FIR fil-
ter can compensate a delay that varies linearly over a speci-
fied bandwidth. This is useful both for the explicit purpose of
analysis of the FIR filter and also for the analysis in Section 4
of the FDAF, which can be viewed as comprising a single tap
FIR filter operating within each filterbank bin. Section 4 in-
cludes a comparison between FIR and FDAF delay compen-
sation for linear delay channels, as well as a simulation exam-
ple for a real-world channel. Conclusions are summarised in
Section 5.
2. PREVIOUS ANALYSES OF THE FREQUENCY
DOMAIN DELAY COMPENSATION PROBLEM
In 1981, Reed and Feintuch [8] compared the performance
of an adaptive noise canceller, implemented using the time
domain LMS algorithm, with an early “frequency domain”
LMS approximation. The particular frequency domain ar-
chitecture that was studied was that of Dentino et al. [9],
which approximated the LMS algorithm using a combina-
tion of FFT/IFFT algorithms that resulted in circular convo-
lutions. A particular observation in [8] is that if the time and
frequency domain filters are implemented using the same
number of degrees of freedom
1
and if there exists differen-
tial delay between the primary and desired response inputs,
then excessive noise appears in the frequency domain solu-
tion. Although the amount of excess noise is quantified, the
results in [8] are applicable only to that particular “frequency
domain” filter.
Sometimes, particularly for the equaliser and echo can-
celler problems, a subband adaptive filter (SAF) is adopted
[10, 11, 12, 13, 14, 15]. A S AF is a generalisation of a FDAF,
where a multitap FIR adaptive filter operates within each fil-
terbank channel. The ability of the SAF to effect a perfor-
mance that is comparable to a time domain implementation
has been recently addressed in [10, 12, 16]. In [12], the use
of critically sampled filterbanks for the system identification
problem has been examined. For the identification of a sys-
tem with an impulse response comprising L
s
samples, it is
stated that the number of FIR taps within each subband filter
should be around
L =
L
s
+ N
h
+ N
f
M
,(2)
where the filterbank analysis and synthesis filters have lengths
N
h
and N
f
, respectively, and the filterbank decimates the
sampling rate by a factor M.In[16], the result of [12]isap-
plied to the equaliser problem, and it is argued that to achieve
the same performance as an L
td
tap time domain equaliser,
the number of samples in each FIR filter must be around
L =
L
td
+ N
h
M
. (3)
In [10], a similar expression is provided, although the fac-
tor N
h
in the numerator of (3) is doubled. This is essentially
the same as (2), except that the application is different. The
correctness of the expression for the equalisation problem is
justified in [10] through simulation results, but it is acknowl-
edged as a conservative relationship. Although it is appropri-
ate for the case where L 1, where L is close to one or, in the
case of the FDAF, equal to one, the expression is less suitable.
Equation (3) suggests that there is no filterbank FDAF which
can achieve the performance of a FIR filter. For instance, if
N
h
= RK = RMI,whereI is the oversampling factor, then
even as K →∞, L → RI. There is a need to determine guide-
lines for the choice of K in a filterbank FDAF, where L = 1,
and this is the focus of this paper.
3. EFFECTING DELAY USING AN FIR FILTER
In order to determine the degree to which a DFT filterbank
FDAF can effect delay, we will determine the estimation er-
ror that is associated with each filterbank bin and then com-
bine these errors in a frequency domain SNR measure. In
some applications, this may be the most appropriate measure
of quality. In others, including conventional equalisers and
1
That is, the number of bins in the frequency domain implementation is
equal to the number of time domain taps.
On the Compensation of Delay in the Discrete Frequency Domain 2045
noise cancellers, it may be more appropriate to measure the
SNR associated with the filterbank output. These two SNR
measures will be identical for an “ideal” filterbank; that is,
one that exhibits perfect reconstruction and which has in-
dependent bins. If the bins are not independent but exhibit
some spectral overlap, then the relationship between the fre-
quency and time domain SNR measures is only approximate.
In the following discussion, we will analyse the error within
the filterbank bins by treating each bin as an optimal single
tap, linear time invariant (LTI) FIR filter. Consequently, we
first obtain a general expression for the performance of an
optimal FIR equaliser. This will also be useful for the purpose
of comparison between the FIR and the filterbank. Further
comparison with an SAF is detailed in [6].
Consider an L-tap FIR filter, with f
s
Hz sampling rate. A
delay can be exactly effected if it is e qual to an integer mul-
tiple, less than L,of1/f
s
second. For delays not equal to a
multiple of 1/f
s
, the delay will be an approximation [17], the
accuracy of which can be determined by considering the op-
timum FIR filter.
To analyse this, we will elaborate on the example shown
in Figure 2. Consider the transmission of a zero-mean signal
s(t) through a channel with impulse response c(t). At a re-
ceiver, this is sampled and applied to an L-tap FIR filter as the
observation signal, x(n) = s(n) ∗ c(n), where s(n)andx(n)
are the sampled signals and c(n) is the equivalent discrete-
time channel. The filter produces the output y(n) = wx
n
,
where x
n
= [x(n − L +1), , x(n)]
T
contains the last L
signal samples and the FIR filter impulse response is con-
tained within the row vector w = [w(0), , w(L − 1)]. A
desired response, d(n), is provided, which is related to s(n)
by d(n) = s(n) ∗ g(n), where g(n) is assumed to have an FIR.
Ideally, s(n) would be available at the receiver and g(n)would
then be a simple delay, designed into the adaptive filter and
chosen so that the equalisation problem has a causal solution.
Assume that s(n) is stationary and define the autocorrelation
matrix and cross-correlation vector as
R =
R
xx
(0) ··· R
xx
(−L +1)
.
.
. R
xx
(0)
.
.
.
R
xx
(L − 1) ··· R
xx
(0)
,
p =
R
dx
(0), , R
dx
(L − 1)
,
(4)
where R
xx
(τ) = E[x(n)x
∗
(n−τ)] and R
dx
(τ) = E[d(n)x
∗
(n−
τ)]. The weights vector that minimises the mean square esti-
mation error (MSE) is the Wiener solution, w = pR
−1
.Stan-
dard analysis (see, e.g., [7]) shows that the error power is
equal to
J = E
d(n) − y(n)
2
=
R
dd
(0) − pR
−1
p
H
(5)
and so the SNR at the filter output can be expressed as
SNR =
R
dd
(0)
R
dd
(0) − pR
−1
p
H
. (6)
This can be further manipulated in terms of the source signal
power σ
2
= E[s(n)s
∗
(n)] and the impulse responses of the
channels c(n)andg(n). Assuming that s(n) is stationary, it
can be shown [6] that
R
dd
(τ) = R
ss
(τ) ∗ R
gg
(τ),
R
dx
(τ) = R
ss
(τ) ∗ R
gc
(τ),
R
xx
(τ) = R
ss
(τ) ∗ R
cc
(τ),
(7)
wherewehavedefinedR
gc
(τ) = g(τ) ∗ c
∗
(−τ), R
gg
(τ) =
g(τ) ∗ g
∗
(−τ), and R
cc
(τ) = c(τ) ∗ c
∗
(−τ).
Now let s(n) be a white stationary signal and consider the
ideal equalisation problem where g(n) is a delay of λ samples,
chosen to facilitate a causal solution. Thus g(n) = δ(n −λ)so
that d(n) = s(n − λ)andR
dd
(0) = R
ss
(0) = σ
2
.Then,from
equation (5), the MSE is e qual to
J = σ
2
−
1
σ
2
L−1
i=0
R
dx
(i)
2
. (8)
As s(n) is white with variance σ
2
, then R
dx
(τ) = σ
2
δ(τ − λ) ∗
c
∗
(−τ) = σ
2
c
∗
(−τ + λ). Thus, in this case, we have
J = σ
2
1 −
L−1
i=0
c
∗
(λ − i)
2
(9)
and the SNR is equal to
SNR =
1
1 −
L−1
i=0
c
∗
(λ − i)
2
. (10)
Let the channel c(n) have a bandpass frequency response
with a delay that varies linearly from
min
to
max
samples,
over a filter bandwidth of 2b bins, in an N-sample DFT of
the impulse response c(n). It can be shown [6] that the dis-
crete magnitude frequency response can be written as
C(k)
= rect
k
2b
e
jΦ(k)
, (11)
where the phase response is given by
Φ(k) =
min
−
max
πk
2
2bN
−
max
+
min
πk
N
. (12)
Example 1 (constant delay channel). A particularly simple
special case of the linear delay channel is when the delay is
constant, equal to samples, where is not necessarily an
integer. In this case, if the channel bandwidth extends over
the sampling frequency range, then f
c
= f
s
/2andc(n) =
sinc(n − ). Then, from equation (10),
SNR =
1
1 −
L−1
i=0
sinc(λ − − i)
2
. (13)
Clearly, if λ − is a multiple of the sampling period but is
less than L, then the sinc function is sampled only at its peak
and at its zero crossings. In this case, the summation in the
denominator of (13) equals unity and the SNR is infinite.
2046 EURASIP Journal on Applied Signal Processing
60
50
40
30
20
10
0
SNR (dB)
10
1
10
2
10
3
L (samples)
Figure 4: Reconstruction SNR for FIR equalisation of linear delay
channel.
This verifies the earlier statement that an FIR filter is capable
of perfectly achieving delays which are a multiple of the tap
spacing. However, recall that is not necessarily an integer.
If a noninteger delay is required, then the sinc function will
not be sampled at its zero crossings and the SNR is finite. A
perfect noninteger delay cannot be achie ved for finite L.
Example 2 (general linear delay channel). Next we look at the
equalisation of a channel with a delay which varies linearly
over a 100-sample ra nge. In this case, we examine both the-
oretical and experimental performances. In order to assure
a causal experimental channel with a delay response which
closely approximates the desired response, we let the number
of samples in the channel impulse response be N
ch
= 2048
and design the delay to vary from sample 975 to sample 1075,
symmetric about n
0
= 1025. Figure 4 shows the theoretical
SNR for an optimal L point FIR equaliser for this channel.
Thecurvewasgeneratedusing(12)and(11)tonumerically
evaluate (10). Also shown by crosses are the experimental re-
sults. The parameter λ was chosen to maximise the summa-
tion of equation (10). As |c(n)| is symmetric about sample
n
0
, this means choosing λ = (L − 1)/2+n
0
and, in this ex-
ample, we have λ = (L − 1)/2 + 1025 samples. Experimental
results, obtained for a unity variance complex Gaussian white
noise signal and using an LMS algorithm to approximate the
optimal filter, are indicated by crosses.
4. FILTERBANK
The analysis of Section 3 can be used to determine the accu-
racy with which a filterbank FDF can compensate delay by
considering the FIR c ase with L = 1 taps. However, by allow-
ing an arbitrary number of FIR taps, the study can be gen-
eralised to a SAF [6]. A subband adaptive equaliser can be
implemented using identical filterbanks to generate each of
the primary X(m, f
k
) and desired D(m, f
k
) response signals
x(n)
h(n)
M
X(m, f
k
)
x
k
(n)
e
− j2πn f
k
/f
s
Figure 5: Signal flow diagram for the kth channel of the filterbank
analyser, processing the observation signal x(n).
from the time domain inputs x(n)andd(n). An FIR filter is
independently applied to each channel of X(m, f
k
) to min-
imise the performance cr i terion, which is assumed here to be
the MSE. The er ror power associated with each bin is readily
determined using the analysis of Section 3 for the FIR filter. If
the filterbanks are capable of perfect reconstruct ion with in-
dependent bins, then the sum of the error power within each
bin of this equaliser equals the MSE of the time domain es-
timate of d(n). An expression for the equaliser SNR can be
readily determined. If the filterbank does not satisfy these
properties, then such an expression is only approximate.
To facilitate the application of the general FIR filter anal-
ysis of Section 3, let the signal s(n) pass through the trans-
mission channels c
(n)andg
(n) to produce the observa-
tion and desired response signals x(n) = s(n) ∗ c
(n)and
d(n) = s(n) ∗ g
(n). The signal within the kth observation
filterbank bin is, prior to decimation,
x
k
(n) =
s(n) ∗ c
(n)
e
− j2πf
k
n/ f
s
∗ h(n), (14)
as illustrated in Figure 5. Similarly,
d
k
(n) =
s(n) ∗ g
(n)
e
− j2πf
k
n/ f
s
∗ h(n). (15)
These can be shown to be equivalent to
x
k
(n) =
s(n)e
− j2πf
k
n/ f
s
∗
c
(n)e
− j2πf
k
n/ f
s
∗ h(n),
d
k
(n) =
s(n)e
− j2πf
k
n/ f
s
∗
g
(n)e
− j2πf
k
n/ f
s
∗ h(n).
(16)
Let s
k
(n) = s(n)e
− j2πf
k
n/ f
s
, c
k
(n) = c
(n)e
− j2πf
k
n/ f
s
,and
g
k
(n) = g
(n)e
− j2πf
k
n/ f
s
so that we can write
x
k
(n) = s
k
(n) ∗ c
k
(n) ∗ h(n),
d
k
(n) = s
k
(n) ∗ g
k
(n) ∗ h(n).
(17)
Writing c
k
(n) = c
k
(n) ∗ h(n)andg
k
(n) = g
k
(n) ∗ h(n)gives
us expressions for x(n)andd(n) in the form of the general
FIR analysis. That is,
x
k
(n) = s
k
(n) ∗ c
k
(n),
d
k
(n) = s
k
(n) ∗ g
k
(n).
(18)
This means that expressions for R
x
k
x
k
(n), R
d
k
d
k
(n), and
R
d
k
x
k
(n), and thus the SNR within each channel, can be
easily determined. After decimation by M, the observa-
tion and desired response signals are X(m, f
k
) = x
k
(mM)
and D(m, f
k
) = d
k
(mM), respectively. Assuming no alias-
ing occurs, the correlation functions of the decimated data
are R
X
k
X
k
(m) = R
x
k
x
k
(mM), R
D
k
D
k
(m) = R
d
k
d
k
(mM), and
On the Compensation of Delay in the Discrete Frequency Domain 2047
R
D
k
X
k
(m) = R
d
k
x
k
(mM). Further analysis requires particu-
lar cases to be treated separately. We assume throughout that
s(n) has unity variance and is white over the frequency range
− f
s
/2to f
s
/2.
4.1. Frequency domain filter
A filterbank FDAF has L = 1 and expression (6) for the SNR
within the kth bin reduces to
SNR
k
=
R
D
k
D
k
(0)
R
D
k
D
k
(0) −
R
D
k
X
k
(0)
2
/R
X
k
X
k
(0)
. (19)
We now proceed to determine the correlation functions for
a channel that has flat magnitude response with linear de-
lay. This is achieved by inverse Fourier transforming the
corresponding cross-spectra. The magnitude of the cross-
spectrum between the desired response and observation sig-
nals within a particular bin is bandpass from approximately
− f
s
/2K to f
s
/2K Hz. Under the assumption that the trans-
mission channels c
(n)andg
(n) are flat with unity gain over
the bandwidth of each bin, the shape of the cross-spectrum
is determined solely by the frequency response of the anal-
ysis filters and S
ss
( f ), the power spectral density of s(n).
That is, S
d
k
x
k
( f ) =|H( f )|
2
S
ss
( f − f
k
), as shown in the ap-
pendix. Since we assume that s(n) is white over the frequency
range between − f
s
and f
s
Hz, then S
ss
( f ) = σ
2
/f
s
. The cross-
spectral phase is bin dependent but is simply the difference
between the phase response of the channels over this fre-
quency range. This can be determined from the correspond-
ing delay difference. Thus the cross-correlation function for
each bin, R
D
k
X
k
(m), can be determined using an algorithm
for designing a linear delay FIR filter.
Although we derive results for a filterbank with a prac-
tical analysis filter, it is also essential to consider the ideal,
independent bin case. The reason for this is threefold; first,
the assumption of independent bins is frequently made in
frequency domain filtering applications; second, we will see
that this extreme filterbank architecture achieves the worst
possible delay performance; and third, simple closed-form
expressions can be obtained for its performance. If the filter-
bank satisfies the perfect reconstruction property and has in-
dependent bins, then the analysis filter has an ideal brick-wall
frequency response that is flat between − f
s
/2K and f
s
/2K Hz.
That is, H( f ) = rect( f/2 f
c
), where f
c
= f
s
/2K Hz.
4.1.1. Equalisation of a constant delay channel
using an ideal filterbank
It is useful to explicitly consider the case where the chan-
nel delay is constant since, as will now be shown, a closed-
form expression for the SNR can be derived. Let the t rans-
mission channel c
(n) have a constant delay equal to sam-
ples, where is not necessarily an integer, and let g
(n)havea
constant λ sample delay. The delay difference between g
(n)
and c
(n)isthusλ − . T he bandwidth of each bin is equal
to 2 f
c
= f
s
/K and so the magnitude of S
d
k
x
k
( f )isequalto
S
ss
( f )rect( fK/f
s
). At the decimated sample rate, f
s
= f
s
/M,
the cross-spectral bandwidth becomes 2 f
c
= f
s
M/K and the
“filter” group delay is (λ− )/M. The impulse response p(m),
whose discrete-time Fourier transform equals the cross-
spectrum S
d
k
x
k
( f ), can be shown to equal
p(m) =
σ
2
Kf
s
sinc
mM
K
−
λ −
K
. (20)
To determine R
D
k
X
k
(m), this impulse response must be
scaled by a factor f
s
so that its DFT produces a discrete
power spectrum whose bins sum to the correct power. With
this scaling, the cross-correlation becomes
R
D
k
X
k
(m) =
σ
2
K
sinc
mM
K
−
λ −
K
. (21)
The autocorrelation functions R
X
k
X
k
(m)andR
D
k
D
k
(m)can
similarly be shown to equal
R
X
k
X
k
(m) = R
D
k
D
k
(m) =
σ
2
K
sinc
mM
K
. (22)
Using equation (19), the SNR is the same within each bin
and is equal to
SNR
k
=
1
1 − sinc
2
(λ − )/K
. (23)
This is also equal to the total frequency domain SNR, since
the channels through which both observation and desired
response signals have passed have frequency-independent
magnitude and delay response. Under the assumption of
independent bins, this SNR is also equal to the SNR of the
reconstructed time domain output. Equation (23)illustrates
an important result; due to the SNR dependence on the
magnitude of the differential delay |λ − |, the filterbank
FDAF effects signal advance to the same accuracy as it can
effect delay. Consequently for frequency domain equalisa-
tion, in the absence of detailed channel knowledge, the most
generally optimum design would use λ = 0.
The SNR given by (23) is plotted as the solid trace in
Figure 6, for the case where M = K/2, = 64, λ = 0, and K is
varied over the range to 32. The horizontal axis is the ratio
K/, to clar ify that the curve depends only on this ratio and
not on the values of and K themselves. Experimental re-
sults were also obtained by approximating the independence
of the bins by using a DFT filterbank w ith very little overlap
of adjacent frequency bins. This was achieved by using analy-
sis filters with very long impulse responses, N
h
= RK,where
R = 32. The details of this filter design, based on a Hamming
window, are given in [6].
The experimental frequency domain SNR, that is, the ra-
tio of total frequency domain signal power to total frequency
domain error power, is plotted as circles. The crosses repre-
sent the experimental SNR of the time domain output. T he
results illustrate that a DFT filterbank with independent bins
cannot exactly compensate even a constant delay channel ex-
cept asymptotically as K →∞. The closeness of the theo-
retical and experimental results also verifies that the SNR of
the time domain filterbank output is approximately equal to
the SNR within the filterbank transform domain, for the case
where bin independence can be closely modelled.
2048 EURASIP Journal on Applied Signal Processing
Theoretical ideal filter bank
Experimental time domain
Experimental frequency domain
0 5 10 15 20 25 30 35
Ratioofnumberofbinstodelay
0
5
10
15
20
25
30
SNR (dB)
Figure 6: Reconstruction SNR for “ideal” filterbank FDAF equali-
sation of constant delay.
4.1.2. Channel with linear delay
Now consider an allpass channel, c
(n), with a delay that
varies linearly from
min
to
max
samples over the sampling
bandwidth. Let the delay associated with channel c
k
(n)vary
from
bmin
to
bmax
samples over the bandwidth of the kth
bin, at the input sampling rate. The delay difference between
the desired response and observation signal thus varies over
λ −
bmax
to λ −
bmin
samples. It is easy to show [6] that
bmin
(k) =
min
+
max
−
min
K
k +
K +1
2
,
bmax
(k) =
min
+
max
−
min
K
k +
K
− 1
2
.
(24)
The cross-spectral delay between the decimated desired re-
sponse and observation signals then var ies linearly from
1
=
(λ−
bmax
)/M to
2
= (λ −
bmin
)/M samples at the decimated
rate, f
s
= f
s
/M Hz.
Let ν represent the discrete frequency index for a fre-
quency domain representation of the kth subband data.
To determine the cross-correlation function R
D
k
X
k
(m), the
cross-spectrum S
D
k
X
k
(ν) can be sampled at N points and an
inverse DFT computed. Under our assumption that s(t)is
white, the power spectral magnitude |S
ss
( f )| is constant and
equal to σ
2
/f
s
units squared per Hz. Thus the magnitude of
the cross-spectral density S
D
k
X
k
(ν)isequaltoσ
2
|H(ν)|
2
/NM
units squared per bin
2
and the cross-spectral density S
D
k
X
k
(ν)
is equal to
S
D
k
X
k
(ν) =
S
SS
(ν)
H(ν)
2
e
jΦ
k
(ν)
. (25)
2
Since the subband data is sampled at f
s
= f
s
/M Hz, the bandwidth of
each of the N bins is equal to f
s
/NM Hz and the power w ithin each bin is
equal to σ
2
/NM units squared.
Within the kth filterbank channel, the N point correlation
function between the decimated reference and the primary
signal component, R
D
k
X
k
(m), is then approximately given by
3
R
D
k
X
k
(m) = N × IDFT
S
D
k
X
k
(ν)
=
σ
2
M
IDFT
H(ν)
2
e
jΦ
k
(ν)
,
(26)
with
Φ
k
(ν) =
2
−
1
πν
2
2bN
+
1
+
2
πν
N
, (27)
where the bandwidth 2b = MN/K. Although not explicitly
indicated in (27), the delays
1
and
2
are a function of the
bin number, k. The autocorrelation functions R
X
k
X
k
(m)and
R
D
k
D
k
(m) can similarly be computed by specifying a linear
phase term in (26). The SNR within each bin is computed
using (19) but the total filterbank SNR should be computed
by the ratio of total signal to total error power. That is,
SNR
FB
=
K−1
k=0
R
D
k
D
k
(0)
K−1
k=0
J
k
, (28)
where the power of the desired response signal is equal to
R
D
k
D
k
(0), and from (5), the error power within the kth bin is
J
k
= R
D
k
D
k
(0) −
R
D
k
X
k
(0)
2
R
X
k
X
k
(0)
. (29)
If the filterbank exhibits perfect reconstruction and the bins
are independent, the SNR associated with the reconstructed
time domain output satisfies the relationship SNR
td
=
SNR
FB
, otherwise this relationship is only approximate.
We used this general analysis to determine the equalisa-
tion performance for a constant delay channel using a prac-
tical filterbank FDAF. The analysis and synthesis filters were
designed to have identical impulse responses, where only ad-
jacent bins exhibit any significant spect ral overlap, resulting
in near-perfect reconstruction
4
and so that the sum of the
power within each analyser bin equals the time domain in-
put signal power. The length of the analysis and synthesis fil-
ters was N
h
= RK,whereR = 4, and the filterbank had a
decimation factor M = K/2. Equation (26)wascomputed
using these parameters, with K = 512 and N = 100. The
magnitude response of the analysis filter was determined by
performing an N-point DFT on the decimated impulse re-
sponse h(mM) = h(n).
3
In general, the discrete power spectrum S
xx
(ν)ofasignalx(m)can
be estimated by 1/N times the periodogram |X(ν)|
2
,whereX(ν) =
DFT[x(m)]. Since the autocorrelation function, R
xx
(m), estimated by time
average x(m)∗x
∗
(−m)isequaltotheinverseDFTof|X(ν)|
2
,itfollowsthat
R
xx
(m)isequaltoN times the inverse DFT of S
xx
(ν).
4
That is, less than −65 dB reconstruction error was achieved for a back-
to-back analyser/synthesiser configuration.
On the Compensation of Delay in the Discrete Frequency Domain 2049
Theoretical frequency domain SNR
Experimental time domain SNR
Experimental frequency domain SNR
0
5 101520253035
Ratioofnumberofbinstodelay
0
5
10
15
20
25
30
35
SNR (dB)
Figure 7: Reconstruction SNR for filterbank FDAF equalisation of
constant delay.
The solid trace of Figure 7 shows the theoretical fre-
quency domain SNR as a function of the ratio K/.Fre-
quency domain SNR measurements, computed from exper-
imental results, are shown as crosses and the correspond-
ing time domain output SNR points are shown as circles.
By comparison with Figure 6, it can be seen that the fre-
quency domain SNR is almost the same as that obtained
when the bins are independent. However, the experimen-
tal results show that the SNR of the filterbank time domain
output is better. This can be explained by considering the
power spectra of the subband error signals. Simulations have
shown that the error power spectrum is distributed towards
the edges of the bins, rather than about the bin centre as is the
signal power spectrum. By design, the action of the synthesis
filters is to constructively combine the signal components of
adjacent bins, but the error is attenuated by these filters. So
while the signal power is preserved by the synthesis process,
the error power is reduced. The result is the superior SNR of
the time domain filterbank output compared with the trans-
form domain SNR.
Next, we look at the performance of a filterbank FDAF
for equalising the linear delay channel which was defined
in Example 2. The channel has delay that varies linearly
from
max
−
min
= 100 input samples over the full discrete
frequency range. The theoretical frequency domain SNR is
shown as the solid trace in Figure 8,foraperfectreconstruc-
tion filterbank with nonoverlapping bins. The delay in the
desired response channel was chosen to maximise the SNR.
Since the filterbank is capable of effecting a noncausal re-
sponse, where a delay of − samplesisasreadilyapproxi-
mated as a delay of samples, the optimum choice is λ =
n
0
= (
max
+
min
)/2. The example channel has
min
and
max
Theoretical ideal FB
Theoretical frequency domain SNR
Experimental time domain SNR
10
1
10
2
10
3
K (bins)
0
5
10
15
20
25
30
35
40
SNR (dB)
Figure 8: Reconstruction SNR for filterbank FDAF equalisation of
the linear delay channel.
equal to 975 and 1075, respectively, so that the channel delay
is symmetric about n
0
= 1025. Justified by the closeness of
the time and frequency domain SNR measures for the con-
stant delay channel (Figure 6), we assert that this solid trace
also represents the time domain SNR measure for the “ideal”
filterbank. Also shown in Figure 8 is the theoretical frequency
domain (dashed) and experimental time domain (circles)
SNR achieved by the R = 4 prac tical filterbank FDAF that
was introduced earlier in this section. As anticipated from
the results of the constant delay channel, the frequency do-
main SNR associated with the practical filterbank is very sim-
ilar, but slightly inferior, to the ideal filterbank. However, also
in similarity to the results of the constant delay channel, the
time domain SNR is superior to the frequency domain mea-
sure.
We can use Figures 8 and 4 to compare the performance
of the frequency domain filter with a time domain FIR filter
for the equalisation of the linear delay channel. Since the rela-
tionships between SNR and the parameters of each filter type
are nonlinear, the comparison is most easily accomplished
by looking at the number of filter weights that are required
to achieve specific SNR levels. Inspection of Figure 4 reveals
that to achieve SNR equal to 18 dB and 35 dB, respectively,
approximately L = 100 and L = 200 taps are required by a
FIR filter. From Figure 8, it can be seen that to achieve similar
frequency domain SNR, the number of ideal filterbank bins
must be around K = 450 and K = 3000 bins, respectively.
This is 4.5 and 15 times greater than the corresponding num-
ber of FIR filter taps. The practical R = 4 filterbank requires
approximately K = 250 and K = 1500 bins which, for this
example, is around half the number of bins required by the
ideal filterbank.
2050 EURASIP Journal on Applied Signal Processing
012345678910
Time (µs)
−0.4
−0.2
0
0.2
0.4
0.6
0.8
Amplitude
Figure 9: Real (black) and imaginar y (grey) parts of example chan-
nel impulse response.
The results of the previous paragraph can be compared
with the relationship in (3). In this example, the ideal
filterbank has an infinite number of a nalysis filter samples.
According to (3), the number of subband FIR taps must also
be infinite, yet we have shown that there exists a filterbank
FDAF (equivalent to an SAF with one tap per subband FIR
filter) that can achieve the FIR performance. This clearly
illustrates the conservative nature of (3).
4.2. Channel equalisation example
It is important to compare the specialised results discussed
thus far with the equalisation performance of a real-world
channel and signal. In this section, we provide an example
where a simulation signal is passed through such a channel
and is subsequently equalised using both an FDAF and a time
domain LMS equaliser.
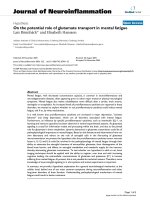
Consider the microwave channel with an equivalent
baseband impulse shown in Figure 9, obtained with a
60 MHz sampling rate. This is “channel 14,” taken from the
Rice University microwave channel database, currently avail-
able at the Internet site “ />html.” Analysis shows that there is considerable variation in
both the delay and the magnitude of the frequency response,
with nonminimum phase zeros located close to the unit cir-
cle. We used, for the example signal, a baseband 12 Mbaud
BPSK signal with root raised cosine pulse shaping.
Each of the FDAF and LMS filter parameters was adjusted
so that in the steady state, the output signal was restored
to a similar SNR. So that the example represents, as realis-
tically as possible, a typical equalisation problem, the delay
parameter λ was chosen without incorporating knowledge of
the length of the channel impulse response. Consequently,
in accordance with the discussions in Sections 3 and 4.1, λ
was chosen equal to L/2 for the time domain filter and 0 for
the FDAF. With L
= 4096 taps and convergence coefficient
µ = 10
−5
, the FIR fi lter achieved approximately 19 dB steady
state SNR. In the filterbank case, we used an oversampling
factor I = 2 and length 4K analysis and synthesis filters. The
FDAF filter weights were determined using the single tap RLS
algorithm with γ = 0.99 and it was found that with K = 4096
bins, the filterbank FDAF also achieved approximately 19 dB
SNR.
In this example, to achieve the same output SNR, a sim-
ilar number of degrees of filtering freedom are required for
each of the time domain FIR filter and the FDAF. This obser-
vation has also been found to be consistent with other real-
world channel examples, including a number of others from
the Rice University database. For these other cases, the FDAF
required at most twice the number of degrees of freedom of
the time domain filter.
This is a significantly different observation to that which
could be anticipated from studying the results of the linear
delay channel. In that case, the experimental results showed
that to achieve approximately 26 dB SNR, the FIR and FDAF
required L = 250 taps and K = 1000 bins, respectively; con-
siderably more degrees of freedom are required by the FDAF.
That in these real-world examples a comparable number of
degrees of freedom are required by each of the two filter
types can be well explained by considering the duality be-
tween FIR and FDAF filters. The FIR filter is inherently well
suited to effecting pure delay functions; it can localise in time,
since it is a time domain operation. On the other hand, an
FDAF can effect narrowband modification of the frequency
response. It is not surprising then that for an operation such
as real-world channel equalisation, that requires modifica-
tion of both delay and frequency response, a similar number
of degrees of f reedom are required by both FIR and FDAF fil-
ters. We should again emphasise that there are additional rea-
sons why, in practice, the FDAF may or may not b e adopted
in preference to a time domain approach, as discussed in the
introduction to this paper. The most notable advantages in
these real-world examples are the superior convergence rate
and computational efficiency of the FDAF.
This relationship between the number of degrees of free-
dom required by an FDAF and an FIR filter to achieve similar
delay compensation clearly depends on the particular chan-
nel type. Importantly, however, in any of the cases consid-
ered here
5
, it has been shown that it is possible to design
an FDAF to achieve equivalent delay compensation perfor-
mance to that of an FIR filter.
5. CONCLUSION
In this paper, we have addressed an important issue associ-
ated with the application of a DFT filterbank FDAF to chan-
nel equalisation. We have shown that a fundamental differ-
ence between the DFT filterbank and an FIR filter is the ac-
curacy of delay compensation. While an L-tap FIR filter is
capable of perfect compensation for a set of L discrete delays,
a DFT filterbank F DAF, with indep endent bins, is incapable
5
This excludes the case where the delay is constant and equal to a mul-
tiple of the sampling period, in which case it is possible to achieve perfect
compensation using an FIR filter.
On the Compensation of Delay in the Discrete Frequency Domain 2051
of perfect delay compensation except asymptotically as the
number of bins approaches infinity. For other delays, how-
ever, we have shown that it is possible to determine filter-
bank FDAF parameters that result in equivalent performance
to that of an FIR filter.
For equalisation of a linear delay channel, a filterbank
FDAF can require in excess of an order of magnitude more
bins than the number of taps required by a FIR filter. The
ability of a filterbank FDAF to compensate delay is directly
related to the deg ree of spectral overlap that exists between
bins and results indicate that the greater the independence
between bins, the poorer the quality of FDAF delay compen-
sation.
Notwithstanding these conclusions, the linear delay
channel represents an extreme condition and counter exam-
ples have suggested that for compensation of more typical
communications channels, the number of bins required by
an FDAF is around the same as the number of taps required
by a similarly performing FIR filter.
It has been shown that for the majority of the chan-
nels considered, it is possible to design a filterbank FDAF to
achieve a delay compensation performance that is equivalent
to that possible using an FIR filter. This is a new observation
that would otherwise not be clear from previously published
work.
APPENDIX
In this appendix, the expression for the cross-spectrum,
S
d
k
x
k
( f ) =|H( f )|
2
S
ss
( f − f
k
), used in Section 4.1,isderived.
First, recall that x(n) = s(n) ∗ c
(n)andd(n) = s(n) ∗
g
(n). Then, with reference to Figure 5,
x
k
(n) =
s(n) ∗ c
(n)
e
− j2πf
k
n/ f
s
∗ h(n), (A.1)
whichcommutesto
x
k
(n) =
s(n) ∗ c
(n) ∗ h
(n)
e
− j2πf
k
n/ f
s
,(A.2)
where h
(n) = h(n)e
j2πf
k
n/ f
s
. Similarly,
d
k
(n) =
s(n) ∗ g
(n) ∗ h
(n)
e
− j2πf
k
n/ f
s
. (A.3)
Then, from linear systems theory, the cross-spectrum
S
x
k
f
k
( f )isgivenby
S
x
k
d
k
( f ) = S
ss
f − f
k
C
f − f
k
H
f − f
k
×
G
f − f
k
H
f − f
k
∗
= S
ss
f − f
k
C
f − f
k
G
∗
f − f
k
×
H
f − f
k
2
,
(A.4)
where C
( f ), G
( f ), and H
( f ) are the Fourier transforms of
c
(n), g
(n), and h
(n), respectively. However, by definition,
H
( f − f
k
) = H( f ), and under the assumption that c
(n)and
g
(n) have unity gain, flat frequency responses over the band-
width of the kth analysis filterbank bin, we have, as required,
that
S
x
k
d
k
( f ) = S
ss
f − f
k
H( f )
2
. (A.5)
ACKNOWLEDGMENTS
The author thanks Ken Lever, John Tsimbinos, and Lang
White for their helpful discussions relating to this work. The
work was undertaken while the author was also affiliated with
the Institute for Telecommunications Research, University of
South Australia.
REFERENCES
[1] E. R. Ferrara Jr., “Frequency-domain adaptive filtering,”
in Adaptive Filters,C.F.N.CowanandP.M.Grant,Eds.,
Prentice-Hall, Englewood Cliffs, NJ, USA, 1985.
[2] R. E. Crochiere and L. R. Rabiner, Multirate Digital Signal
Processing, Prentice-Hall, Englewood Cliffs, NJ, USA, 1983.
[3] J. R. Treichler, S. L. Wood, and M. G. Larimore, “Some dy-
namic properties of transmux-based adaptive filters,” in Proc.
23rd Asilomar Conference on Signals, Systems and Comput-
ers, vol. 2, pp. 682–686, Pacific Grove, Calif, USA, October–
November 1989.
[4] L. B. Milstein and P. K. Das, “Spread spectrum receiver using
surfaceacousticwavetechnology,” IEEE Trans. Communica-
tions, vol. COM-25, no. 8, pp. 841–847, 1977.
[5] L. B. Milstein and P. K. Das, “An analysis of a real-time trans-
form domain filtering digital communication system: part I:
narrow-band interference rejection,” IEEE Trans. Communi-
cations, vol. COM-28, no. 6, pp. 816–824, 1980.
[6] G. Parker, Frequency domain restoration of communications
signals, Ph.D. dissertation, University of South Australia, Ade-
laide, South Australia, Australia, March 2001.
[7]B.WidrowandS.D.Stearns, Adaptive Signal Processing,
Prentice-Hall, Englewood Cliffs, NJ, USA, 1985.
[8] F. A. Reed and P. L. Feintuch, “A comparison of LMS adaptive
cancellers implemented in the frequency domain and the time
domain,” IEEE Trans. Circuits and Systems,vol.28,no.6,pp.
610–615, 1981.
[9] M. Dentino, J. McCool, and B. Widrow, “Adaptive filtering in
the frequency domain,” Proceedings of the IEEE, vol. 66, no.
12, pp. 1658–1659, 1978.
[10] S. Weiss, On Adaptive Filtering in Oversampled Subbands,
Ph.D. dissertation, University of Strathclyde, Glasgow, UK,
1998.
[11] S. Weiss, S. R. Dooley, R. W. Stewart, and A. K. Nandi, “Adap-
tive equalisation in oversampled subbands,” IEE Electronics
Letters, vol. 34, no. 15, pp. 1452–1453, 1998.
[12] A. Gilloire and M. Vetterli, “Adaptive filtering in subbands
with critical sampling analysis, experiments, and application
to acoustic echo cancellation,” IEEE Trans. Signal Processing,
vol. 40, no. 8, pp. 1862–1875, 1992.
[13] A. Fertner, “Frequency-domain echo canceller with phase ad-
justment,” IEEE Trans. on Circuits and Systems II: Analog and
DigitalSignalProcessing, vol. 44, no. 10, pp. 835–841, 1997.
[14] W. Kellermann, “Analysis and design of multirate systems for
cancellation of acoustical echoes,” in Proc. IEEE Int. Conf.
Acoustics, Speech, Signal Processing, vol. 5, pp. 2570–2573, New
York, NY , USA, April 1988.
2052 EURASIP Journal on Applied Signal Processing
[15] T. Gansler, “A robust frequency-domain echo canceller,” in
Proc. IEEE Int. Conf. Acoustics, Speech, Signal Processing, vol. 3,
pp. 2317–2320, Munich, Germany, April 1997.
[16] R. W. Stewart, S. Weiss, D. Garcia-Alis, and G. Freeland, “Sub-
band adaptive equalization of time-varying channels,” in Proc.
33rd Asilomar Conference on Signals, Systems and Computers,
vol. 1, pp. 534–538, Pacific Grove, Calif, USA, October 1999.
[17] T. I. Laakso, V. Valimaki, M. Karjalainen, and U. K. Laine,
“Splitting the unit delay,” IEEE Signal Processing Magazine,
vol. 13, no. 1, pp. 30–60, 1996.
Gareth Parker obtainedanHonoursde-
gree in electrical and electronic engineering
from the University of Adelaide in 1990. In
2001, he was awarded a Ph.D. by the Univer-
sity of South Australia, for his thesis entitled
“Frequency domain restoration of commu-
nications signals.” He works for the Defence
Science and Technology Organisation, Aus-
tralia, with current interests in spread spec-
trum communications, adaptive filters, and
frequency domain processing.