Báo cáo hóa học: " A Robust Color Object Analysis Approach to Efficient Image Retrieval" pdf
Bạn đang xem bản rút gọn của tài liệu. Xem và tải ngay bản đầy đủ của tài liệu tại đây (3.77 MB, 15 trang )
EURASIP Journal on Applied Signal Processing 2004:6, 871–885
c
2004 Hindawi Publishing Corporation
A Robust Color Object Analysis Approach
to Efficient Image Retrieval
Ruofei Zhang
Department of Computer Science, State University of New York, Binghamton, NY 13902, USA
Email:
Zhongfei (Mark) Zhang
Department of Computer Science, State University of New York, Binghamton, NY 13902, USA
Email: zhongf
Received 20 December 2002; Revised 1 December 2003
We describe a novel indexing and retrieval methodology integrating color, texture, and shape information for content-based image
retrieval in image databases. This methodology, we call CLEAR, applies unsupervised image segmentation to partition an image
into a set of objects. Fuzzy color histogram, fuzzy texture, and fuzzy shape properties of each object are then calculated to be
its signature. The fuzzification procedures effectively resolve the recognition uncertainty stemming from color quantization and
human perception of colors. At the same time, the fuzzy scheme incorporates segmentation-related uncertainties into the retrieval
algorithm. An adaptive and effective measure for the overall similarity between images is developed by integrating properties of
all the objects in every image. In an effort to further improve the retrieval efficiency, a secondary clustering technique is developed
and employed, which significantly saves query processing time without compromising retrieval precision. A prototypical system of
CLEAR, we developed, demonstrated the promising retrieval performance and robustness in color variations and segmentation-
related uncertainties for a test database containing 10 000 general-purpose color images, as compared with its peer systems in the
literature.
Keywords and phrases: content-based image retrieval, fuzzy logic, region-based features, object analysis, clustering, efficiency.
1. INTRODUCTION
The dramatic improvements in hardware technology have
made it possible in the last few years to process, store,
and retrieve huge amount of data in image databases. Ini-
tial attempts to manage pictorial documents relied on tex-
tual description provided by a human operator. This time-
consuming approach rarely captures the richness of visual
content of the images. For this reason researchers have fo-
cused on the automatic extraction of the visual content
of images to enable indexing and retrieval, in other word,
content-based image retrieval (CBIR). CBIR is aimed at effi-
cient retrieval of relevant images from large image databases
based on automatically derived features. These features are
typically extracted from shape, texture, and/or color proper-
ties of query image and images in the database. T he relevan-
cies between a query image and images in the database are
ranked according to a similarity measure computed from the
features.
In this paper we describe an efficient clustering-based
fuzzy feature representation approach—clustering-based ef-
ficient automatic region analysis technique, as we conve-
niently named CLEAR, to address general purposed CBIR.
We integrate semantic-intensive clustering-based segmenta-
tion with fuzzy representation of color histogram, texture,
and shape to index image databases. A low computational
yet robust distance metric is developed to reduce the query
time of the system. The response speed is further improved
significantly by using a novel secondary clustering technique
to achieve high scalability for large image databases. An
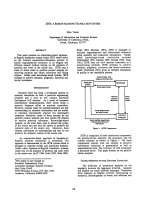
overview of the architecture of the proposed approach is
shown in Figure 1.
The remainder of this paper is organized as follows. In
Section 2,weprovideareviewofrelatedwork.Section 3
describes our clustering-based procedure. First, the unsu-
pervised image segmentation by applying clustering method
basedoncolorandtextureisdescribedinSection 3.1. Then
we give the definition of the fuzzy color histogram and fuzzy
feature representation reflecting texture and shape proper-
ties of each region in Sections 3.2 and 3.3,respectively.The
distance metric and comprehensive similarity calculation
based on region-pair distance are provided in Section 4.The
872 EURASIP Journal on Applied Signal Processing
Image database
Images
Image segmentation and feature
extraction in block level
Region
features
Fuzzy model generation and fuzzy
region feature calculation
Fuzzy region
features
Images
Index files for every
image
Fuzzy region
features
Fuzzy region
features
Secondary
clustering
in region space
Indexing file
association
3-level index tree
for region features
Candidate regions
searching
Region distance
metric
Region features
of candidate images
Query region
features
Image segmentation
and feature extraction
in block level
Query image
User
Retrieved images
with rank
Image similarity
measuring
Figure 1: Overview of the architecture of the proposed approach CLEAR.
proposed secondary clustering algorithm for fast searches in
the region vector space is introduced in Section 5. Section 6
presents the experiments we have performed on the COREL
image database and provides the results. Section 7 concludes
the paper.
2. RELATED WORK
A broad range of techniques [1] are now available to address
general purposed CBIR. The approaches based on these tech-
niques can be basically classified into two categories [2, 3]:
global-feature-based approach and region-feature-based ap-
proach. Global-feature-based approach [4, 5, 6, 7, 8, 9, 10]
extracts global features, such a s color, texture, shape, spa-
tial relationship, and appearance, to be the signature of each
image. The fundamental and most used feature is color his-
togram and its variants. It is used in many research and
commercial CBIR systems, for instance, IBM QBIC [5]and
Berkeley Chabot [11]. Color histogram is computationally
efficient and generally insensitive to small changes in camera
position. However, a color histogram provides only a coarse
characterization of an image; images with similar histograms
can have dramatically different appearance. The inaccuracy
raised in the color histogram approach is caused by the to-
tal loss of spatial information of pixels in the images. To at-
tempt to retain some kind of spatial information of color his-
togram, many heuristic methods have been developed. Pass
and Zabih [4] described a split histogram called color co-
herence vector (CCV). Each one of its buckets j contains
pixels having a given color j and two classes based on the
pixels spatial coherence. The image features can also be ex-
tended by successive refinement with buckets of a CCV, fur-
ther subdivided on the base of additional properties. Huang
et al. [6] proposed the use of color correlograms to inte-
grate color and s patial information. They set a number of
n of interpixels distance and, given a pixel of color c
i
,de-
fine a correlogram as a set of n matr ices γ
(k)
,whereγ
(k)
c
i
,c
j
is
the probability that a pixel at distance k away from the given
A Robust Color Object Analysis Approach to Image Retrieval 873
pixel is of color c
j
. Rao et al. [7] generalized the color spatial
distribution measurements by counting the color histogram
with certain geometric relationships between pixels of partic-
ular colors. It extends the spatial distribution comparison of
color histogram classes. Another histogram refinement ap-
proach is given by Cinque et al. [8]. They recorded the av-
erage position of each color histogram and their standard
devi ation to add some kind of spatial information on tra-
ditional histogram approach. Despite the improvement ef-
forts, these histogram refinements did not handle the inac-
curacy of color quantization and human perception of col-
ors, so the calculation of color histogram itself was inher-
ently not refined. Apart from color histogram, other feature-
extracting techniques have been tried in different ways. Rav-
ela a nd Manmatha [9] used a description of the image in-
tensity surface to be signatures. Gaussian derivative filters at
several scales were applied to the image and low-order 2D
differential invariants are computed to be features compared
between images. In their system, users selected appropriate
regions to submit a query. The invariant vectors correspond-
ing to these regions were matched with the database counter-
parts both in feature and coordinate spaces to y ield a match
scoreperimage.Thefeaturesextractedin[9] have higher
detail-depicting performance than color histogram to de-
scribe the content of one image. But this approach was time
consuming and required about 6 minutes to retrieve one im-
age.
All the above cited global-feature-based approaches share
one common limit: they handle low-level semantic queries
only. They are not a ble to identify object-level differences, so
they are not semantic-related and their performance is lim-
ited.
Region-feature-based approach is an alternative in CBIR.
Berkeley Blobworld [12], UCSB NeTra [13], Columbia Visu-
alSEEk [14], and Stanford IRM [15] are representative ones.
A region-based retrieval system segments images into regions
(objects), and retrieves images based on the similarity be-
tween regions. Berkeley Blobworld [12] and UCSB NeTra
[13] compare images based on individual regions. To query
an image, the user was required to select regions and the
corresponding features to evaluate similarly. Columbia Vi-
sualSEEk [14] partitioned an image in regions using a se-
quential labeling algorithm based on the selection of a sin-
gle color or a group of colors, called color set. For each re-
gion, they computed a binary color set using histogram back
projection. These individual-region-distance-based systems
have some common drawbacks. For example, they all have
complex interface and need the user’s prequery interaction,
which places additional burden on the user, especially when
the user is not a professional image analyst. In addition, lit-
tle attention has been paid to the development of similarity
measures that integrate information from all of the regions.
To address some of these drawbacks, Wang et al. [15] recently
proposed an integrated region matching scheme called IRM
for CBIR. They allowed for matching a region in one image
to several regions of another image; as a result the similar-
ity between the two images was defined as the weighed sum
of distances, in the feature space, between all regions from
different images. Compared with retrieval systems based on
individual regions, this scheme reduces the impact of inac-
curate segmentation by smoothing over the imprecision in
distance. Nevertheless, the representation of properties for
each region is simple and inaccurate so that most feature
information of a region is nullified. In addition, it fails to
explicitly express the uncertainties (or inaccuracies) in the
signature extraction; meanwhile, the weight assign scheme is
very complicated and computationally intensive. Later, Chen
and Wang [16] proposed an improved approach called UFM
based on applying “coarse” fuzzy model to the region fea-
tures to improve the retrieval effectiveness of IRM. Although
the robustness of the method is improved, the drawbacks ex-
isting in the previous work [15] were not alleviated. Recently
Jing et al. [17] presented a region-based modified inverted
file structure analogous to that in text retrieval to index the
image database; each entry of the file corresponds to a cluster
(called codeword) in the region space. While Jing’s method is
reported to be effective, the selection of the size of the code
book is subjective in nature, and the retrieval effectiveness is
sensitive to this selection.
To nar row the gap between content and semantics of im-
ages, some lately reported works in CBIR, such as [18, 19],
performed the image retrieval not only based on contents
but also heavily based on user preference profiles. Machine
learning techniques such as support vector machine (SVM)
[20]andBayesnetwork[21] were applied to learn the user’s
query intention through leveraging preference profiles or rel-
evance feedbacks. One drawback of such approaches is that
they work fine only for one specific domain, for example,
art image database or medical image database. It has been
shown that for a general domain, the retrieval accuracy of
these approaches are weak. In addition, these approaches are
restricted by the availability of user preference profiles and
the generalization limitation of machine learning techniques
they a pplied.
The objective of CLEAR is three-fold. First, we intended
to apply pattern recognition techniques to connect low-level
features to high-level semantics. Therefore, our approach
also falls into the region-feature-based category, as opposed
to indexing images in the whole image domain. Second,
we intended to address the color “inaccuracy” and image
segmentation-related uncertainty issues typically found in
color image retrieval in the literature. With this consider-
ation, we applied fuzzy logic to the system. Third, we in-
tended to improve the query processing time to avoid the
typical linear search problem in the literature; this drove us
to develop the secondary clustering technique currently em-
ployed in the prototype system CLEAR. As a result, com-
pared with the existing techniques and systems, CLEAR has
the following distinctive advantages: (i) it partially solves
the problem of the color inaccuracy and texture (shape)
representation uncertainty typically existing in color CBIR
systems, (ii) it develops a balanced scheme in similarity
measure between regional and global matching, and (iii)
it “preorganizes” image databases to fur ther improve re-
trieval efficiency without compromising retrieval effective-
ness.
874 EURASIP Journal on Applied Signal Processing
3. CLUSTERING-BASED FUZZY MATCHING
We propos e an efficient, clustering-based, fuzzified fea-
ture representation approach to address the general-purpose
CBIR. In this approach we integrate semantic-intensive
clustering-based segmentation with fuzzy representation of
color histogram, texture, and shape to index image databases.
3.1. Image segmentation
In our system, the query image and all images in the database
are first segmented into regions. The fuzzy feature of color,
texture, and shape are extracted to be the signature of each
region in one image. The image segmentation is based on
color and spatial variation features using k-means algorithm
[22]. We chose this algorithm to perform the image segmen-
tation because it is unsuperv ised and efficient, which is cru-
cial to segment general-purpose images such as the images
on the World Wide Web.
To segment an image, the system first partitions the im-
age into blocks with 4 ∗ 4 pixels to compromise between tex-
ture effectiveness and computation time, then extrac ts a fea-
ture vector consisting of six features from each block. Three
of them are average color components in a 4 ∗ 4 pixel size
block. We use the CIELAB color space because of its de-
sired property that the perceptual color difference is pro-
portional to the numerical difference. These features are de-
noted as {C
1
, C
2
, C
3
}. The other three features represent en-
ergy in the high-frequency bands of the Haar wavelet trans-
form [23], that is, the square root of the second-order mo-
ment of wavelet coefficients in high-frequency bands. To ob-
tain these moments, a Haar wavelet transform is applied to
the L component of each pixel. After a one-level wavelet
transform, a 4 ∗ 4 block is decomposed into four frequency
bands; each band contains 2 ∗ 2coefficients. Without loss
of generality, suppose the coefficients in the HL band are
{c
k,l
, c
k,l+1
, c
k+1,l
, c
k+1,l+1
}. Then we compute one feature of
this block in HL band as
f
=
1
4
1
i=0
1
j=0
c
2
k+i,l+ j
1/2
. (1)
The other two features are computed similarly from the
LH and HH bands. These three features of the block a re de-
noted as {T
1
, T
2
, T
3
}. They can be used to discern texture by
showing L variations in different directions.
Afterweobtainfeaturevectorsforallblocks,weperform
normalization on both color and texture features to whiten
them, so the effects of different feature range are eliminated.
Then the k-means algorithm [22] is used to cluster the fea-
ture vectors into several classes with each class correspond-
ing to one region in the segmented image. Because cluster-
ing is performed in the feature space, blocks in each clus-
ter do not necessarily form a connected region in the im-
age. This way, we preserve the natural clustering of objects
in general-purpose images. The k-means algorithm does not
specify how many clusters to choose. We adaptively select the
number of clusters C by gradually increasing C until a stop
criterion is met. The average number of clusters for all images
in the database changes in according with the adjustment of
the stop criteria. In the k-means algor i thm we use a color-
texture weighted L2 distance metric
w
c
3
i=1
C
(1)
i
− C
(2)
i
2
+ w
t
3
i=1
T
(1)
i
− T
(2)
i
2
(2)
to describe the distance between block features, where the
C
(1)
(C
(2)
)andT
(1)
(T
(2)
) are color features and texture fea-
tures, respectively, of the two blocks. At this time, we set
weight w
c
= 0.65 and w
t
= 0.35 based on the trial-and-error
experiments. Color property is assigned more weight because
of the effectiveness of color to describe the image and the rel-
ative simple description of texture features.
After segmentation, three additional features are calcu-
lated for each region to describe shape property. They are
normalized inertia [24]oforder1to3.ForaregionH in 2-
dimensional Euclidean integer space Z
2
(an image), its nor-
malized inertia of order p is
l(H, p) =
(x,y):(x,y)∈H
(x −
ˆ
x)
2
+(y −
ˆ
y)
2
p/2
V(H)
1+p/2
,(3)
where V (H) is the number of pixels in the region H and
(
ˆ
x,
ˆ
y) is the centroid of H. The minimum normalized inertia
is achieved by spheres. Denoting the pth order normalized
inertia of spheres as L
p
, we define following features to de-
scribe the shape of each region:
S
1
=
l(H,1)
L
1
, S
2
=
l( H,2)
L
2
,
S
3
=
l( H,3)
L
3
.
(4)
3.2. Fuzzy color histogram for each region
The color representation would be coarse and imprecise if we
simply extract color feature of one block (the representative
block) to be the color signature of each region as Wang et al.
[15] did. Color is one of the most fundamental properties to
discriminate images, so we should take advantage of all avail-
able information in it. Taking the uncertainty stemmed from
color quantization and human perception of colors into con-
sideration, we devised a modified color histogram descriptor
utilizing the fuzzy technique [25, 26] to handle the fuzzy na-
ture of colors in each region. The reason we treat color prop-
erty this way is two-fold: (i) we want to characterize the local
property of colors precisely and robustly and (ii) color com-
ponent in the region features is extracted more accurate than
texture and shape and it is more reliable to describe the se-
mantics of images.
In our color descriptor, fuzzy paradigm-based techniques
[27] are applied to the color distribution in each region. The
key point is that we assume each color is a fuzzy set while the
correlation among colors are modeled as membership func-
tions of fuzzy sets. A fuzzy set F on the feature space R
n
is de-
fined by a mapping µ
F
: R
n
→ [0, 1] named the membership
A Robust Color Object Analysis Approach to Image Retrieval 875
function. For any feature vector f ∈ R
n
, the value of µ
F
( f )is
called the degree of membership of f to the fuzzy set F (or, in
short, the degree of membership to F).Avaluecloserto1for
µ
F
( f ) means more representative the feature vector f to the
fuzzy set F. For a fuzzy set F, there is a smooth transition for
the degree of membership to F besides the hard cases f ∈ F
(µ
F
( f ) = 1) and f/∈ F (µ
F
( f ) = 0). It is clear that a fuzzy set
degenerates to a conventional set if the range of µ
F
is {0, 1}
instead of [0, 1] (µ
F
is then called the characteristic function of
the set). Readers are referred to [28] for more fundamentals
of fuzzy set.
The fuzzy model of color descriptor we choose should
admit that the resemblance degree decreases as the intercolor
distance increases. The natural choice, according to the im-
age processing techniques, is to impose a smooth decay of
the resemblance f unction with respect to the intercolor dis-
tance. As we pointed out above, the LAB color space is sup-
posed to offer the equivalence b etween the perceptual inter-
color distance and the Euclidean distance between their coor-
dinate representations. Practical considerations and the an-
alytical simplification of the computational expressions de-
mand the use of a unified formula for the resemblance de-
gree function (equivalent to the membership function). A
formula with linear descent would require little computa-
tion but could contradict the smooth descent principle. The
most commonly used prototype membership functions are
cone, trapezoidal, B-splines, exponential, Cauchy, and paired
sigmoid functions [29]. Since we could not think of any in-
trinsic reason why one should be preferred to any other, we
tested the cone, trapezoidal, exponential, and Cauchy func-
tions on our system. In gener al, the performance of the ex-
ponential and the Cauchy functions is better than that of
the cone and trapezoidal functions. Considering the compu-
tational complexity, we pick the Cauchy functions because
it requires much less computations. The Cauchy function,
C : R
n
→ [0, 1], is defined as
C(
x ) =
1
1+
x −
v /d
α
,(5)
where
v ∈ R
n
, d, α ∈ R, d>0, α ≥ 0,
v is the center lo-
cation (point) of the fuzzy set, d represents the width of the
function, and α determines the shape (or smoothness) of the
function. Collectively, d and α describe the grade of fuzziness
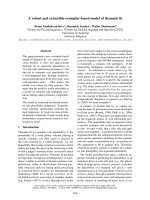
of the corresponding fuzzy feature. Figure 2 illustrates the
Cauchy function in R with v = 0, d = 36, and α varying from
0.01 to 100. As we can see, the Cauchy function approaches
the characteristic function of open inter val (−36, 36) when
α goes to positive infinity. When α equals 0, the degree of
membership for any element in R (except 0 whose degree of
membership is always 1 in this example) is 0.5.
Accordingly, the color resemblance in a region is defined
as
µ
c
(c
) =
1
1+
d(c, c
)/σ
α
,(6)
where d is the Euclidean distance between color c and c
in
100806040200−20−40−60−80−100
x
0
0.1
0.2
0.3
0.4
0.5
0.6
0.7
0.8
0.9
1
Membership-C(x)
2d
Figure 2: Cauchy functions in one dimension.
LAB space and σ is the average distance between colors,
σ =
2
B(B − 1)
B−1
i=1
B
k=i+1
d(c, c
), (7)
where B is the number of bins in the color partition. The av-
erage distance between colors is used to approximate the ap-
propriate width of the fuzzy membership function. The ex-
periments show that the color model performance changes
insignificantly when α is in the interval [0.7, 1.5], but de-
grades rapidly outside the interval. So we set α = 1in(6)
to simplify the computation.
This fuzzy color model enables us to enlarge the influence
of a given color to its neighboring colors according to the un-
certainty principle and the perceptual similarity. This means
that each time a color c is found in the image, it wil l influence
all the quantized colors according to their resemblance to the
color c. Numerically, this could be expressed as
h
2
(c) =
c
∈µ
h
1
(c
)µ
c
(c
), (8)
where µ is the color universe in the image and h
1
(c
) is the
usual normalized color histogram. Finally the normalized
fuzzy color histogram is calculated with
h(c)
=
h
2
(c)
max
c
∈µ
h
2
(c
)
(9)
which falls in the interval [0, 1].
From the signal processing perspective, this fuzzy his-
togram oper ation is in fact a linear convolution between the
usual color histogram and the fuzzy color model. This convo-
lution expresses the histogram smoothing provided that the
color model is indeed a smoothing, low-pass filtering kernel.
The use of the Cauchy shape form as color model produces
the smoothed histogram, which is a mean for the reduction
of quantization errors [30].
876 EURASIP Journal on Applied Signal Processing
In our system, the LAB color space is quantized into 96
bins by using uniform quantization (L by 6, A by 4, and B by
4). Then formula (9) is used to calculate the fuzzy histogram
for each region. To reduce the online computation, µ
c
(c
)for
each bin is precomputed and implemented as a lookup table.
3.3. Fuzzy representation of texture
and shape for each region
To accommodate the imprecise image segmentation and un-
certainty of human perception, we propose to fuzzify each
region generated from image segmentation by a fixed pa-
rameterized membership function. The parameter for the
membership functions is calculated using the clustering re-
sults. The fuzzification of feature vectors brings in a cru-
cial improvement on the region representation of an image:
fuzzy features naturally characterize the gradual transition
between regions within an image. In our proposed repre-
sentation scheme, a fuzzy feature set assigns weights, called
degree of membership, to feature vectors of each block in
the feature space. As a result, feature vector of a block usu-
ally belongs to multiple regions with different degrees of
membership as opposed to the classical region representa-
tion, in which a feature vector belongs to exactly one region.
This fuzzification technique has two major advantages: (i) it
makes the retrieval system more accurate and robust to im-
age alterations such as intensity variation, color distortion,
shape distortion, and so forth, (ii) it better extracts useful in-
formation under the same uncertain conditions, that is, it is
more robust to imprecise segmentation.
Our approach is to treat each region as a fuzzy set of
blocks. To make our fuzzification scheme unified to be con-
sistent with the fuzzy color histogram representation, we
again use the Cauchy function to be our fuzzy membership
function
µ
i
( f ) =
1
1+
d
f ,
ˆ
f
i
σ
α
, (10)
where f ∈ R
k
(in our approach, k = 3) is the texture feature
vector of each block,
ˆ
f
i
is the average texture feature vector
of region i, d is the Euclidean distance between
ˆ
f
i
and any
feature f ,andσ represents the average distance for texture
features between cluster centers we get from the k-means al-
gorithm. σ is defined by
σ =
2
C(C − 1)
C−1
i=1
C
k=i+1
ˆ
f
i
−
ˆ
f
k
, (11)
where C is the number of regions in a segmented image and
ˆ
f
i
is the average texture feature vector of region i.
A region is described as a fuzzy set to which each block
has a membership so that a hard segmentation is avoided and
the uncertainties stemming from inaccurate image segmen-
tation is addressed explicitly.
Accordingly, by making use of this block membership
functions, the fuzzified texture properties of region i is rep-
resented as
ˆ
f
T
i
=
f ∈U
T
fµ
i
( f ), (12)
where U
T
is the feature space composed by texture features
of all blocks.
Based on the fuzzy membership function µ
i
( f ) obtained
in a similar fashion, we also fuzzify the shape property repre-
sentation of region i by modifying (3)as
l(i, p) =
f ∈U
S
f
x
−
ˆ
x
2
+
f
y
−
ˆ
y
2
p/2
µ
i
( f )
[N]
1+p/2
, (13)
where N is the number of blocks in an image and U
S
is the
blockfeaturespaceinanimage.Basedon(4)and(13), we
calculate the fuzzified shape feature
ˆ
f
S
i
≡{S1, S2, S3} of each
region.
4. REGION MATCHING AND SIMILARITY
CALCULATION
Now we have fuzzy histogram representation (9)tocharac-
terize color property, while the texture and shape properties
are characterized by fuzzy features
ˆ
f
T
i
and
ˆ
f
S
i
,respectively,
for each region. To eliminate the effect of different ranges, we
apply normalization on these features before they are writ-
ten to the index files. As a summary, for each region, we
record following information to be its indexed feature: (1)
fuzzy color histogram h(c); (2) fuzzy texture feature
f
T
;(3)
fuzzy shape feature
f
S
; (4) the relative size of the reg ion to the
whole image w; and (5) the central coordinate of the region
area (
ˆ
x,
ˆ
y).
For an image in the database, such information of all re-
gions in the image is recorded as the signature of the image.
Based on these fuzzified features for regions in every im-
age, a fuzzy matching scheme is developed to calculate the
distance between any two regions p and q; and the overall
similarity measurement between images is derived.
For fuzzy texture and shape features, we apply the L2 dis-
tance formula as
d
pq
T
=
f
T
p
− f
T
q
,
d
pq
S
=
f
S
p
− f
S
q
,
(14)
respectively.
For fuzzy histogram, we use the distance formula as
d
pq
C
=
B
i=1
h
p
(i) − h
q
(i)
2
B
, (15)
where B is the number of bins, 96 in our system, and h
p
(i)
and h
q
(i) are fuzzy histograms of regions p and q,respec-
tively.
A Robust Color Object Analysis Approach to Image Retrieval 877
The intercluster distance on color and texture between
regions p and q is depicted as
d
pq
CT
=
d
pq
C
2
+ d
pq
T
2
. (16)
The comprehensive distance between the two regions is de-
fined as
DIST(p, q) = wd
pq
CT
+(1− w)d
pq
S
. (17)
We set w at 0.7 in our system. Since all components are nor-
malized, this comprehensive distance between the two re-
gions is also normalized. The reason for setting w at 0.7
stems from the fact that we find some images to be object-
dependent in the testing image database, such as animals
and plants. However some other images, such as scenic im-
ages comprising of land, sea water, or mountains, have shape
component that vary widely between the images of the same
semantics. This can cause the retrie val engine to return false
positives. Note that object-based images tend to have a cer-
tain similarity in their color-texture structure generally, in
the sense that their color-texture scheme does not vary wildly
between images of the same semantics, that is, they have a
color-texture pattern that will be one of the some patterns
that belong to that particular objects’ image class. So we de-
cided to give less weight to shape feature and it is appropriate
per our experiment results.
It is clear that the resemblance (or, equivalently, distance)
of two images is conveyed through the similarities between
regions from both images. Thus it is desirable to construct
the image-level distances (dissimilarity) using region-level
distances. Since image segmentation is usually not perfect,
a region in one image could correspond to several regions in
another image. For example, a segmentation algorithm may
segment a n image of dog into two regions: the dog and the
background. The same algorithm may s egment another im-
age of a dog into five regions: the body of the dog, the front
leg(s) of the dog, the rear leg(s) of the dog, the background
grass, and the sky. There are similarities between the dog in
the first image and the body, the front leg(s), or the rear leg(s)
of the dog in the second image. The background of the first
image is also similar to the background grass or the sky of the
second image. However, the dog in the first image is unlikely
to be similar to the background grass and sky in the second
image.
Using the fuzzy feature representation, these similarity
(equivalently, distance) observations can be expressed as
(i) the distance measure, given by (17), for the fuzzy fea-
tures of the dog in the first image and the fuzzy features
of the dog body, front leg(s), or rear leg(s) in the sec-
ond image is low (e.g., close to 0);
(ii) the distance measure for the fuzzy feature of the back-
ground in the first image and the fuzzy features of the
background grass or sky in the second image is also
low;
(iii) the distance m easure for the fuzzy feature of the dog in
the first image and the fuzzy feature of the background
grass in the second image is high (i.e., close to 1). The
distance measure for the fuzzy feature of the dog in
the first image and the fuzzy feature of the sky in the
second image is also hig h.
Based on these qualitative illustrations, it is natural to
think of the mathematical meaning of the word “or,” that
is, the union operation. What we have described above
is essentially the matching of a fuzzy feature with the
union of some other f uzzy features. The distance function
d(i, J) = Mi n
k
[d(i, J
k
)] between a region i and a region
set J (J
k
enumerates regions in J) in the region distance met-
ric space has the property of the required union operation.
Based on this motivation, we construct the image (a set of
regions) distance measure through the following steps.
Suppose now we have M regions in image 1 and N re-
gions in image 2.
Step 1. Calculate the distance b etween one region in image 1
and all reg ions in image 2. For each region i in image 1, the
distance between it to whole image 2 is
R
iImage2
= Min
DIST(i, j)
, (18)
where j is each region in image 2. Thus, we calculate the min-
imal distance between a region with all regions in another
image (image 2) to be the distance between this region and
the image, which means that we maximize the potential sim-
ilarity between a region and an image.
Step 2. Similarly, we get the distance between a region j in
image 2 to image 1
R
jImage1
= Min
DIST( j, i)
, (19)
where i is each region in image 1.
Step 3. After obtaining M + N distances, we define the dis-
tance between the two images (1 and 2) as
DistIge(1, 2) =
M
i=1
w
1i
R
iImage2
+
N
j=1
w
2j
R
jImage1
2
, (20)
where w
1i
is the weight for each region in image 1. We set
w
1i
= N
1i
/N
1
,whereN
1i
is the number of blocks in region i
and N
1
is the total number of blocks in image 1. w
2 j
is defined
similarly for image 2. In this way bigger regions are given
more significance than smaller regions because we think that
big regions are more semantically related to the subject of
one image. We can compensate for the inaccuracy of cluster-
ing algorithm by using this integrated-region-distance for-
mula so that the error of similarity calculated is reduced
greatly.
For each query, the DistIge(q, d) is calculated for each im-
age d in the database and sort their value to retrieve relevant
images.
We briefly discuss the advantages of this image distance
measures as follows.
878 EURASIP Journal on Applied Signal Processing
(i) It can be shown that, if images 1 and 2 are the same,
DistIge(1, 2) = 0; if images 1 and 2 are quite differ-
ent, that is, region distances between region pairs from
the two images are high, DistIge(1, 2) is high too. This
property is desirable for CBIR ranking.
(ii) To provide a comprehensive and robust “view” of dis-
tance measure between images, the region-level dis-
tances are combined, weighted, and added up to pro-
duce the image-level distance measure which depicts
the overall difference of images in color, texture, and
shape properties. The comprehensiveness and robust-
ness of this distance metric can be examined from two
perspectives. On one hand, each ent ry in (20) signifies
the degree of closeness between a fuzzy feature in one
image and all fuzzy features in the other image. Intu-
itively, an entry expresses how similar a region of one
image is to all regions of the other image. Thus one re-
gion is allowed to be matched with several regions in
case of inaccurate image segmentation in which prac-
tice occurs quite often. On the other hand, by weighted
summation, every fuzzy feature in both images con-
tributes a portion to the overall distance measure. This
further reduces the sensitivit y of the distance measure.
Based upon the above comparison, we expect that, un-
der the same uncertain conditions, the proposed region-
matching scheme can maintain more information from the
image.
5. SECONDARY CLUSTERING AND IMAGE RETRIEVAL
The time of image retrieval depends largely on the number
of images in the database in almost all CBIR systems. Many
existing systems attempt to compare the query image with
every image in the database to find the top matching im-
ages, resulting in an essentially linear search, which is time-
prohibitive when the database is large. We believe that it is
not necessary to conduct a whole database comparison. In
fact, it is possible to exploit a priori information regarding
the “organization” of the images in the database in the fea-
ture space before a query is posed, such that when a query
is received, only a part of the database needs to be searched
while a large portion of the database may be eliminated. This
certainly reduces significant query processing time without
compromising the retrieval precision.
To achieve this goal, in CLEAR we add a preretrieval
screening phase to the feature space after a database is in-
dexed by applying a secondary k-means clustering algorithm
in the region feature vector space to cluster all the regions
in the database into classes with the distance metric DIST
pq
.
The rationale is that regions with similar (color, texture,
shape) features should be grouped together in the same class.
This secondary clustering is performed offline, and each re-
gion’s indexing data along with its associated class informa-
tion are recorded in the index files. Consequently, in the pro-
toty pe implementation of CLEAR, the image database is in-
dexed in terms of a three-level tree structure, one for the
region level, one for the class level, and one for the image
level.
Assuming that an image database is indexed based on the
features defined in Sections 3 and 4, and is “organized” based
on the secondary clustering, given a query image, CLEAR
processes the query in 4 steps.
Step 1. Perform the query image segmentation to obtain re-
gions, Q
i
, i ∈ [0, V − 1], where V is the number of regions in
the query image.
Step 2. Compute the distances between each region Q
i
and
all class centroids in the database to determine which class Q
i
belongs to by the minimum-distance-win principle. Assume
that the region Q
i
belongs to class C
j
, j ∈ [0, K − 1], where K
is the number of classes to which all regions are partitioned.
Step 3. Retrieve all regions in the database which belongs to
the class C
j
. A region set T
jd
comprises these regions. The
images containing any regions in the set T
jd
are subsequently
retrieved from the index structure. These images comprise an
image set I
d
.
Step 4. Compare the query image with the images in the im-
age set I
d
. The distance DistIge is used for each pair and the
top-least-distance images are returned in the retrieval.
Three advantages are achieved through this secondary
clustering procedure. First, it enhances the robustness of the
image retrieval. Minor appearance variations in color, tex-
ture, and shape within and among regions do not distort the
similarity measures due to the clustering in the region fea-
ture space which groups similar region features together in
respective classes. Therefore, minor alterations in region fea-
tures are nullified. Second, linear search is prevented with
this retrieval algorithm. In other words, many statistically
dissimilar images are excluded from comparison; only those
potentially relevant images are chosen to be compared with
the query image. Third, the effects of imprecise secondary
clustering is controlled and mitigated because the second
clustering is performed on the region feature space while the
final image similarity measures are in the image space and
are based on integrated region matching. In this way, the fi-
nal image distance calculated with (20) is the “real” distance
(not approximated) and the retrieval precision is not com-
promised.
The efficiency improvement of the proposed retrieval al-
gorithm is analyzed as follows. Suppose n is the number of
images in the database, l is the average number of regions of
an image, and c is the number of classes obtained with the
secondary clustering technique in the region feature space.
Then nl is the total number of regions. In the average case,
the number of regions associated with a class is q
= nl/c,
which is also the number of regions to compare with a query
region (one query region is associated with only 1 class in
the proposed algorithm). We call these regions “candidate
regions.” Each candidate region corresponds to one image
in the database. Thus, the total number of different images
A Robust Color Object Analysis Approach to Image Retrieval 879
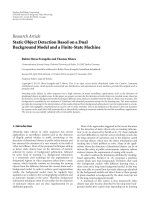
Figure 3: Sample images in the testing database. The images in each column are assigned to one category. From left to right, the categories
are Africa rural area, historical building, waterfalls, British royal event, and model portrait, respectively.
in the database to be compared with the query image is
λlq = λnl
2
/c,whereλ is the ratio that describes the region-
to-image correspondence relationship, λ ∈ [1/l,1].Thenwe
observe that the average number of different images to be
compared is bounded in [nl/c, nl
2
/c]. l is determined by the
resolution of the image segmentation and is typically small
(4 to 6 in our implementation), while c is determined by the
granularity of the secondary clustering in the region feature
space (in our experiment on the testing database, the value of
c has the magnitude order of the number of categories in the
database, i. e., 100–200). When l
2
/c < 1, which is realistic and
feasible in large size databases with many different semantic
categories, it is guaranteed that the number of different im-
ages chosen to compare with the query image is smaller than
n. The size of candidate images is reduced (the reduction ra-
tio is in [c/l
2
, c/l]), thus the query processing time is saved
proportionally with reduced I/O accesses and computation
needed assuming that the class information resides in main
memory.
6. EXPERIMENTS AND RESULTS
We implemented the CLEAR method in a prototype sys-
tem. For the discussion and reference purpose, we also call
the prototype CLEAR. The following reported evaluations
were performed in a general-purpose color image database
containing 10 000 images from the COREL collection of 96
semantic categories, including people, nature scene, build-
ing, and vehicles. No prerestriction on camera models, light-
ing conditions, and so forth are sp ecified in the image
database for the testing. These images are all in JPEG for-
mat. We chose this database to test the CLEAR method
because it is accessible to the public and is used in the
evaluations of several state-of-the-art CBIR systems, for ex-
ample, IRM [15]andUFM[16]. The database is accessi-
ble at />Figure 3 shows some samples of the images belonging to a
few semantic categories in the database. Each semantic cat-
egory in this image database has 85–120 associated images.
From this database 1 500 images were randomly chosen from
all categories as the query set. A retrieved image is consid-
ered a match if it belongs to the same category of the query
image. We note that the category information in the COREL
collection is only used to simplify the evaluation; we did not
make use of any such information in the indexing and re-
trieval processing.
We implemented the system on a Pentium III 800 MHz
computer with 256 M memory. After performing the image
segmentation described in Section 3.1 , the homogenous re-
gions of each image were obtained. The original k-means
880 EURASIP Journal on Applied Signal Processing
(a) (b)
(c) (d)
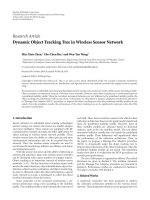
Figure 4: Regions obtained for two example images; each region is labeled with the average color of blocks belonged to it. (a) Image 65003.
(b) Segmented image (4 regions). (c) Image 17821. (d) Segmented image (5 regions).
clustering algorithm was altered to address unknown num-
ber of regions in an image for image segmentation. We adap-
tively selected the number of clusters C by gradually increas-
ing C until a stop criterion was met. The average number of
regions for all images in the database changes in accordance
with the adjustment of the stop criteria. Figure 4 shows the
segmentation results for two example images. In this figure,
(a) and (c) are two images in the database, and (b) and (d) are
their region representations, respectively. Each region seg-
mented is labeled by the average color of all the blocks asso-
ciated with the region. As noted, 4 regions were obtained for
image 65003 and 5 regions were obtained for image 17821.
The segmentation results indicate that the regions extracted
are related to the objects embodying image semantics. In
our experiment totally 56 722 regions were extracted for all
10 000 images in the database, which means that in average
5.68 regions are extracted in image. Image segmentation for
the testing database took 5.5 hours to be done, about 1.9sec-
onds for each image.
Consequently the fuzzy color histogram, fuzzy tex-
ture, and fuzzy shape features are determined for each re-
gion. Based on these feature of all regions extracted for
the database, a three-level indexing structure was built of-
fline. All regions are partitioned into several classes through
performing adaptive k-means algorithm. For our testing
database, the number of classes is determined to be 677 with
the maximal number of regions in one class being 194 and
the minimal number of regions in one class being 31. For
each class, a hash table mapping the associated regions and
the corresponding image names in the database is main-
tained. The generation of the three-level indexing structure
took 70 minutes in the experiment. Although it is time con-
suming for offline indexing, the online query is fast. In aver-
age, the query time for returning top 30 images was less than
1 second. The retrieval interface of the prototype system is
shown in Figure 5.
Figure 5: A screenshot of the prototype system CLEAR. The query
image is in the top left pane and the retrieval results are returned in
the right pane.
To illustra te the performance of the approach, se veral ex-
amples are shown in Figure 6 where 5 images with different
semantics: flowers, dinosaurs, vehicles, African people, and
dishes are picked as query images. For each query example,
we examine the precision of the query results depending on
the relevance of the image semantics. The semantic relevance
evaluation is based on the group membership of the query
image, which is done by human subjective observation. In
Figure 6, the top-left corner image is the query a nd the rank-
ing goes rightward and downward.
To evaluate our approach more quantitatively, we com-
pared CLEAR w ith the UFM [16] system, one of the state-
of-the-art CBIR systems, on the retrieval effectiveness. Re-
trieval effectiveness is measured by recall and precision met-
rics [31]. For a given query and a given number of images
A Robust Color Object Analysis Approach to Image Retrieval 881
(a) (b)
(c) (d)
(e)
Figure 6: Retrieval results of the five queries evaluated. The top-left corner image is the query and the ranking goes rightward and downward.
(a) Flower; 16 matches out of 16. (b) Dinosaur; 16 matches out of 16. (c) Vehicle; 16 matches out of 16. (d) African people; 12 matches out
of 16. (e) Dish; 11 matches out of 16.
retrieved, precision gives the r atio between the number of
relevant images retrieved and the number of retrieved im-
ages (measures the retrieval accuracy). Recall gives the ratio
between the number of relevant images retrieved and the to-
tal number of relevant images in the collection considered
(measures the missing ratio):
Precision =
|relevant ∩ results|
|results|
,
Recall
=
|relevant ∩ result|
|relevant|
.
(21)
The average precision results of the 1500 query images for
different number of returned images are recorded in Figure
7, which demonstrates that the retrieval precision of CLEAR
is generally superior to that of UFM.
Because the number of relevant images for a query image
in the large image database is difficult to be determined accu-
rately in advance, for the sake of simplicity we supposed that
the number of images in the semantic category to which the
query image belongs is the number of relevant images in the
database. In this way of evaluation, the recalls of CLEAR and
UFM for different number of returned images are plotted in
Figure 8.
The average recalls of CLEAR and UFM are comparable
and the advantages of CLEAR to UFM are shown more
882 EURASIP Journal on Applied Signal Processing
Table 1: Retrieval efficiency and scalability results.
Database size
Average number of
compared images
Average percentage
of images examined
Average search overhead
in CLEAR (s)
Average query
processing time in
CLEAR (s)
Average query
processing time in
linear search (s)
3000 795 26.5% 0.08 0.55 1.78
6000 1668 27.8% 0.12 0.79 3.04
10000 2832 28.3% 0.15 0.98 3.96
100908070605040302010
Number of images returned
0.10
0.15
0.20
0.25
0.30
0.35
0.40
0.45
0.50
Average precision
CLEAR
UFM
Figure 7: Average precision comparisons between CLEAR and
UFM.
clearly when the number of images returned on which we
calculate the average recall statistics increases. In other word,
CLEAR has more potential than UFM on the retrieval recall
performance. The better effectiveness is attributed in part to
the more accurate representation of color, texture, and shape
with the fuzzy model in our system.
For an example of retrieval precision comparison, Figure
9 shows the top 16 retrieved images in our system and UFM,
respectively, using one image in the “medieval building” cat-
egory as a query. For this query, 14 out of top 16 returned
images by CLEAR are relevant in comparison with 9 of those
returned by UFM.
To study the scalability of CLEAR, we incrementally
sample the original 10 000 image database to generate two
smaller databases, one with 3000 images and the other with
6000 images. These two databases contain sampled images
from all the 96 categories. For each of the three databases,
we randomly sample 100 images as the query set from the
corresponding database for this evaluation. We recorded
the average number of images compared in each of the
three databases using CLEAR secondary clustering tech-
nique. The average indexing str u cture search overhead, the
average query processing time in CLEAR, and the average
300250200150100500
Number of images returned
0.05
0.10
0.15
0.20
0.25
0.30
0.35
Average recall
CLEAR
UFM
Figure 8: Average recall comparisons between CLEAR and UFM.
query processing time in learn search were also recorded. The
results are documented in Ta ble 1 . It shows that the average
number of compared images is significantly reduced in com-
parison with the database size. In addition, as indicated in
Table 1, although the indexing structure search introduces
the computation overhead, the average total query process-
ing time is still much less than the average query processing
time in linear search due to the reduced number of images
to be compared with. The computation overhead for the in-
dexing structure search is small because the search performs
only several distance calculations and highly efficient hash
table searches. With the increase of the database size, the per-
centage of the images examined and the average computation
overhead remain relatively stable. The average query process-
ing time is much less than that in the linear search in all the
three testing databases. The average efficiency improvement
on the query processing time to the linear search is 72.7%.
This result, combined with the results obser ved in Figures 7
and 8,confirmsCLEAR’sefficiency in handling large image
databases without sacrificing retrieval effectiveness.
Since in CLEAR the size of the class level (clusters in the
region feature space) information is much smaller than the
index files for image in the database (in our experiments, the
A Robust Color Object Analysis Approach to Image Retrieval 883
(a) (b)
Figure 9: Retrieval comparisons of CLEAR and UFM using the image at the top-left pane of the window as the query. (a) Images found by
CLEAR (14 of 16 images are relevant). (b) Images found by UFM (9 of 16 images are relevant).
size ratio is 1/95–1/120), it is practical and desir able to put
the class level information in main memory. With such de-
sign, the I/O costs for each query are only proportional to the
number of images compared. The reduced I/O costs in the
CLEAR query processing were observed as shown in Table 1
as well.
In our indexing scheme, we use a Cauchy function to cor-
relate color descriptions and to smooth the regions (equiva-
lent to a convolution in computer vision) so that the color
perception uncertainty and segmentation inaccuracy issue
are addressed explicitly. To evaluate the effectiveness of the
indexing scheme for improving the robustness to color vari-
ations and segmentation-related uncertainties, we compare
the performance of CLEAR and UFM approaches for color
variations and coarseness of image segmentation. Color vari-
ations can be simulated by changing colors to their adjacent
values for each image, and the segmentation-related uncer-
tainties in an image can be characterized by entropy. For im-
age i with C segmented regions, its entropy, E(i), is defined
as
E(i)
=−
C
j=1
P
R
i
j
log
P
R
i
j
, (22)
where P(R
i
j
) is the percentage of image i covered by region
R
i
j
. The larger the value of entropy, the higher the uncer-
tainty level. As we can see, the entropy E(i) increases with
the increase of the number of regions C.Thus,wecanad-
just the uncertainty level by changing the value of C. C is
controlled by modifying the stop criter ia of the modified k-
means algorithm. For a fair comparison between CLEAR in-
dexing scheme and U FM at different color variation and un-
certainty levels, we perform the same experiments for differ-
ent degrees of color changes and average values of C (4.31,
6.32, 8.64, 11.62, and 12.25) on the 3000 image database in-
2520151050−5−10−15−20−25
Percentile variation
1
2
3
4
Average rank of the target image
CLEAR
UFM
Figure 10: Comparison of CLEAR indexing scheme and UFM
method on the robustness in the color variations. Every image in
the 3000 image database is altered and used as the query image.
troduced above. To e v aluate the robustness in the color vari-
ations, we apply color changes to an image (target image) in
the database. The modified image is then used as the query
image, and the rank of the retrieved target image is recorded.
Repeating the process for all images in the testing database,
the average rank for target images are computed for CLEAR
and UFM. The result is shown in Figure 10. The average
rank of the target image of CLEAR is lower than UFM for
each level of color variations (in an acceptable range of color
changes which do not affect semantics perception).
884 EURASIP Journal on Applied Signal Processing
1210864
Average number of regions C
0.28
0.30
0.32
0.34
0.36
0.38
0.40
0.42
Average precision
CLEAR
UFM
Figure 11: Comparison of CLEAR indexing scheme and UFM
method on the robustness in image segmentation uncertainties.
To evaluate the robustness in the segmentation-related
uncertainties, the performance in terms of overall average
precision in top 30 returned images are evaluated for both
approaches. The result is given in Figure 11.Aswehave
known, the entropy E(i) (uncertainty) level increases when
the image is segmented into more regions. At all uncertainty
levels, CLEAR performs better than or as well as the UFM
method. Combining these two experiments of robustness, we
observed that CLEAR indexing scheme is more robust than
UFM for color variations and segmentation-related uncer-
tainties. The performance di fferences between CLEAR and
UFM can be explained as follows. The UFM method uses
the representative feature (one feature vector) of each re-
gion to model the segmentation uncertainty, which is coarse
and artificial. The model generated is not accurate enough
to fit the segmented images well. However, CLEAR indexing
scheme leverages all block features in every region to gener-
ate fuzzy models for each feature component, thus describing
the segmentation-related uncertainty more precisely and ef-
fectively.
7. CONCLUSIONS
A novel image indexing and retrieval methodology, CLEAR,
is described. The methodology integrates color, texture, and
shape information along with the conventional geometric in-
formation as an indexing vector, and applies the indexing
vector to regions as opposed to a whole image. The over-
all image similarity is developed through regional similar-
ity based on all the feature components. In order to address
the color feature uncertainty problem and segmentation in-
accuracy, our approach applies fuzzy set model to regional
color histograms as well as texture and shape representa-
tions. CLEAR incorporates a secondary clustering technique
to construct an indexing tree structure of the database to sig-
nificantly reduce the search time. Experimental evaluation
based on a 10 000 COREL image database shows that this
approach outperforms the peer image retrieval systems pre-
viously described in the literature. In addition, the robust-
ness of the fuzzy indexing scheme to color variations and
segmentation-related uncertainties is proved to be another
advantageofthisapproach.
Compared with existing techniques and systems, our ap-
proach has the following distinctive advantages: (i) it par-
tially solves the color uncertainty problem typically found in
color-based CBIR systems and exploits the inaccurate seg-
mentation effect for the texture and shape features, (ii) it de-
velops a balanced scheme in similarity measure between re-
gional matching and global matching in order to capture as
much semantic information as possible with no sacrifice in
efficiency, and (iii) it preorganizes image databases by con-
structing an indexing structure to further improve retrieval
efficiency without compromising retrieval effectiveness.
REFERENCES
[1] M. De Marsicoi, L. Cinque, and S. Levialdi, “Indexing pic-
torial documents by their content: a survey of current tech-
niques,” Image and Vision Computing, vol. 15, no. 2, pp. 119–
141, 1997.
[2] A. W. M. Smeulders, M. Worring, S. Santini, A. Gupta, and
R. Jain, “Content-based image retrieval at the end of the early
years,” IEEE Trans. on Pattern Analysis and Machine Intelli-
gence, vol. 22, no. 12, pp. 1349–1380, 2000.
[3] Y. A. Aslandogan and C. T. Yu, “Techniques and systems for
image and video retrieval,” IEEE Transactions on Knowledge
and Data Engineering, vol. 11, no. 1, pp. 56–63, 1999.
[4] G. Pass and R. Zabih, “Histogram refinement for content-
based image retrie val,” in Proc. 3rd IEEE Workshop on Ap-
plications of Computer Vision, pp. 96–102, Sarasota, Fla, USA,
December 1996.
[5] M. Flickner, H. Sawhney, W. Niblack, et al., “Query by image
and video content: the QBIC system,” IEEE Computer, vol. 28,
no. 9, pp. 23–32, 1995.
[6] J. Huang, S. R. Kumar, M. Mitra, W J. Zhu, and R. Zabih,
“Image indexing using color correlograms,” in Proc. IEEE
Computer Society Conference on Computer Vision and Pattern
Recognition, pp. 762–768, San Juan, Puerto Rico, June 1997.
[7] A. Rao, R. K. Srihari, and Z. Zhang, “Spatial color histograms
for content-based image retrieval,” in Proc. 11th IEEE Interna-
tional Conference on Tools with Artificial Intelligence, pp. 183–
186, Chicago, IL, USA, November 1999.
[8] L. Cinque, G. Ciocca, S. Levialdi, A. Pellican
`
o,andR.Schet-
tini, “Color-based image retrieval using spatial-chromatic his-
tograms,” Image and Vision Computing, vol. 19, no. 13, pp.
979–986, 2001.
[9] S. Ravela and R. Manmatha, “Retrieving images by appear-
ance,” in Proc. 6th IEEE International Conference on Computer
Vision (ICCV ’98), pp. 608–613, Bombay, India, January 1998.
[10] H. Wang, F. Guo, and D. D. Feng, “A signature for content-
based image retrieval using a geometrical transform,” in Proc.
6th ACM International Multimedia Conference, pp. 229–234,
Bristal, UK, September 1998.
[11] V. E. Ogle and M. Stonebraker, “Chabot: retrieval from a rela-
tional database of images,” IEEE Computer,vol.28,no.9,pp.
40–48, 1995.
A Robust Color Object Analysis Approach to Image Retrieval 885
[12] C. Carson, M. Thomas, S. Belongie, J. M. Hellerstein, and
J. Malik, “Blobworld: A system for region-based image index-
ing and retrieval,” in 3rd International Conference on Visual
Information Systems, pp. 509–516, Springer, Amsterdam, The
Netherlands, June 1999.
[13] W. Y. Ma and B. Manjunath, “NeTra: a toolbox for navigating
large image databases,” in Proc. International Conference on
Image Processing, vol. 1, pp. 568–571, Santa Barbara, CA, USA,
1997.
[14] J. R. Smith and S. F. Chang, “VisualSEEk: a fully automated
content-based image query system,” in Proc. ACM Multimedia
’96, pp. 87–98, ACM Press, Boston, Mass, USA, 1996.
[15] J. Z. Wang, J. Li, and G. Wiederhold, “SIMPLIcity: semantics-
sensitive integrated matching for picture libraries,” IEEE
Trans. on Pattern Analysis and Machine Intelligence, vol. 23,
no. 9, pp. 947–963, 2001.
[16] Y. Chen and J. Z. Wang, “A region-based fuzzy feature
matching approach to content-based image retrieval,” IEEE
Trans. on Pattern Analysis and Machine Intelligence, vol. 24,
no. 9, pp. 1252–1267, 2002.
[17] F. Jing, M. Li, H. Zhang, and B. Zhang, “An effective region-
based image retrieval framework,” in Proc. 10th ACM Multi-
media, pp. 456–465, Juan-les-Pins, France, 2002.
[18] K.Yu,W Y.Ma,V.Tresp,etal.,“Knowingatreefromthefor-
est: art image retrieval using a society of profiles,” in Proc. 11th
Annual ACM International Conference on Multimedia,Berke-
ley, Calif, USA, November 2003.
[19] I. J. Cox, M. L. Miller, T. P. Minka, T. V. Papathomas, and P. N.
Yianilos, “The Bayesian image retrieval system PicHunter:
theor y, implementation, and psychophysical experiments,”
IEEE Transactions on Image Processing, vol. 9, no. 1, pp. 20–
37, 2000.
[20] V. Vapnik, The Nature of Statistical Learning Theory, Springer-
Verlag, New York, 1995.
[21] S. Russell and P. Norvig, Artificial Intelligence: A Modern Ap-
proach, Prentice-Hall, Englewood Cliffs, NJ, USA, 1995.
[22] J. A. Hartigan and M . A. Wong, “Algorithm AS 136: A k-
means clustering algorithm,” Applied Stat istics, vol. 28, no. 1,
pp. 100–108, 1979.
[23] I. Daubechies, Ten Lect ures on Wavelets , Capital City Press,
Montpelier, Vt, 1992.
[24] A. Gersho, “Asymptotically optimal block quantization,” IEEE
Transactions on Information Theory, vol. 25, no. 4, pp. 373–
380, 1979.
[25] S. K. Pal, A. Ghosh, and M. K. Kundu, Eds., Soft Computing
for Image Processing, Physica-Verlag, Heidelberg, 2000.
[26] C. Vertan and N. Boujemaa, “Embedding fuzzy logic in con-
tent based image retrieval,” in 19th International Meeting
of the North American Fuzzy Information Processing Society
(NAFIPS ’00), pp. 85–89, Atlanta, Ga, USA, July 2000.
[27] Z. Chi, H. Yan, and T. Pham, Fuzzy Algorithms: with Applica-
tions to Image Processing and Pattern Recognition,WorldSci-
entific, River Edge, NJ, USA, 1996.
[28] J. J. Buckley and E. Eslami, An Introduction to Fuzzy Logic and
Fuzzy Sets, Physica-Verlag, New York, 2002.
[29] F. Hoppner, F. Klawonn, R. Kruse, and T. Runkler, Fuzzy Clus-
ter Analysis: Methods for Classification, Data Analysis and Im-
age Recognition, John Wiley & Sons, 1999.
[30] J. Kautsky, N. K. Nichols, and D. L. B. Jupp, “Smoothed his-
togram modification for image processing,” Graphical Models
and Image Processing, vol. 26, no. 3, pp. 271–291, 1984.
[31] C. J. van Rijsbergen, Information Retrieval,Butterworths,
London, 2nd edition, 1979.
Ruofei Zhang received his B.S. degree in
computer science and engineering from
Xi’an Jiaotong University, China, in 1996,
and his M.S. degree in electronics from Ts-
inghua University, China, in 1999. He is
currently a Ph.D. candidate and Research
Assistant in the Computer Science Depart-
ment at the State University of New York,
Binghamton, USA. He has worked as a Soft-
ware Engineer in Tsinghua Tongfang Ltd.,
Beijing, China, and Ebase Interactive, Binghamton, USA, respec-
tively. His research interests include computer vision and image
understanding, multimedia database, multimedia information re-
trieval, pattern recognition, machine intelligence, and reusable ob-
ject design. He has published a number of papers in these fields.
Zhongfei (Mark) Zhang is an Assistant Pro-
fessor in the Computer Science Department
at the State University of New York (SUNY)
at Binghamton. He received his B.S. degree
in electronics engineering (with Honors),
M.S. degree in information sciences, both
from Zhejiang University, China, and Ph.D.
degree in computer science from the Uni-
versity of Massachusetts at Amherst, USA.
He was on the faculty of Computer Sci-
ence and Engineering Department, and a Research Scientist at
the Center of Excellence for Document Analysis and Recognition
(CEDAR), both at SUNY Buffalo. His research interests include
computer vision and image understanding, pattern recognition,
data mining and information fusion, and multimedia informa-
tion indexing and retrieval, as well as biomedical engineering. He
has been Principal Investigator/Coprincipal Investigator for several
projects in these areas supported by the Federal Government, the
New York State Government, as well as private industries. He holds
four inventions, has served as a Reviewer/PC Member for many
conferences and journals, as a Grant Review Panelist for govern-
mental and private funding agencies, and is in the editorial board
of Pattern Recognition. He has also served as a Technical Consul-
tant for a number of industrial and governmental organizations.
He is a recipient of NRC Visiting Fellow and SUNY Chancellor’s
Promising Inventor Award.