Báo cáo hóa học: " Offline Signature Verification Using the Discrete Radon Transform and a Hidden Markov Model" doc
Bạn đang xem bản rút gọn của tài liệu. Xem và tải ngay bản đầy đủ của tài liệu tại đây (996.78 KB, 13 trang )
EURASIP Journal on Applied Signal Processing 2004:4, 559–571
c 2004 Hindawi Publishing Corporation
Offline Signature Verification Using the Discrete Radon
Transform and a Hidden Markov Model
J. Coetzer
Department of Applied Mathematics, University of Stellenbosch, Matieland 7602, South Africa
Email:
B. M. Herbst
Department of Applied Mathematics, University of Stellenbosch, Matieland 7602, South Africa
Email:
J. A. du Preez
Department of Electrical and Electronic Engineering, University of Stellenbosch, Matieland 7602, South Africa
Email:
Received 31 October 2002; Revised 27 June 2003
We developed a system that automatically authenticates offline handwritten signatures using the discrete Radon transform (DRT)
and a hidden Markov model (HMM). Given the robustness of our algorithm and the fact that only global features are considered,
satisfactory results are obtained. Using a database of 924 signatures from 22 writers, our system achieves an equal error rate (EER)
of 18% when only high-quality forgeries (skilled forgeries) are considered and an EER of 4.5% in the case of only casual forgeries.
These signatures were originally captured offline. Using another database of 4800 signatures from 51 writers, our system achieves
an EER of 12.2% when only skilled forgeries are considered. These signatures were originally captured online and then digitally
converted into static signature images. These results compare well with the results of other algorithms that consider only global
features.
Keywords and phrases: offline signature verification, discrete Radon transform, hidden Markov model.
1.
INTRODUCTION
The purpose of our research is to develop a system that automatically classifies handwritten signature images as authentic
or fraudulent, with as little misclassifications as possible. At
the same time, the processing requirements must be feasible
so as to make the adoption of such an automated system economically viable.
Our work is inspired by, amongst others, the potential financial benefits that the automatic clearing of cheques will
have for the banking industry. Despite an increasing number of electronic alternatives to paper cheques, fraud perpetrated at financial institutions in the United States has become a national epidemic. The National Check Fraud Center
Report of 2000 [1] states that: “. . . cheque fraud and counterfeiting are among the fastest-growing crimes affecting the
United States’ financial system, producing estimated annual
losses exceeding $10 billion with the number continuing to
rise at an alarming rate each year.”
Since commercial banks pay little attention to verify-
ing signatures on cheques—mainly due to the number of
cheques that are processed daily—a system capable of screening casual forgeries should already prove beneficial. In fact,
most forged cheques contain forgeries of this type.
We developed a system that automatically authenticates
documents based on the owner’s handwritten signature. It
should be noted that our system assumes that the signatures have already been extracted from the documents. Methods for extracting signature data from cheque backgrounds
can be found in the following papers, [2, 3, 4]. Our system will assist commercial banks in the process of screening
cheques and is not intended to replace the manual screening of cheques entirely. Those cheques of which the signatures do not sufficiently match a model of the owner’s genuine signature are provisionally rejected. Generally, these rejected cheques will constitute a small percentage of the total
number of cheques processed daily, and only these cheques
are selected for manual screening.
Since the introduction of computers, modern society has
become increasingly dependent on the electronic storage and
560
transmission of information. In many transactions, the electronic verification of a person’s identity proved beneficial and
this inspired the development of a wide range of automatic
identification systems.
Plamondon and Srihari [5] note that automatic signature
verification systems occupy a very specific niche among other
automatic identification systems: “On the one hand, they differ from systems based on the possession of something (key,
card, etc.) or the knowledge of something (passwords, personal information, etc.), because they rely on a specific, well
learned gesture. On the other hand, they also differ from systems based on the biometric properties of an individual (finger prints, voice prints, retinal prints, etc.), because the signature is still the most socially and legally accepted means of
personal identification.”
Although handwritten signatures are by no means the
most reliable means of personal identification, signature verification systems are inexpensive and nonintrusive. Handwritten signatures provide a direct link between the writer’s
identity and the transaction, and are therefore perfect for endorsing transactions.
A clear distinction should be made between signature
verification systems and signature recognition systems. A signature verification system merely decides whether a claim
that a particular signature belongs to a specific class (writer)
is true or false. A signature recognition system, on the other
hand, has to decide to which of a certain number of classes
(writers) a particular signature belongs.
Diverse applications inspired researchers to investigate
the feasibility of two distinct categories of automatic signature verification systems: those concerned with the verification of signature images and those concerned with the verification of signatures that were captured dynamically, using
a special pen and digitising tablet. These systems are referred
to as offline and online systems, respectively.
In offline systems, a signature is digitised using a handheld or flatbed scanner and only the completed writing is
stored as an image. These images are referred to as static signatures. Offline systems are of interest in scenarios where
only hard copies of signatures are available, for example
where a large number of documents need to be authenticated.
In the online case, a special pen is used on an electronic
surface such as a digitiser combined with a liquid crystal display. Apart from the two-dimensional coordinates of successive points of the writing, pen pressure as well as the angle
and direction of the pen are captured dynamically and then
stored as a function of time. The stored data is referred to as
a dynamic signature and also contains information on pen
velocity and acceleration. Online systems are of interest for
“point-of-sale” and security applications.
Since online signatures also contain dynamic information, they are difficult to forge. It therefore comes as no surprise that offline signature verification systems are much less
reliable than online systems.
A signature verification system typically focuses on the
detection of one or more category of forged signatures. A
skilled forgery is produced when the forger has unrestricted
EURASIP Journal on Applied Signal Processing
access to one or more samples of the writer’s actual signature (see Figure 1b). A casual forgery or a simple forgery (see
Figure 1c) is produced when the forger is familiar with the
writer’s name, but does not have access to a sample of the actual signature—stylistic differences are therefore prevalent. A
random forgery or zero-effort forgery (see Figure 1d) can be
any random scribble or a signature of another writer, and
may even include the forger’s own signature. The genuine
signatures and high quality forgeries for other writers are
usually considered to be forgeries of this type.
Skilled forgeries can be subdivided into amateur and professional forgeries. A professional forgery is produced by an individual who has professional expertise in handwriting analysis. They are able to circumvent obvious problems and exploit their knowledge to produce high-quality, spacial forgeries (see Figure 2b).
In the context of online verification, amateur forgeries
can be subdivided into home-improved and over-the-shoulder
forgeries (see [6]). The category of home-improved forgeries
contains forgeries that are produced when the forger has a
paper copy of a genuine signature and has ample opportunity to practice the signature at home. Here the imitation
is based only on the static image of the original signature
(see Figure 2c). The category of over-the-shoulder forgeries
contains forgeries that are produced immediately after the
forger has witnessed a genuine signature being produced.
The forger therefore learns not only the spatial image, but
also the dynamic properties of the signature by observing the
signing process (see Figure 2d). The different types of forgeries are summarised in Figure 3.
The features that are extracted from static signature images can be classified as global or local features. Global features describe an entire signature and include the discrete
Wavelet transform [7], the Hough transform [8], horizontal
and vertical projections [9], and smoothness features [10].
Local features are extracted at stroke and substroke levels and
include unballistic motion and tremor information in stroke
segments [11], stroke “elements” [9], local shape descriptors
[12], and pressure and slant features [13].
Various pattern recognition techniques have been exploited to authenticate handwritten signatures (see Section
2). These techniques include template matching techniques
[7, 9, 11], minimum distance classifiers [10, 12, 14, 15], neural networks [8, 13, 16], hidden Markov models (HMMs)
[17, 18], and structural pattern recognition techniques.
Throughout this paper, the false rejection rate (FRR), the
false acceptance rate (FAR), the equal error rate (EER), and
the average error rate (AER) are used as quality performance
measures. The FRR is the ratio of the number of genuine test
signatures rejected to the total number of genuine test signatures submitted. The FAR is the ratio of the number of
forgeries accepted to the total number of forgeries submitted.
When the decision threshold is altered so as to decrease the
FRR, the FAR will invariably increase, and vice versa. When a
certain threshold is selected, the FRR is equal to the FAR. This
error rate is called the EER and the corresponding threshold
may be called the equal error threshold. The average of the
FRR and FAR is called the AER. When a threshold is used,
Offline Signature Verification Using the DRT and a HMM
(a)
(b)
(c)
(d)
Figure 1: Example of a (a) genuine signature, (b) skilled forgery, (c)
casual forgery, and (d) random forgery for the writer “M. Claasen.”
(a)
(b)
(c)
(d)
Figure 2: Example of a (a) genuine signature, (b) professional
forgery, (c) home-improved forgery, and (d) over-the-shoulder
forgery.
Forgeries
Skilled
forgeries
Professional
forgeries
561
namic signatures nor with the recognition of signatures. Feature vectors are extracted from each static signature image by
first calculating the discrete Radon transform (DRT). This
is followed by further image processing. As we will explain
in Section 3, the DRT is a very stable method of feature extraction. These features are global features since they are not
extracted at stroke or substroke level. The DRT also enables
us to construct an HMM, of which the states are organised
in a ring, for each writer’s signature (see Section 4). Our verifier is constructed in such a way that it is geared towards the
detection of only skilled and casual forgeries (see Section 5).
We therefore do not consider random forgeries in this paper.
We test our system on two different data sets. We first
test our system on our own independent database of static
signatures. However, since it make sense to compare our results to those of another algorithm on the same database
of signatures, and since offline signature databases are not
freely available, we also test our system on a set of signatures
that was originally captured online. Hans Dolfing was kind
enough to make this database available to us. Before we test
our system on Dolfing’s signatures, Dolfing’s signatures are
first transformed from dynamic signatures into static signature images (see Section 6.1). We then compare our results to
the results of one of Dolfing’s online algorithms. This algorithm uses an HMM and only considers the spacial coordinates of each writing. The results for both of these data sets
are discussed in Section 6.3.
In Section 2, we describe a few recent offline signature
verification systems. We categorise each of these systems according to the pattern recognition technique that is used. We
also discuss the type of forgeries that each of these algorithms
aim to detect, the type of features they exploit, whether the
algorithm in question is geared towards the recognition or
verification of signatures, the composition of each database,
and the error rates for each algorithm. We then compare
these approaches to ours. Our algorithm is discussed in detail
in Sections 3, 4, 5, 6, 7, and 8.
2.
Casual
forgeries
Random
forgeries
Amateur
forgeries
Over-the-shoulder Home-improved
forgeries
forgeries
Increasing quality
Figure 3: Types of forgeries.
that is, close to the equal error threshold, the FRR and FAR
will not differ much. In this case the AER is approximately
equal to the EER.
In this paper, we focus on offline signature verification.
We are therefore not concerned with the verification of dy-
OVERVIEW OF PRIOR WORK
A great deal of work has been done in the area of offline signature verification over the past two decades. A recent paper
by Guo et al. [11] includes an extensive overview of previous
work. Numerous methods and approaches are summarised
in a number of survey articles. The state of the art from 1993
to 2000 is discussed in a paper by Plamondon and Srihari [5].
The period from 1989 to 1993 is covered by Leclerc and Plamondon [19] and the period before 1989 by Plamondon and
Lorette [20]. Another survey was published by Sabourin et
al. in 1992 [21]. A review of online signature verification by
Gupta and McCabe in 1998 also includes a summary of some
earlier work on the offline case [22].
Earlier work on offline signature verification deals primarily with casual and random forgeries. Many researchers
therefore found it sufficient to consider only the global features of a signature.
As signature databases became larger and researchers
moved toward more difficult skilled forgery detection tasks,
562
we saw a progression not only to more elaborate classifiers,
but also to the increased use of local features and matching
techniques.
We now briefly discuss some recent papers on offline signature verification.
Template matching techniques
Deng [7] developed a system that uses a closed contour tracing algorithm to represent the edges of each signature with
several closed contours. The curvature data of the traced
closed contours are decomposed into multiresolutional signals using wavelet transforms. The zero crossings corresponding to the curvature data are extracted as features for
matching. A statistical measurement is devised to decide systematically which closed contours and their associated frequency data are most stable and discriminating. Based on
these data, the optimal threshold value which controls the accuracy of the feature extraction process is calculated. Matching is done through dynamic time warping. Experiments are
conducted independently on two data sets, one consisting of
English signatures and the other consisting of Chinese signatures. For each experiment, twenty-five writers are used
with ten training signatures, ten genuine test signatures, ten
skilled forgeries, and ten casual forgeries per writer. When
only the skilled forgeries are considered, AERs of 13.4% and
9.8% are reported for the respective data sets. When only the
casual forgeries are considered, AERs of 2.8% and 3.0% are
reported.
Fang [9] proposes two methods for the detection of
skilled forgeries. These methods are evaluated on a database
of 1320 genuine signatures from 55 writers and 1320 forgeries from 12 forgers. In determining the FRR, the leaveone-out method was adopted to maximise the use of the
available genuine signatures. The first method calculates onedimensional projection profiles for each signature in both the
horizontal and vertical directions. These profiles are then optimally matched with reference profiles using dynamic programming. This method differs from previous methods in
the sense that the distance between the warped projection
profiles is not used in the decision. Instead, the positional
distortion of each point of the sample profile, when warped
onto a reference profile, is incorporated into a distance measure. A Mahalanobis distance is used instead of a simple
Euclidean distance. The leave-one-out covariance (LOOC)
method is adopted for this purpose, but the unreliable offdiagonal elements of the covariance matrices are set to zero.
When binary and gray-scale signatures are considered, the
best AERs for this method are 20.8% and 18.1%, respectively.
The second method matches the individual stroke segments
of a two-dimensional test signature directly with those of a
template signature using a two-dimensional elastic matching algorithm. The objective of this algorithm is to achieve
maximum similarity between the “elements” of a test signature and the “elements” of a reference signature, while minimising the deformation of these signatures. A gradient descent procedure is used for this purpose. Elements are short
straight lines that approximate the skeleton of a signature. A
EURASIP Journal on Applied Signal Processing
Mahalanobis distance with the same restrictions as for the
first method is used. An AER of 23.4% is achieved for this
method.
Guo [11] approached the offline problem by establishing a local correspondence between a model and a questioned signature. The questioned signature is segmented into
consecutive stroke segments that are matched to the stroke
segments of the model. The cost of the match is determined by comparing a set of geometric properties of the
corresponding substrokes and computing a weighted sum
of the property value differences. The least invariant features of the least invariant substrokes are given the largest
weights, thus emphasizing features that are highly writer dependant. Using the local correspondence between the model
and a questioned signature, the writer dependant information embedded at the substroke level is examined and unballistic motion and tremor information in each stroke segment are examined. Matching is done through dynamic time
warping. A database with 10 writers is used with 5 training signatures, 5 genuine test signatures, 20 skilled forgeries,
and ten casual forgeries per writer. An AER of 8.8% is obtained when only skilled forgeries are considered and an AER
of 2.7% is obtained when only casual forgeries are considered.
Minimum distance classifiers
Fang [10] developed a system that is based on the assumption that the cursive segments of forged signatures are generally less smooth than that of genuine ones. Two approaches
are proposed to extract the smoothness feature: a crossing
method and a fractal dimension method. The smoothness
feature is then combined with global shape features. Verification is based on a minimum distance classifier. An iterative leave-one-out method is used for training and for testing
genuine test signatures. A database with 55 writers is used
with 24 training signatures and 24 skilled forgeries per writer.
An AER of 17.3% is obtained.
Fang [14] also developed a system that uses an elastic
matching method to generate additional samples. A set of
peripheral features, which is useful in describing both the internal and the external structures of signatures, is employed
to represent a signature in the verification process. Verification is based on a Mahalanobis distance classifier. An iterative leave-one-out method is used for training and for testing genuine test signatures. The same database that was used
in Fang’s previous paper [10] is again used here. The additional samples generated by this method reduced the AER
from 15.6% to 11.4%.
Mizukami [15] proposed a system that is based on a displacement extraction method. The optimum displacement
functions are extracted for any pair of signatures using minimization of a functional. The functional is defined as the
sum of the squared Euclidean distance between two signatures and a penalty term that requires smoothness of the
displacement function. A coarse-to-fine search method is
applied to prevent the calculation from stopping at local
minima. Based on the obtained displacement function, the
Offline Signature Verification Using the DRT and a HMM
dissimilarity between the questioned signature and the corresponding authentic one is measured. A database with 20
writers is used with 10 training signatures, 10 genuine test
signatures, and 10 skilled forgeries per writer. An AER of
24.9% is obtained.
Sabourin [12] uses granulometric size distributions for
the definition of local shape descriptors in an attempt to
characterise the amount of signal activity exciting each retina
on the focus of an superimposed grid. He then uses a nearest
neighbour and threshold-based classifier to detect random
forgeries. A total error rate of 0.02% and 1.0% is reported
for the respective classifiers. A database of 800 genuine signatures from 20 writers is used.
Neural networks
Baltzakis [16] developed a neural network-based system for
the detection of random forgeries. The system uses global
features, grid features (pixel densities), and texture features
(cooccurrence matrices) to represent each signature. For
each one of these feature sets, a special two-stage perceptron one-class-one-network (OCON) classification structure
is implemented. In the first stage, the classifier combines the
decision results of the neural networks and the Euclidean distance obtained using the three feature sets. The results of the
first stage classifier feed a second-stage radial basis function
(RBF) neural network structure, which makes the final decision. A database is used which contains the signatures of
115 writers, with between 15 and 20 genuine signatures per
writer. An average FRR and FAR of 3% and 9.8%, respectively
is obtained.
Kaewkongka [8] uses the Hough transform (general
Radon transform) to extract the parameterised Hough space
from a signature skeleton as a unique characteristic feature
of a signature. A backpropagation neural network is used to
evaluate the performance of the method. The system is tested
with 70 signatures from different writers and a recognition
rate of 95.24% is achieved.
Quek [13] investigates the feasibility of using a pseudoouter product-based fuzzy neural network for skilled forgery
detection. He uses global baseline features (i.e., the vertical
and horizontal position in the signature image which corresponds to the peak in the frequency histogram of the vertical
and horizontal projection of the binary image, respectively),
pressure features (that correspond to high pressure regions
in the signature), and slant features (which are found by examining the neighbours of each pixel of the thinned signature). He then conducts two types of experiments. The first
group of experiments use genuine signatures and forgeries
as training data, while the second group of experiments use
only genuine signatures as training data. These experiments
are conducted on the signatures of 15 different writers, that
is, 5 writers from 3 different ethnic groups. For each writer,
5 genuine signatures and 5 skilled forgeries are submitted.
When genuine signatures and forgeries are used as training
data, the average of the individual EERs is 22.4%. Comparable results are obtained when only genuine signatures are
used as training data.
563
Hidden Markov models
El-Yacoubi [17] uses HMMs and the cross-validation principle for random forgery detection. A grid is superimposed on
each signature image, segmenting it into local square cells.
From each cell, the pixel density is computed so that each
pixel density represents a local feature. Each signature image is therefore represented by a sequence of feature vectors,
where each feature vector represents the pixel densities associated with a column of cells. The cross-validation principle
involves the use of a subset (validation set) of each writer’s
training set for validation purposes. Since this system aims to
detect only random forgeries, subsets of other writers’ training sets are used for impostor validation. Two experiments
are conducted on two independent data sets, where each data
set contains the signatures of 40 and 60 writers, respectively.
Both experiments use 20 genuine signatures for training and
10 for validation. Both experiments use the forgeries of the
first experiment for impostor validation. Each test signature
is analyzed under several resolutions and the majority-vote
rule is used to make a decision. AERs of 0.46% and 0.91%
are reported for the respective data sets.
Justino [18] uses a discrete observation HMM to detect
random, casual, and skilled forgeries. A grid segmentation
scheme is used to extract three features: a pixel density feature, a pixel distribution feature (extended-shadow-code),
and an axial slant feature. A cross-validation procedure is
used to dynamically define the optimal number of states for
each model (writer). Two data sets are used. The first data set
contains the signatures of 40 writers with 40 genuine signatures per writer. This data set is used to determine the optimal codebook size for detecting random forgeries. This optimised system is then used to detect random, casual, and
skilled forgeries in a second data set. The second data set
contains the signatures of 60 writers with 40 training signatures, 10 genuine test signatures, 10 casual forgeries, and 10
skilled forgeries per writer. An FRR of 2.83% and an FAR of
1.44%, 2.50%, and 22.67% are reported for random, casual,
and skilled forgeries, respectively.
Comparison with our approach
Due to a lack of common signature databases, it is difficult
to directly compare our system to the above systems. When
comparing, we therefore first have to consider whether these
systems are similar to our system or not. The rationale for
this is that when a system is fundamentally very different
from ours, it is very likely that a combination of this system
and ours will result in a superior merged system. This will
make their approach complementary to ours. Of all of these
systems, three systems are probably the closest to ours.
Like our method, the first method by Fang [9] also considers one-dimensional projection profiles of each signature,
but only in the horizontal and vertical directions. Their modelling technique however differs substantially from ours and
is based on dynamic time warping. The positional distortion
of each point of a sample profile, when warped onto a reference profile, is incorporated into a Mahalanobis distance
measure. When only skilled forgeries are considered, their
564
EURASIP Journal on Applied Signal Processing
system achieves a best AER of 20.8% for binary signatures.
Our system achieves an EER of 17.7% when applied to our
first database and an EER of 12.2% when applied to our second database.
The method by Kaewkongka [8] utilises the Hough transform, which is similar to the Radon transform, but is able
to detect not only straight lines, but also other conical sections as well. Their modelling technique differs substantially
from ours and is based on a backpropagation neural network.
Their system is not a verification system though, and only
aims to recognise signatures.
Like our method, the method by Justino [18] also utilises
an HMM to detect casual and skilled forgeries. However, they
use features that are very different from ours. A grid segmentation scheme is used to extract three features: a pixel density
feature, a pixel distribution feature, and an axial slant feature.
Although their system achieves better error rates than ours,
the fact has to be taken into account that their system uses 40
training signatures per writer, while our system uses only 10
and 15 training signatures, respectively, when applied to our
two data sets.
The approaches described in [12, 16, 17] use verifiers that
are geared towards the detection of only random forgeries.
The approaches described in [7, 10, 11, 12, 13, 14, 15, 16]
utilise techniques that are fundamentally very different from
ours, while the approaches described in [7, 10, 12, 14, 15, 16,
17] utilise features that are fundamentally very different from
ours.
3.
Each signature is scanned into a binary image at a resolution
of 300 dots per inch, after which median filtering is applied
to remove speckle noise. On average, a signature image has a
width of 400 to 600 pixels and a height of 200 to 400 pixels.
The image dimensions are not normalised.
Subsequently, the DRT of each signature is calculated.
Each column of the DRT represents a projection or shadow
of the signature at a certain angle. After these projections are
processed and normalised, they represent a set of feature vectors (observation sequence) for the signature in question.
The DRT of an image is calculated as follows. Assume
that each signature image consists of Ψ pixels in total, and
that the intensity of the ith pixel is denoted by Ii , i = 1, . . . , Ψ.
The DRT is calculated using β nonoverlapping beams per
angle and Θ angles in total. The cumulative intensity of
the pixels that lie within the jth beam is denoted by R j ,
j = 1, . . . , βΘ. This is called the jth beam sum. In its discrete form, the Radon transform can therefore be expressed
as follows:
Ψ
w i j Ii ,
jth beam
Figure 4: Discrete model for the Radon transform with wi j ≈ 0.9.
0◦
90◦
90◦
0◦
(a)
1
33
65
97
128
(b)
Figure 5: (a) A signature and its projections calculated at angles of
0◦ and 90◦ . (b) The DRT displayed as a gray-scale image. This image
has Θ = 128 columns, where each column represents a projection.
IMAGE PROCESSING
Rj =
ith pixel
j = 1, 2, . . . , βΘ,
(1)
i=1
where wi j indicates the contribution of the ith pixel to the jth
beam sum (see Figure 4). The value of wi j is found through
two-dimensional interpolation. Each projection therefore
contains the beam sums that are calculated at a given angle.
The accuracy of the DRT is determined by Θ (the number of
angles), β (the number of beams per angle), and the accuracy
of the interpolation method.
Note that the continuous form of the Radon transform
can be inverted through analytical means. The DRT therefore contains almost the same information as the original
image and can be efficiently calculated with an algorithm by
Bracewell [23].
Our system calculates the DRT at Θ angles. These angles are equally distributed between 0◦ and 180◦ . A typical
signature and its DRT are shown in Figure 5. The dimension of each projection is subsequently altered from β to d.
This is done by first decimating all the zero-valued components from each projection. These decimated vectors are then
shrunk or expanded to a length of d through interpolation.
Although almost all the information in the original signature image is contained in the projections at angles that range
from 0◦ to 180◦ , the projections at angles that range from
180◦ to 360◦ are also included in the observation sequence.
These additional projections are added to the observation sequence in order to ensure that the sequence fits the topology of our HMM (see Section 4.2). Since these projections
are simply reflections of the projections already calculated,
no additional calculations are necessary. An observation sequence therefore consists of T = 2Θ feature vectors, that
Offline Signature Verification Using the DRT and a HMM
T
is, X1 = {x1 , x2 , . . . , xT }. Each vector is subsequently normalised by the variance of the intensity of the entire set of
T feature vectors. Each signature pattern is therefore represented by an observation sequence that consists of T observations, where each observation is a feature vector of dimension d. The experimental results and computational requirements for various values of d and Θ are discussed in Sections
6 and 7, respectively.
The DRT, as a feature extraction technique, has several
advantages. Although the DRT is not a shift invariant representation of a signature image, shift and scale invariance is
ensured by the subsequent image processing. Each signature
is a static image and contains no dynamic information. Since
the feature vectors are obtained by calculating projections at
different angles, simulated time evolution is created from one
feature vector to the next, where the angle is the dynamic
variable. This enables us to construct an HMM for each signature (see Section 4). The DRT is calculated at angles that
range from 0◦ to 360◦ and each observation sequence is then
modelled by an HMM of which the states are organised in
a ring (see Section 4.2). This ensures that each set of feature
vectors is rotation invariant. Our system is also robust with
respect to moderate levels of noise. These advantages are now
discussed in more detail.
Noise
We explained earlier in this section that the zero-valued components of each projection are decimated before the remaining non-zero components are shrunk or expanded through
interpolation. In this way, a feature vector with the required
dimension is obtained. The decimation of the zero-valued
components ensures that moderate levels of noise (which
are represented by a few additional small-valued components
within certain projections) are “attached” to the other nonzero components before the decimated vector is shrunk or
expanded. Since the dimension of the feature vectors are high
compared to the number of these additional components,
the incorporation of these components has little effect on the
overall performance of the system.
Shift invariance
Although the DRT is not a shift invariant representation of
a signature image, shift invariance is ensured by the subsequent image processing. The zero-valued components of
each projection are decimated and the corresponding feature
vector is constructed from the remaining components only.
Rotation invariance
The DRT is calculated at angles that range from 0◦ to 360◦
and each set of feature vectors is then modelled by an HMM
of which the states are organised in a ring (see Section 4.2).
Each signature is therefore represented by a set of feature vectors that is rotation invariant.
Scale invariance
For each projection, scale invariance has to be achieved in the
direction perpendicular to the direction in which the image
565
is scanned, that is, perpendicular to the beams, and in the direction parallel to the beams. Scale invariance perpendicular
to the beams is ensured by shrinking or expanding each decimated projection to the required dimension. Scale invariance
parallel to the beams is achieved by normalizing the intensity
of each feature vector. This is achieved by dividing each feature vector by the variance of the intensity of the entire set of
feature vectors.
4.
SIGNATURE MODELLING
We use a first-order continuous observation HMM to model
each writer’s signature. For a tutorial on HMMs, the reader
is referred to a paper by Rabiner [24] and the book by Deller
et al. [25].
4.1.
Notation
We use the following notation for an HMM λ.
(1) We denote the N individual states as
S = s1 , s2 , . . . , sN
(2)
and the state at time t as qt .
(2) The initial state distribution is denoted by π = {πi },
where
πi = P q1 = si ,
i = 1, . . . , N.
(3)
(3) The state transition probability distribution is denoted
by A = {ai, j }, where
ai, j = P qt+1 = s j | qt = si ,
i = 1, . . . , N, j = 1, . . . , N.
(4)
(4) The probability density function (pdf), which quantifies the similarity between a feature vector x and the
state s j , is denoted by
f x |s j , λ ,
4.2.
j = 1, . . . , N.
(5)
HMM topology
We use an HMM, the states of which are organised in a
ring (see Figure 6). Our model is equivalent to a left-to-right
model, but a transition from the last state to the first state is
allowed. Since the HMM is constructed in such a way that it
is equally likely to enter the model at any state, and the feature vectors are obtained from all the projections, that is, the
projections calculated at angles ranging from 0◦ to 360◦ , the
ring topology of our HMM guarantees that the signatures
are rotation invariant. Each state in the HMM represents
one or more feature vectors that occupy similar positions in
a d-dimensional feature space. This implies that the HMM
groups certain projections (columns of the DRT) together.
It is important to note that this segmentation process only
takes place after some further image processing has been conducted on the original projections.
566
EURASIP Journal on Applied Signal Processing
a10,10
s10
a9,9
s1
s9
s8
5.
a1,1
a2,2
s2
a7,9
s3
a2,4
s7
s4
s6
s5
Figure 6: An example of an HMM with a ring topology. This model
has ten states with one state skip.
4.3. Training
Each model is trained using the Viterbi reestimation technique. The dissimilarity between an observation sequence X
and a model λ can therefore be calculated as follows (see
[24]):
d(X, λ) = − ln f (X |λ) .
(6)
In real-world scenarios, each writer can only submit a small
number of training samples when he or she is enrolled into
the system. Since our algorithm uses feature vectors with a
high dimension, the reestimated covariance matrix of the pdf
for each state is not reliable and may even be singular. A Mahalanobis distance measure can therefore not be found. Consequently, these covariance matrices are not reestimated and
are initially set to 0.5I, where I is the identity matrix. Only
the mean vectors are reestimated, which implies that the dissimilarity values are based on an Euclidean distance measure.
We assume that training signatures, genuine test signatures, and forgeries are available for only a limited number
of writers, that is, for those writers in our database. No forgeries are used in the training process since our system aims
to detect only skilled and casual forgeries, and these type of
forgeries are not available when our system is implemented.
The genuine test signatures and forgeries are used to determine the error rates for our system (see Section 6). Assuming
that there are W writers in our database, the training signatures for each writer are used to construct an HMM, resulting
in W models, that is {λ1 , λ2 , . . . , λW }.
When the training set for writer w is denoted by
(w)
(w)
(w)
{X1 , X2 , . . . , XNw }, where Nw is the number of samples in
the training set, the dissimilarity between every training sample and the model is used to determine the following statistics
for the writer’s signature:
1
µw =
Nw
2
σw
=
1
Nw
d
i=1
Nw
Nw − 1 i=1
d
Xi(w) , λw
,
(7)
Xi(w) , λw
− µw
2
.
VERIFICATION
When a system aims to detect only random forgeries, subsets
of other writers’ training sets can be used to model “typical” forgeries. This is called “impostor validation” and can be
achieved through strategies like test normalization (see [26]).
These techniques enable one to construct verifiers that detect
random forgeries very accurately (see [12, 17]). Since we aim
to detect only skilled and casual forgeries, and since models for these forgeries are generally unobtainable, we are not
able to utilise any of these impostor validation techniques.
We also do not use any subset of genuine signatures for validation purposes.
Our verifier is constructed as follows. When a claim is
(w)
made that the test pattern XTest belongs to writer w, the pattern is first matched with the model λw through Viterbi align(w)
ment. This match is quantified by f (XTest |λw ). The dissimilarity between the test pattern and the model is then calculated as follows (see [24]):
(w)
(w)
d XTest , λw = − ln f XTest |λw
.
(8)
In order to use a global threshold for all writers, Dolfing [6]
suggests that every dissimilarity value in (8) is normalised,
using the statistics of the claimed writer’s signature, that is,
(7):
(w)
dMah XTest , λw =
(w)
d XTest , λw − µw
σw
,
(9)
(w)
where dMah (XTest , λw ) denotes the normalised dissimilarity
between the test pattern and the model of the claimed
writer’s signature. This normalization is based on the assumption that the dissimilarity value in (8) is based on a Mahalanobis distance measure.
When only the mean vectors are reestimated though, the
dissimilarity value in (8) is based on an Euclidean distance
measure. When this is the case, we found that significantly
better results are obtained when the standard deviation of the
dissimilarities of the training set, that is, σw in (9), is replaced
by the mean µw , that is,
(w)
dEucl XTest , λw
=
(w)
d XTest , λw − µw
µw
.
(10)
A sliding threshold τ, where τ ∈ (−∞, ∞), is used
to determine the error rates for the test patterns. When
(w)
dEucl (XTest , λw ) < τ, that is,
(w)
d XTest , λw < µw (1 + τ),
(11)
the claim is accepted, otherwise, the claim is rejected. When
(w)
τ = 0, all the test patterns for which d(XTest , λw ) ≥ µw are
rejected. This almost always results in an FRR close to 100%
and an FAR close to 0%. When τ → ∞, all the test patterns for
(w)
which d(XTest , λw ) is finite are accepted. This always results in
an FRR of 0% and an FAR of 100%.
Offline Signature Verification Using the DRT and a HMM
567
3000
y-coordinate
y-coordinate
3000
2900
2800
2700
2900
2800
2700
1700 1800 1900 2000 2100 2200 2300 2400 2500 2600 2700
x-coordinate
1700 1800 1900 2000 2100 2200 2300 2400 2500 2600 2700
x-coordinate
50
100
150
200
(b)
Row index
Row index
(a)
50
100 150 200 250 300 350 400 450 500
Column index
(c)
50
100
150
200
50
100 150 200 250 300 350 400 450 500
Column index
(d)
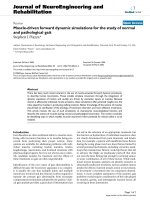
Figure 7: Conversion of dynamic signature data into a static signature image. (a) The “pen-down” coordinates of a signature that was
captured online. (b) One hundred interpolatory points are inserted between each two successive coordinate pairs. (c) A signature image with
a stroke width of one. (d) A signature image with a stroke width of five.
6.
EXPERIMENTS
Experiments are conducted on two different data sets. The
first data set, we call it the Stellenbosch data set, consists
of signature images that were captured offline from designated areas on blank sheets of paper. The second data set,
we call it Dolfing’s data set, consists of dynamic signatures
that were originally captured for Hans Dolfing’s Ph.D. thesis
[6]. We use the pen-tip coordinates to convert each dynamic
signature into an “ideal” signature image, that is, a signature
that contains no background noise and has a uniform stroke
width.
6.1. Data
The Stellenbosch data set
Our first data set contains 924 signatures from 22 writers. Ten
training signatures were obtained from each writer during
an initial enrollment session. Thirty-two test signatures, that
consists of 20 genuine signatures, 6 skilled forgeries, and 6
casual forgeries, were subsequently obtained over a period of
two weeks. The 20 genuine test signatures consist of two sets
of 10 signatures each. These signatures were supplied by the
same writers one week and two weeks after the enrollment
session. The forgeries were obtained from 6 forgers. The casual forgeries were obtained first. Only the name of the writer
was supplied to the forgers and they did not have access to
the writer’s signatures. The skilled forgeries were then obtained from the same group of forgers. They were provided
with several samples of each writer’s genuine signature and
were allowed ample opportunity to practice. Each forger submitted 1 casual forgery and 1 skilled forgery for each writer.
The writers were instructed to produce each signature within
an appropriate rectangular region on a white sheet of paper.
The signatures were then digitised with a flatbed scanner at
a resolution of 300 dots per inch. The genuine signatures
were produced with different pens and the forgeries were
produced with the same pens that were used for producing
the genuine signatures. These signatures are free of excessive
noise, smears, and scratches.
Dolfing’s data set
We also test our system on a second data set. Since offline
signature databases are not freely available, we use a set of
signatures that were originally captured online. We then convert these online signatures into static signature images. Since
Hans Dolfing used this data set to evaluate one of his online algorithms (see [6]), we are able to compare his results to ours. Dolfing’s data set contains 4800 signatures from
51 writers and differs from the Stellenbosch data set in the
sense that the signatures were originally captured online for
Hans Dolfing’s Ph.D. thesis [6]. Each of these signatures contains static and dynamic information captured at 160 sample points per second. Each of these sample points contains
information on pen-tip position, pen pressure, and pen tilt.
Static signature images are constructed from this data using
only the pen-tip position, that is, the x and y coordinates, for
those sample points for which the pen pressure is nonzero
(see Figure 7a). These signature images are therefore “ideal”
568
EURASIP Journal on Applied Signal Processing
Table 1: Data sets.
S’bosch
Data acquisition
method
Offline
Number
of writers
22
Training signatures
per writer
10
Genuine test
signatures
440
Dolfing
Online
51
15
765
in the sense that they contain virtually no background noise.
This acquisition method also ensures a uniform stroke width
within each signature and throughout the data set. One hundred interpolatory points are inserted between each two successive coordinate pairs. Linear interpolation is used for this
purpose and only those coordinate pairs that form part of
the same “pen-down” segment are connected in this way (see
Figure 7b). These coordinates are then rescaled in such a way
that the range of the coordinate with the greater range is
normalised to roughly 480, while the spatial aspect ratio of
the entire signature is maintained. An image that consists of
only zeros and of which the larger dimension is 512 is subsequently constructed. The normalised coordinates are then
translated and rounded to the nearest integer so that the superimposed coordinates are roughly in the middle of the image. The pixel coordinates which coincide with these superimposed coordinates are then set to one. The resulting signature image has a stroke width of one (see Figure 7c). In
order to obtain signatures with a stroke width of five, each
signature is dilated using a square morphological mask of dimension five (see Figure 7d).
Dolfing’s data set contains four types of forgeries: random forgeries, over-the-shoulder forgeries, home-improved
forgeries, and professional forgeries (see Section 1). A summary of the two data sets is given in Table 1.
Number of forgeries
Skilled
Casual
132
132
Professional Amateur
—
270
3000
Random
19 404
240 000
100
90
80
70
Error rates (%)
Data set
60
50
40
30
20
10
0
−0.1
0
0.1
0.2
0.3
0.4 0.5
0.6
0.7
0.8 0.9
1
Threshold
FRR (genuine)
FAR (skilled)
FAR (casual)
Figure 8: The Stellenbosch data set. Graphs for the FRR and the
FAR when d = 512, Θ = 128, N = 64, and = 1.
6.2. Experimental setup
The Stellenbosch data set
We consider 30 genuine signatures, 6 skilled forgeries, and 6
casual forgeries for each writer. For each writer, 10 genuine
signatures are used for training and 20 for testing. No genuine signatures are used for validation purposes.
Dolfing’s data set
We consider 30 genuine signatures for each writer, an average of 58.8 amateur forgeries per writer, and an average of
5.3 professional forgeries per writer. For each writer, 15 genuine signatures are used for training and 15 for testing. No
genuine signatures are used for validation purposes.
6.3. Results
The Stellenbosch data set
Let denote the number of allotted forward links in our
HMM. Figure 8 shows the FRR and FAR as functions of our
threshold parameter τ ∈ [−0.1, 1], when d = 512, Θ = 128,
N = 64, and = 1. The FRR, the FAR for a test set that
contains only skilled forgeries, and the FAR for a test set that
contains only casual forgeries are plotted on the same system of axes. When, for example, a threshold of τ = 0.16
is selected, equation (11) implies that all the test patterns
(w)
for which d(XTest , λw ) ≥ 1.16µw are rejected—the other patterns are accepted. When only skilled forgeries are considered, this threshold selection will ensure an EER of approximately 18%. When only casual forgeries are considered, our
algorithm achieves an EER of 4.5%.
Table 2 tabulates the EER as well as a local FRR and FAR,
for various values of d, Θ, N, and . It is clear that when the
dimension of the feature vectors is decreased from d = 512
to d = 256 or even to d = 128, the performance of the system is not significantly compromised. The performance of
our system is generally enhanced when the number of feature vectors, that is, T = 2θ, or the number of states in the
HMM, that is, N, is increased. The best results are obtained
when only one forward link is allowed in the HMM, that is,
when = 1.
Offline Signature Verification Using the DRT and a HMM
569
Table 2: The Stellenbosch data set: summary of results.
512
Θ
N
128
64
Skilled forgeries
Casual forgeries
512
128
Skilled forgeries
Casual forgeries
512
128
Skilled forgeries
Casual forgeries
512
128
Skilled forgeries
Casual forgeries
512
128
Skilled forgeries
Casual forgeries
256
128
64
64
FAR (%)
80
25.4
32.6
17.9
4.5
32
Skilled forgeries
Casual forgeries
128
32
16
Skilled forgeries
Casual forgeries
25.9
35.6
18.2
4.6
25.5
34.8
19.2
5.4
10.2
0.2
64
18.5
4.6
10.2
0.2
16
25.7
34.1
10.2
0.2
32
70
2
10.2
0.2
64
90
EER (%)
1
10.2
0.2
Skilled forgeries
Casual forgeries
256
128
32
Skilled forgeries
Casual forgeries
256
64
32
Skilled forgeries
Casual forgeries
128
FRR (%)
Error rates (%)
d
100
32.1
43.1
20.7
6.2
4
60
50
40
30
1
20
10
1
0
−0.1
25.3
32.6
17.7
4.5
1
10.2
0.2
26.4
35.6
19.4
5.4
10.2
0.2
25.4
34.8
24.6
34.8
18.3
5.4
0.2
0.2
38.7
48.4
22.0
6.2
0.2
0.3
0.4 0.5 0.6
Threshold
0.7
0.8
0.9
1
Figure 9: Dolfing’s data set. Graphs for the FRR and the FAR when
d = 512, Θ = 128, N = 64, and = 1.
18.4
5.3
10.2
0.2
0.1
FRR (genuine)
FAR (professional)
FAR (amateur)
1
10.2
0.2
0
1
Table 3: Dolfing’s data set: summary of results.
1
1
Dolfing’s data set
The results of our algorithm is compared to the results of an
algorithm that was developed by Hans Dolfing for his Ph. D.
thesis [6].
Dolfing developed HMM-based algorithms for the verification and recognition of dynamic signatures. Since our algorithm is suited for the verification of static signatures, that
is, signature images, we compare our results to the results
of Dolfing’s algorithm that only considers the spatial coordinates of each dynamic signature. It is important to note that,
in order to construct an HMM for each writer’s signature,
Dolfing’s algorithm also uses the sequence in which these
spacial coordinates were produced. Our algorithm is therefore at a disadvantage since it has no knowledge of the stroke
sequence, and simulated time evolution had to be created by
taking the DRT of each signature image.
EER (%)
Amateur forgeries
Dolfing’s algorithm
Our algorithm
13.3
12.2
Figure 9 shows the FRR and FAR as functions of our
threshold parameter τ ∈ [−0.1, 1], when d = 512, Θ = 128,
N = 64, and = 1. The FRR, the FAR for a test set that
contains only professional forgeries, and the FAR for a test
set that contains only amateur forgeries are plotted on the
same system of axes. The error rates for Dolfing’s algorithm,
when applied to only professional forgeries, were not published. For illustrational purposes however, we include our
FAR for only professional forgeries in Figure 9. When only
amateur forgeries are considered, our algorithm achieves an
EER of 12.2%. These results compare well with the results for
Dolfing’s algorithm. Dolfing’s algorithm (see [6, page 160])
achieves an EER of 13.3%. These results are tabulated in
Table 3.
7.
COMPUTATIONAL REQUIREMENTS
An automatic signature verification system can only be economically viable when the processing requirements are feasible. The practicality of our system as a real-time application
depends on the number of floating point operations (flops)
required to verify a test signature. The bulk of these flops are
570
EURASIP Journal on Applied Signal Processing
required to calculate the DRT. Much less flops are required to
match a set of feature vectors (which represents a test signature) with the HMM of the claimed writer’s signature.
DRT
We assume that the original image consists of Ψ pixels and
that Θ angles (between 0◦ and 180◦ ) are used to calculate the
DRT. When β (i.e., the number of beams per angle) is taken
to be equal to the highest dimension of the original image,
the number of flops required to calculate the DRT is on the
order of 4ΨΘ (see [23]). This implies that for an average image of 500 × 300 pixels, with Θ = 128 and β = 500, the
number of flops required to calculate the DRT is on the order of 76.8 × 10⁶ . With these parameters, an EER of 17.9% is
achieved when only skilled forgeries from the Stellenbosch
data set are considered. However, these computational requirements can be significantly reduced without compromising the performance of our system (see Table 2). The number of flops required to calculate the DRT of an image of
256 × 128 pixels, with Θ = 64 and β = 256, is on the order of 8.4 × 10⁶ . With these parameters, an EER of 18.4% is
achieved when only skilled forgeries from the Stellenbosch
data set are considered.
Matching
Since the states in our HMM are organised in a ring and the
dissimilarity value in (8) is based on an Euclidean distance
measure, the number of flops required to match an observation sequence with an HMM is on the order of T(N + d).
Therefore, despite the high dimensionality of the feature vectors, relatively few flops are required to match an observation
sequence with an HMM. With d = 512, T = 256, N = 64,
and = 1, on the order of only 147 456 flops are required.
With these parameters, an EER of 17.9% is achieved when
only skilled forgeries from the Stellenbosch data set are considered. With d = 256, T = 128, N = 32 and = 1, on the
order of only 36 864 flops are required. With these parameters, an EER of 18.4% is achieved when only skilled forgeries
from the Stellenbosch data set are considered (see Table 2).
8.
DISCUSSION, CONCLUSIONS, AND FUTURE WORK
The DRT is a stable and robust method of feature extraction.
The DRT creates simulated time evolution from one feature
vector to the next and enables us to model a signature with
an HMM. Our system is not sensitive to moderate levels of
noise, and the feature vectors are extracted in such a way that
rotation, shift, and scale invariance is ensured.
Given the robustness of our algorithm and the fact that
only global features are considered, satisfactory results are
obtained when our algorithm is applied to an independent
database (see Section 6.1) of 924 signatures from 22 writers.
These results compare well with the results for other systems
that only consider global features (see Sections 2 and 6.3).
When our algorithm is applied to Hans Dolfing’s
database of dynamic signatures (see Section 6.1), our results
compare well with an algorithm by Dolfing that only con-
siders the spatial coordinates of each dynamic signature (see
Section 6.3). This is despite the fact that our algorithm only
considers a static image of each signature, while Dolfing’s algorithm has knowledge of the sequence in which the spatial coordinates were produced. Dolfing’s database consists
of 4800 signatures from 51 writers.
Our system uses only global features. However, most recent systems also utilise local features for verification purposes, that is, features at stroke and substroke levels, and their
feature extraction techniques require extensive preprocessing
(see Section 2). Our system does not outperform all of these
systems. These systems do however utilise either a technique
or features that are fundamentally very different from ours.
This implies that it is very likely that a combination of their
systems and ours will result in a superior merged system,
making their approaches complementary to ours. We also expect a significant improvement in our results when local features are incorporated into our algorithm. This is currently
being investigated.
REFERENCES
[1] National Check Fraud Center, National Check Fraud Center
Report, 2000.
[2] S. Djeziri, F. Nouboud, and R. Plamondon, “Extraction of signatures from cheque background based on a filiformity criterion,” IEEE Trans. Image Processing, vol. 7, no. 10, pp. 1425–
1438, 1998.
[3] A. L. Koerich and L. L. Lee, “Automatic extraction of filledin information from bankchecks based on prior knowledge
about layout structure,” in Advances in Document Image Analysis: First Brazilian Symposium, vol. 1339 of Lecture Notes in
Computer Science, pp. 322–333, Curitiba, Brazil, November
1997.
[4] J. E. B. Santos, F. Bortolozzi, and R. Sabourin, “A simple methodology to bankcheck segmentation,” in Advances
in Document Image Analysis: First Brazilian Symposium, vol.
1339 of Lecture Notes in Computer Science, pp. 334–343, Curitiba, Brazil, November 1997.
[5] R. Plamondon and S. N. Srihari, “On-line and off-line handwriting recognition: a comprehensive survey,” IEEE Trans. on
Pattern Analysis and Machine Intelligence, vol. 22, no. 1, pp.
63–84, 2000.
[6] J. G. A. Dolfing, Handwriting recognition and verification. A
hidden Markov approach, Ph.D. thesis, Eindhoven University
of Technology, 1998.
[7] P. S. Deng, H. Y. M. Liao, C.-W. Ho, and H.-R. Tyan, “Waveletbased off-line handwritten signature verification,” Computer
Vision and Image Understanding, vol. 76, no. 3, pp. 173–190,
1999.
[8] T. Kaewkongka, K. Chamnongthai, and B. Thipakorn, “Offline signature recognition using parameterized hough transform,” in Proc. 5th International Symposium on Signal Processing and Its Applications, pp. 451–454, Brisbane, Australia,
1999.
[9] B. Fang, C. H. Leung, Y. Y. Tang, K. W. Tse, P. C. K. Kwok, and
Y. K. Wong, “Off-line signature verification by the tracking of
feature and stroke positions,” Pattern Recognition, vol. 36, pp.
91–101, 2003.
[10] B. Fang, Y. Y. Wang, C. H. Leung, et al., “Offline signature
verification by the analysis of cursive strokes,” International
Journal of Pattern Recognition and Artificial Intelligence, vol.
15, no. 4, pp. 659–673, 2001.
Offline Signature Verification Using the DRT and a HMM
[11] J. K. Guo, D. Doermann, and A. Rosenfeld, “Forgery detection by local correspondence,” International Journal of Pattern
Recognition and Artificial Intelligence, vol. 15, no. 4, pp. 579–
641, 2001.
[12] R. Sabourin, G. Genest, and F. Prˆ teux, “Off-line signature
e
verification by local granulometric size distributions,” IEEE
Trans. on Pattern Analysis and Machine Intelligence, vol. 19,
no. 9, pp. 976–988, 1997.
[13] C. Quek and R. W. Zhou, “Antiforgery: a novel pseudo-outer
product based fuzzy neural network driven signature verification system,” Pattern Recognition Letters, vol. 23, no. 14, pp.
1795–1816, 2002.
[14] B. Fang, C. H. Leung, Y. Y. Tang, P. C. K. Kwok, K. W. Tse, and
Y. K. Wong, “Off-line signature verification with generated
training samples,” IEE Proceedings - Vision, Image and Signal
Processing, vol. 149, no. 2, pp. 85–90, 2002.
[15] Y. Mizukami, M. Yoshimura, H. Miike, and I. Yoshimura, “An
off-line signature verification system using an extracted displacement function,” Pattern Recognition Letters, vol. 23, no.
13, pp. 1569–1577, 2002.
[16] H. Baltzakis and N. Papamarkos, “A new signature verification technique based on a two-stage neural network classifier,”
Engineering Applications of Artificial Intelligence, vol. 14, pp.
95–103, 2001.
[17] A. El-Yacoubi, E. J. R. Justino, R. Sabourin, and F. Bortolozzi, “Off-line signature verification using HMMs and
cross-validation,” in IEEE International Workshop on Neural
Networks for Signal Processing, pp. 859–868, Sydney, Australia,
December 2000.
[18] E. J. R. Justino, F. Bortolozzi, and R. Sabourin, “Off-line signature verification using HMM for random, simple and skilled
forgeries,” in International Conference on Document Analysis and Recognition, vol. 1, pp. 105–110, Seattle, Wash, USA,
2001.
[19] F. Leclerc and R. Plamondon, “Automatic signature verification: the state of the art, 1989–1993,” International Journal of
Pattern Recognition and Artificial Intelligence, vol. 8, no. 3, pp.
643–660, 1994.
[20] R. Plamondon and G. Lorette, “Automatic signature verification and writer identification—the state of the art,” Pattern
Recognition, vol. 22, no. 2, pp. 107–131, 1989.
[21] R. Sabourin, R. Plamondon, and G. Lorette, “Off-line identification with handwritten signature images: survey and perspectives,” in Structured Document Image Analysis, H. Baird,
H. Bunke, and K. Yamamoto, Eds., pp. 219–234, SpringerVerlag, NY, USA, 1992.
[22] J. Gupta and A. McCabe, “A review of dynamic handwritten signature verification,” Tech. Rep., James Cook University,
Australia, 1997.
[23] R. N. Bracewell, Two-Dimensional Imaging, Prentice-Hall,
Englewood Cliffs, NJ, USA, 1995.
[24] L. R. Rabiner, “A tutorial on hidden Markov models and selected applications in speech recognition,” Proceedings of the
IEEE, vol. 77, no. 2, pp. 257–286, 1989.
[25] J. R. Deller Jr., J. H. L. Hansen, and J. G. Proakis, DiscreteTime Processing of Speech Signals, IEEE Press, Piscataway, NJ,
USA, 1999.
[26] R. Auckenthaler, M. Carey, and H. Lloyd-Thomas, “Score normalization for text-independent speaker verification systems,”
Digital Signal Processing, vol. 10, no. 1, pp. 42–54, 2000.
571
J. Coetzer received his M.S. in applied
mathematics from the University of the Free
State, Bloemfontein, South Africa, in 1996.
After an initial five years at the Department
of Mathematics and Applied Mathematics,
the University of the Free State, he joined
the Department of Applied Mathematics,
the University of Stellenbosch in mid 2002.
His current research interests include pattern recognition and computer vision.
B. M. Herbst received his Ph.D. in applied
mathematics from the University of the Free
State, Bloemfontein, South Africa, in 1982.
He visited the University of Dundee as a
postdoc during 1983 and was a Visiting
Associate Professor at Clarkson University,
Potsdam, NY (from 1988 to 1989) and the
University of Colorado, Boulder (from 1989
to 1990 and again during 1994). He joined
the Department of Applied Mathematics at
the University of Stellenbosch in 1998. His current research interests include scientific computation, pattern recognition, and computer vision.
J. A. du Preez received his Ph.D. in electronic engineering from the University of
Stellenbosch, South Africa, in 1998, on the
topic “Efficient high-order hidden Markov
modelling.” After an initial four years in the
telecommunications sector, he joined the
Department of Electrical and Electronic Engineering, the University of Stellenbosch in
mid 1989. Active in the broader fields of signal processing and pattern recognition, his
research focuses on biometrics and speech processing.