Báo cáo hóa học: " A Novel Speech/Noise Discrimination Method for Embedded ASR System" pot
Bạn đang xem bản rút gọn của tài liệu. Xem và tải ngay bản đầy đủ của tài liệu tại đây (787.65 KB, 6 trang )
EURASIP Journal on Applied Signal Processing 2004:11, 1721–1726
c
2004 Hindawi Publishing Corporation
A Novel Speech/Noise Discrimination Method
for Embedded ASR System
Bian Wu
Institute of Image Processing & Pattern Recognition, Shanghai Jiaotong University, Shanghai 200030, China
Email: wu
Xiaolin Ren
Motorola Labs China Research Center, Shanghai 200041, China
Email:
Chongqing Liu
Institute of Image Processing & Pattern Recognition, Shanghai Jiaotong University, Shanghai 200030, China
Email:
Yaxin Zhang
Motorola Labs China Research Center, Shanghai 200041, China
Email:
Received 30 October 2003; Rev ised 8 February 2004; Recommended for Publication by Sadaoki Furui
The problem of speech/noise discrimination has become increasingly important as the automatic speech recognition (ASR) sys-
tem is applied in the real world. Robustness and simplicity are two challenges to the speech/noise discrimination method for an
embedded system. The energy-based feature is the most suitable and applicable feature for speech/noise discrimination for em-
bedded ASR system because of effectiveness and simplicity. A new method based on a noise model is proposed to discriminate
speech signals from noise signals. The noise model is initialized and then updated according to the signal energy. The experiment
shows the effectiveness and robustness of the new method in noisy environments.
Keywords and phrases: noise robustness, speech/noise discrimination, automatic speech recognition.
1. INTRODUCTION
The problem of speech/noise discrimination has become in-
creasingly important as the automatic speech recognition
(ASR) system is applied in the real world. Robustness and
simplicity are the basic requirements of a speech/noise dis-
crimination method for an embedded ASR system. The dis-
crimination method should be robust in various noisy envi-
ronments at various SNRs. Low complexity is another chal-
lenge because of the requirement of real-time and the lim-
itation of embedded system. Early algorithms [1, 2]failin
low SNR environments. Many recently proposed methods,
such as [3, 4, 5, 6], are not designed deliberately for real-
time embedded system. Some employ expensive methods,
such as higher-order statistics (HOS) [3], which improve
the robustness at the cost of greatly increased computa-
tional complexity. Others propose some low-cost methods,
such as entropy [4], which is only effective in some environ-
ments.
2. THE NOISE MODEL
The energy-based feature is the most suitable and applica-
ble feature for speech/noise discrimination for embedded
ASR system because of effectiveness and simplicity. The full-
band energy fails at low SNR. Hereby the subband energy [7]
is proposed to improve the robustness. Speech shows char-
acteristically uneven distribution of energy in different fre-
quencies, and the characteristic of noise is alien to that of
speech. From the angle of the background noise, the intru-
sion of speech wil l cause the variation of the spectrum char-
acteristic.
The energy spectrum of the noise is modeled by a multi-
dimensional Gaussian distribution N(µ, Σ). Σ is assumed to
be a diagonal matrix for the sake of simplicity. Then the noise
model can be expressed as N(µ, σ
2
). If there are J subbands,
µ =
µ
1
µ
2
µ
3
··· µ
J
,
σ
2
=
σ
2
1
σ
2
2
σ
2
3
··· σ
2
J
.
(1)
1722 EURASIP Journal on Applied Signal Processing
A score is computed for each frame as such:
Score
O
i
=
1
√
2πσ
e
−(O
i
−µ)
2
/2σ
2
,(2)
where O
i
= (
O
i,1
O
i,2
O
i,3
··· O
i,J
)
is the energ y spec-
trum vector for each frame.
Therefore if the spectral character of the frame is similar
to that of the noise, the score will be high, and vice versa. The
frequency energy in 250–3500 Hz is used because the bulk
of energy of human speech exists in the band. Then the band
250–3500 Hz is divided into several subbands evenly. The en-
ergy spectrum vector O
i
consists of the spectral energy in
each band.
Without a priori knowledge of the characteristic of noise,
the noise model must be initialized according to the work-
ing environment. In practice we assume that there is at least
100–250 millisecond pure noise preceding the actual speech.
By using these frames the noise model can be easily seeded.
Moreover, if current frame is classified as noise, the model
will be updated by the energy spectrum of the frame. This
procedure, which utilizes an iterative method, makes the
model follow up the variation of the noise and be a more suf-
ficient statistics to the character of the environmental noise.
The updated formula is
µ
n+1
=
µ
n
· n + N
n+1
n +1
,
σ
2
n+1
=
(n − 1) · σ
2
n
+
N
n+1
− µ
n
2
n
−
µ
n+1
− µ
n
2
,
(3)
where µ
n+1
, σ
2
n+1
and µ
n
, σ
2
n
are the mean vector and variance
vector after and before updating, respectively, n the number
of noise frames before the update, and N
n+1
the noise frame
to update the model. In real environments the background
noise varies. It is reasonable to fix n when it is greater than
a certain number, which we choose as 32, so that the update
procedure needs a short-period memory rather than remem-
bering the whole utterance. Therefore µ
n+1
and σ
2
n+1
are in
fact the maximum likelihood estimator (MLE) in a slipping
window of noise fr a mes. By these means, the algorithm will
work well for both long-term stationary and time-varying
noise.
The speech/noise discrimination does not add much to
the computational cost of the overall ASR system. The energy
spectr um is the interproduct of a standard front end. The
logarithm form of the noise model score is employed instead
of formula (2):
Score
O
i
=
O
i
− µ
2
σ
2
+ln
σ
2
=
j
O
i, j
− µ
j
2
σ
2
j
+ln
σ
2
j
,
(4)
1
0
−1
66 5 4599
(a)
(b)
(c)
Time/frame
0 50 100 150 200 250 300
30
20
10
0
0 50 100 150 200 250 300
0
50
100
150
200
0 50 100 150 200 250 300
Figure 1: Contour curves of short-time energy and noise model
score: (a) waveform (SNR < 10dB), (b) short-time energy, and (c)
noise model score.
where O
i, j
is the jth subband of the ith frame, µ
j
and σ
2
j
the
jth subbands of the µ vector, and σ
2
vector, respectively. The
computational complexity of the score can be lowered. In fact
the conversion to logarithm form is not optional but manda-
tory. For fixed-point computation, the logarithm form can
get better precision than the original one.
Moreover, the division of subband does not increase
the cost because no mathematical computation is im-
ported. The iterative update procedure requires a few
calculations, which also satisfies the requirement of low
cost.
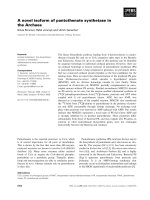
Figure 1 shows the waveform and the contour curves
of short-time energy and noise model score of an En-
glish digit string “6654599.” It can be seen that the noise
model score outperforms the short-time energy in pat-
tern classification because of a much greater distance be-
tween noise frame and speech frame, and it can also achieve
a good discrimination between fricative frame and noise
frame.
3. EXPERIMENT
Li et al. proposed a robust method to discriminate speech
from noise in [8]. The method is also designed deliberately
for real-time implementation. The method is based on a fil-
ter, which can be operated as a moving-average filter in the
full-band energy feature:
F(t)
=
W
i=−W
h(i)g(t + i), (5)
where g(
·) is the energy feature, h(·) the filter coefficients,
Speech/Noise Discrimination Method for Embedded ASR 1723
W the filter size, and t the current frame number. Here,
we set W = 13.
1
The filter has positive response to an up-
ward sloping shape, negative response to a downward slop-
ing shape, and a near-zero response to a flat shape. Therefore
F(t) >T
U
> 0 indicates a beginning point and F(t) <T
L
< 0
an ending point. The frames between beginning and ending
points are classified as speech.
Experiments had been carried out to evaluate the pro-
posed method. The noise model score was computed for each
frame and it was then compared with a threshold. According
to formula (4), a frame was classified as speech when its score
was greater than the threshold.
The discrimination method will be used in mobile
phone, which will work in any real world environment. So
the evaluation database was collected from mobile cellular
phone with 8 kHz sampling rate in various natural noisy en-
vironments. The environments include office, park, airport,
street, and car at different speeds. The noise in the office en-
vironment is usually air-condition fan noise, the noise in the
park environment is usually wind noise, and the noise in
the airport and the st reet environment is usually background
babble noise. But the airport environment has acoustic echo
effect. The noise in the car environments is usually engine
noise at different speeds such as idle, 10 mph, 45 mph, and
variable speed. The database contains only pure digit strings
and the string lengths vary from one to eight. There are four
sets, quoted as 01 to 04, in the database. Each set includes
more than 5000 strings (more than 20 000 digits) in all en-
vironments mentioned above. Also the database is collected
for different persons. From 01 to 03 the average SNRs are
15 dB, 10 dB, and 5 dB, respectively, and noise level is stable
in the duration of each utterance. In 04 the average SNR is
also 5 dB, but the noise level varies in the duration of each
utterance. The proposed method was compared with Li’s
method. The results of the two methods were compared to
the hand label. Though the two methods give the discrimi-
nating results in different ways, where one gives endpoints,
and the other frame classification results, they are essentially
the same.
There are two kinds of error: one is misclassification of
noise as speech (error I) and the other is misclassification of
speech as noise (error II). The fault risks of misclassification
between noise and speech are quite different. Error II can re-
sult in a fatal deletion error. However, even if noise is mis-
taken for speech, we still have chances to reduce the fault risk
by later processing. Therefore misclassifying noise as speech
is preferred to misclassifying speech as noise. Then the clas-
sifier should satisfy the following formula:
p
S | O
i
∈ N
>p
N | O
i
∈ S
. (6)
1
The coefficients of the half of the filter are [h(0) ···h(13)] = [0,
0.350840, 0.643411, 0.850980, 0.967861, 0.999647, 0.957534, 0.855350,
0.708377, 0.533398, 0.349536, 0.179580, 0.051519, 0.000006], and the other
half coefficients are set according to h(
−i) =−h(i).
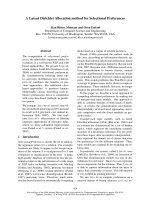
The experimental results are shown in Figure 2,where
Figures 2a–2d show the ROC curves of the two methods in
sets 01–04, respectively. According to formula (6), only the
part of the ROC curve above the diagonal line is relevant to
thecurrentstudy.ItisseenfromFigure 2 that for each set the
ROC curve of the model-based method is always above that
of the filter-based method in the part above the diagonal line.
So the model-based method outperforms the filter-based one
in each set.
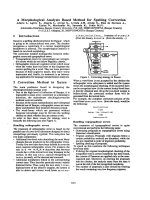
All the ROC curves of the model-based method are
then put into one figure (Figure 3). It is seen from Figure 3
that though the average SNR in each dataset is quite dif-
ferent, the ROC curves of the model-based method do not
show great difference, especially the part above the diago-
nal line, which means that the performance of the model-
based method does not vary with the variation of the
SNR.
In the above experiment, the frequency band 250–
3500 Hz is divided into 26 subbands evenly. The num-
ber of the bands wil l determine the proposed method in
terms of performance and cost. Though the performance
improves as the number of the subbands increases, the
computational cost also increases. So there is a tra de-off
between performance and cost. Table 1 shows the correct
rate p(S | O
i
∈ S) of the model-based method in three
cases of the subbands number. The thresholds in the three
cases are set according to the same method, which makes
the operating point of the ROC curve above the diago-
nal line. The computational cost of 26 subbands is about
one forth of that of 104 subbands, w hile the correct rate
of each set decreases slightly. When the number of sub-
bands decreases from 26 to 1 (short-term full-band en-
ergy), the performance degrades greatly. Good balance is
shown between the cost and performance in the 26 subband
case.
4. CONCLUSIONS
We propose a robust method for speech/noise discrimi-
nation in noisy environments. The experiment shows that
the new method outperforms the filter-based method pro-
posed by Li in each dataset. By setting a proper oper ating
point on the ROC curve, the performance of the method
can satisfy formula (6). The method can be incorporated
with some logic such as the automaton in [8]tomakeafi-
nal discrimination. The method has been incorporated into
an SI open-vocabulary ASR on Compaq iPAQ. The mem-
ory cost of fixed-point implementation does not exceed
30 KB in comparison with about 300 KB used by overall sys-
tem.
From the experiment results, we realize that the new
method generates less gain in the nonstable SNR situation.
In 26 subband case it generates 90.02% correct rate in set
03, compared with only 87.26% in set 04, which in fact has
the same average SNR as set 03. This indicates that we may
need a more robust noise model update scheme in the future
work.
1724 EURASIP Journal on Applied Signal Processing
1
0.9
0.8
0.7
0.6
0.5
0.4
0.3
0.2
0.1
0
00.20.40.60.81
Probability of error I
Correct rate
Model-based
Filter-based
(a)
1
0.9
0.8
0.7
0.6
0.5
0.4
0.3
0.2
0.1
0
00.20.40.60.81
Probability of error I
Correct rate
Model-based
Filter-based
(b)
1
0.9
0.8
0.7
0.6
0.5
0.4
0.3
0.2
0.1
0
00.20.40.60.81
Probability of error I
Correct rate
Model-based
Filter-based
(c)
1
0.9
0.8
0.7
0.6
0.5
0.4
0.3
0.2
0.1
0
00.20.40.60.81
Probability of error I
Correct rate
Model-based
Filter-based
(d)
Figure 2: Comparison of ROC curves of two methods in each dataset.
APPENDIX
DERIVATION OF FORMULA (3)
For a Gaussian distribution
p(x) =
1
σ
√
2π
e
−(x−µ)
2
/2σ
2
,(A.1)
ˆ
µ =
x
i
n
,(A.2)
ˆ
σ
2
=
x
i
−
ˆ
µ
2
n
(A.3)
are the MLEs of mean and variance, respectively. An unbi-
ased estimator that converges more closely to the true value
as the sample size increases is called a consistent estimator.
The mean estimator (A.2) is also an unbiased and consis-
tent estimator . The (A.3) of the Gaussian distribution was
obtained using MLE. This estimator of the true variance is a
biased one. The consistent estimate of the variance is given
by
ˆ
σ
2
c
=
x
i
−
ˆ
µ
2
n − 1
. (A.4)
Speech/Noise Discrimination Method for Embedded ASR 1725
1
0.9
0.8
0.7
0.6
0.5
0.4
01
02
03
04
00.20.40.60.81
Probability of error I
Correct rate
Figure 3: Comparison of ROC curves of the proposed method.
Table 1: The correct rate (%) in different conditions of the sub-
bands numbers.
Sets 1 26 104
01 80.25 91.23 92.53
02 77.39 90.85 91.96
03 76.24 90.02 90.48
04 70.34 87.26 90.01
Note that for larger values of n,
ˆ
σ
2
=
ˆ
σ
2
c
.
ˆ
µ
n
=
n
x
i
n
,
ˆ
µ
n+1
=
n+1
x
i
n +1
=
n
x
i
+ x
n+1
n +1
=
n ·
ˆ
µ
n
+ x
n+1
n +1
,
ˆ
σ
2
n
=
n
x
i
−
ˆ
µ
n
2
n − 1
,
ˆ
σ
2
n+1
=
n+1
x
i
−
ˆ
µ
n+1
2
n
=
n
x
i
−
ˆ
µ
n+1
2
+
x
n+1
−
ˆ
µ
n+1
2
n
=
n
x
i
−
ˆ
µ
n
+
ˆ
µ
n
−
ˆ
µ
n+1
2
+
x
n+1
−
ˆ
µ
n
+
ˆ
µ
n
−
ˆ
µ
n+1
2
n
=
(n−1)
ˆ
σ
2
n
+2
ˆ
µ
n
−
ˆ
µ
n+1
n+1
x
i
−
ˆ
µ
n
n
+
n ·
ˆ
µ
n
−
ˆ
µ
n+1
2
+
x
n+1
−
ˆ
µ
n
2
+
ˆ
µ
n
−
ˆ
µ
n+1
2
n
=
(n − 1)
ˆ
σ
2
n
+
x
n+1
−
ˆ
µ
n
2
n
−
n +1
n
ˆ
µ
n+1
−
ˆ
µ
n
2
.
(A.5)
Since for larger values of n,(n+1)/n is 1, we finally write
ˆ
σ
2
n+1
as
ˆ
σ
2
n+1
=
(n − 1)
ˆ
σ
2
n
+
x
n+1
−
ˆ
µ
n
2
n
−
ˆ
µ
n+1
−
ˆ
µ
n
2
. (A.6)
REFERENCES
[1] X. Huang, A. Acero, and H. W. Hon, Spoken Language Pro-
cessing: A Guide to Theory, Algorithm, and System Development,
Prentice-Hall, Upper Saddle River, NJ, USA, 2001.
[2] A. Ganapathir aju, L. Webster, J. Trimble, K. Bush, and P. Ko-
rnman, “Comparison of energy-based endpoint detectors for
speech signal processing,” in Proceedings of the IEEE Southeast-
con ’96, pp. 500–503, Tampa, Fla, USA, April 1996.
[3] E. Nemer, R. Goubran, and S. Mahmoud, “Robust voice activ-
ity detection using higher-order statistics in the LPC residual
domain,” IEEE Trans. Speech and Audio Processing, vol. 9, no. 3,
pp. 217–231, 2001.
[4] P. Renevey and A. Drygajlo, “Entropy based voice activity de-
tection in very noisy conditions,” in Proc. 7th European Confer-
ence on Speech Communication and Technology (EUROSPEECH
’01), vol. 3, pp. 1887–1890, Aalborg, Denmark, September
2001.
[5] W H. Shin, B S. Lee, Y K. Lee, and J S. Lee, “Speech/non-
speech classification using multiple features for robust end-
point detection,” in Proc. IEEE Int. Conf. Acoustics, Speech,
Signal Processing (ICASSP ’00), vol. 3, pp. 1399–1402, Istanbul,
Turkey, 2000.
[6] G D. Wu and C T. Lin, “Word boundary detection with mel-
scale frequency bank in noisy environment,” IEEE Trans. Acous-
tics, Speech, and Signal Processing, vol. 8, no. 5, pp. 541–554,
2000.
[7] R. Hariharan, J. Hakkinen, and K. Laurila, “Robust end-of-
utterance detection for real-time speech recognition applica-
tions,” in Proc. IEEE Int. Conf. Acoustics, Speech, Signal Pro-
cessing (ICASSP ’01), vol. 1, pp. 249–252, Salt Lake City, Utah,
USA, 2001.
[8] Q. Li, J. Zheng, A. Tsai, and Q. Zhou, “Robust endpoint detec-
tion and energy normalization for real-time speech and speaker
recognition,” IEEE Trans. Acoustics, Speech, and Signal Process-
ing, vol. 10, no. 3, pp. 146–157, 2002.
Bian Wu was born in Jiangxi, China in 1977.
He received his B.S. degree in electrical en-
gineering from Shanghai Tiedao University,
Shanghai, China in 1999. He is currently
pursuing the Ph.D. degree in pattern recog-
nition and intelligent system from Shanghai
Jiaotong University, Shanghai, China. Since
2001, he has also been a joint Ph.D. stu-
dent in Motorola Labs China Research Cen-
ter. His current research interests are speech
recognition in noisy environments, adaptive speech signal process-
ing, and multimedia system. He is now working with researchers
and engineers at Motorola on the applications of speech recogni-
tion on embedded mobile devices.
Xiaolin Ren was born in 1973 in Zhejiang,
China. He received his B.S. degree in 1994 in
electronic engineering from Zhejiang Uni-
versity at Xiqi, Hangzhou, China, M.S. de-
gree in 1997 in communications and elec-
tronic systems from Nanjing University of
Science and Technology, Nanjing, China,
and Ph.D. degree in 2000 in circuits and
systems from Shanghai Jiaotong University,
Shanghai, China, respectively. Since 2000 he
has been with Motorola China Research Center, Shanghai, China.
His research interests include nonlinear signal processing, speech
processing, speech recognition, and applications of speech recog-
nition i n embedded systems such as mobile phones and PDAs.
1726 EURASIP Journal on Applied Signal Processing
Chongqing Liu received his B.S. degree in
electrical engineering from Shanghai Jiao-
tong University, Shanghai, China, in 1961.
He is a Professor of pattern recognition
and intelligence system, and Director of the
Pattern Recognition and Computer Vision
Program. His principal interests are in digi-
tal information processing, pattern recogni-
tion, and computer vision. His current re-
search activities include human face recog-
nition, speech, and objects detection and t racking.
Yaxin Zhang graduated from Xidian Uni-
versity, Xi’an, China, in 1977. He was a Lec-
turer in a number of universities in China
from 1977 to 1990. He received the Ph.D.
degree in electronic engineering from the
University of Western Australia in 1996. He
worked for Motorola Australian Research
Center from 1996 to 2000. Now he is a
Distinguished Member of Technical Staff
and the Senior Research Manager of speech
recognition in Motorola China Research Center in Shanghai. His
research interests include speech signal processing and automatic
speech recognition.