Báo cáo hóa học: " Filters Ranking for DWT-Domain Robust Digital Watermarking" potx
Bạn đang xem bản rút gọn của tài liệu. Xem và tải ngay bản đầy đủ của tài liệu tại đây (702.37 KB, 9 trang )
EURASIP Journal on Applied Signal Processing 2004:14, 2093–2101
c
2004 Hindawi Publishing Corporation
Filters Ranking for DWT-Domain Robust
Digital Watermarking
Martin Dietze
Department of Information Systems, University of Bucking ham, Buckingham MK18 1EG, UK
Email:
Sabah Jassim
Department of Information Systems, University of Bucking ham, Buckingham MK18 1EG, UK
Email:
Received 30 March 2003; Revised 24 September 2003
In recent years a number of wavelet-based watermarking schemes have been proposed and exhibited improved qualities. The
choice of a wavelet filter bank for a digital watermarking scheme can have a significant influence on the scheme’s performance in
terms of image quality and robustness. We present the results of experiments conducted using two different embedding algorithms
(one blind and one nonblind) using a number of popular filter banks. The aim is to find filters that exhibit optimal performance
with respect to specified requirements. The results demonstrate that the subband depth of embedding has the most significant
influence on the filter bank choice. The kind of attack and the kind of embedding are also important, while marking intensity and
compression ratio seem to affect the perfor mance to a less extent. Additionally we show that out of the two embedding methods
the quantization-based blind one leads to better overall results than the popular, nonblind one.
Keywords and phrases: watermarking, embedding, SCS, spread spectrum, wavelet, filters.
1. INTRODUCTION
Robust digital watermarking (e.g., for copyrig ht protection)
has gained increasing importance with the availability and
popularity of Internet and eCommerce applications. Digital
object formats do not restrict copying or further distribution
of image files. Watermarking is used to assert rightful own-
ership or track down pirate copies by previous invisible em-
bedding of a logo or a serial number into the file. The perfor-
mance of watermarking schemes is measured in terms of two
rather contradicting requirements: imperceptibility (i.e., op-
timally minimum image degradation) and robustness (i.e.,
withstanding various attacks that aim to remove the water-
mark or render it undetectable). Benchmarking tools like
StirMark [1] combine most attacks and show that most ex-
isting watermarking schemes are vulnerable.
The advantages of DWT-based watermarking are well-
accepted, still apart from our own work [2] little is said in
the literature about how the choice of a filter bank affects a
watermarking scheme’s performance. In [3], Fei et al. discuss
the choice of a transform domain for watermarking, and in
[4], Wolfgang et al. look at the effect of matching the domain
of marking to the domain for lossy compression, yet both pa-
pers do not discuss the effect of a chosen domain’s individual
parameters.
Besides the choice of a filter bank, a DWT marking
scheme’s performance depends on features, like subband
depth and the decomposition scheme used. Characteristics
shared with nonwavelet-based schemes are the embedding
technique and embedding intensity. Due to the DWT’s spa-
tial support, variation in texture, details, and gray scale/color
arelikelytohavesomeimpacttoo.
Recent watermarking schemes use a variety of differ-
ent measures to achieve robustness. Most such schemes
(see [5]) have a number of things in common: significant
wavelet coefficients are chosen for embedding, information
is embedded in single coefficients (normally through addi-
tive/multiplicative embedding), and often both blind or non-
blind embedding are possible, resulting in different levels of
robustness.
Different marking schemes may differ in the exact choice
of coefficients for embedding, the algorithm that locates em-
bedded mark, the intensity of embedding, the nature of the
watermark (statistically undetectable, kind of message, etc.),
and the detection device and decision process. Some schemes
are designed to perform specific measures against certain at-
tacks.
In this paper, we extend the work reported in [2],
and compare the performance of some well-known filters
2094 EURASIP Journal on Applied Signal Processing
in terms of image degradation resulting from embedding
and the watermark quality after attacks. Locating previously
marked coefficients does not really depend on the chosen fil-
ter bank, we thus focus on how particular filters cope with
changes to marked coefficients.
For our experiments, we implemented a very simple wa-
termarking scheme based on the common features listed
above, which also allows to choose from two alternative em-
bedding algorithms. We use 7 quality levels of JPEG compres-
sion and, to test for dependencies between the results and the
kind of compression, a DWT-based compression at 4 differ-
entratiosasanattackon8different images. We then com-
pare the results achieved with different filters to obtain gen-
eral rankings.
Our results indicate that though there is no one opti-
mal filter bank, good compromise choices can be found that
can even be further optimized through additional measures.
Also, one of the used embedding algorithms clearly outper-
forms the other more popular one.
The rest of the paper is organized as follows: in Section 2
we describe the watermarking system, the test course, and the
tested filters and images. We then present and discuss our re-
sults in Sections 3 and 4. Appendix A contains the filter rank-
ings and further information.
2. EXPERIMENTAL SETUP
2.1. The watermarking system
Our watermarking scheme shares the most commonly used
features listed above and allows choosing between two differ-
ent embedding techniques. For marking, the image is first de-
composed into the DWT domain by a given number of steps
using the Pyramid decomposition and a given filter bank. As-
suming that the watermark is of size n, the n most signif-
icant coefficients are picked from appropriate chosen mark-
ing subbands. For simplicity we store the marked coefficients’
positions as part of the key needed for extracting the mark
since the significant coefficients are likely to change position
after marking. For embedding a mark bit m
i
in an image
coefficient x
i
with a given intensity, we use two alternative
algorithms—a nonblind and a blind one—that are explained
in more detail below. After embedding, the image is recon-
structed by using the inverse transform, and values outside
the range [0–255] will be truncated to fit into it. We use the
mean square error (MSE) to measure marking image degra-
dation.
For detection, the marked image is decomposed, and the
previously stored information on the embedding positions
and—if applicable—original values are used to extract the
mark. The embedded watermark is a binary image. Thus only
ones and zeroes are embedded. The choice of such a water-
mark was inspired by [6]. For deciding about the presence
of a mark, both, the human eye and an automatic detection
device can be used to compare the detected with the original
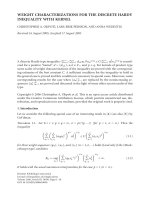
watermark. Because we mark coefficients sorted by their ab-
solute values, it is easy to see which of them suffered worst
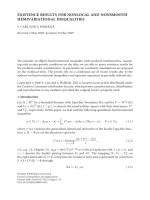
from an attack (Figure 1).
Figure 1: The watermark before and after attacks.
2.2. The nonblind embedding algorithm
The nonblind embedding method is similar to the popu-
lar DCT-based spread spectrum scheme proposed in [7]
(throughout this paper, x
i
denotes coefficients before and y
i
after marking, m
i
mark bits, and x
i
, y
i
, m
i
values obtained
from a possibly attacked image):
y
i
= x
i
1+αm
i
. (1)
Embedding intensity is controlled by α. To extract the water-
mark, the original values are needed:
m
i
=
y
i
− x
i
αx
i
. (2)
This multiplicative algorithm keeps the modification/values
ratio constant, and its nonblind detection is independent
from the host data.
For our experiments, we marked images using subband
depths of 1, 2, and 3 and intensities ranging from 20%–80%
on each of those subband depths.
2.3. The blind embedding algorithm
An obvious and a more practical choice of a blind scheme
would be a variant of the above spread spectrum method.
However, the detection scheme does not effect the measures
under consideration (i.e., robustness and image degrada-
tion). Therefore, we chose an algorithm that changes coef-
ficients in a way that differs from that done by the spread
spectrum one.
The SCS embedding method was proposed by Eggers et
al. [8] for the spatial domain. We use it for marking DWT
coeffi cients and thus call it DWT-SCS:
y
i
= x
i
+ α
Q
∆
x
i
− ∆
d
i
2
+ k
i
− x
i
+ ∆
d
i
2
+ k
i
. (3)
The system uses a linear quantizer Q with the stepwidth ∆.
The key k is a pseudorandom sequence with k
i
∈ (0, 1]. The
embedding intensity is controlled mainly by the ∆ parameter
while α can be used to control the tradeoff between maxi-
mizing robustness by placing the mark near the center of a
quantization cell and keeping the image distortion low. Since
we are embedding binary sequences, the codeword d
i
is taken
from the alphabet D ={0, 1}. For extraction, the pseudo-
random sequence k and the step width ∆ are needed:
m
i
= Q
∆
y
i
− ∆k
i
−
y
i
− ∆k
i
. (4)
Filters Ranking for DWT-Domain Robust Digital Watermarking 2095
Although detection is again independent of the host data,
SCS does not keep the modfication/values ratios constant. It
results in limited absolute changes for any combinations of ∆
and α.
We marked images using subband depths of 1, 2, and 3,
each with 13 different intensity settings with ∆ ranging from
20.0 to 120.0. Due to the different ways these settings change
the DWT coefficients, comparing the results from the mul-
tiplicative and the DWT-SCS embedding is not str aightfor-
ward. Instead of the normalised rankings, we thus use the
robustness/image quality tradeoff.
2.4. The L
q
d
quality measurement
To measure the watermark quality, we implemented a simple
tolerant image comparison tool using a measure we call L
q
d
,
derived from the L
q
pseudonorm introduced by Jacobs et al.
[9]. The L
q
measure is an image querying metric that uses
truncated quantized versions of the wavelet decomposition
and contains only the most significant information content
of an image. The L
q
distance between two images essentially
measures the differences in their most significant wavelet co-
efficients. For two images I
1
and I
2
, fully decompose, select
a fixed percentage of their most significant coefficients, set
those values to 1 or −1 (depending on their original signs)
and the rest to 0, and the sum of weighted differences be-
tween the corresponding nonzero pixel values in I
1
and I
2
is
the L
q
(I
1
, I
2
). The weights are subband dependent. Our L
q
d
differs from the L
q
in discarding the images’ average (i.e.,
LL) component. Also, since the summing up of the scores
is asymmetric, the L
q
d
uses the lower of both possible values
multiplied by a normalization factor as the result (see [2]for
more details).
Measuring how well the mark is recognizable rather than
the amount of distortion the L
q
d
mimics the way a human
would try to read the watermark. This makes it a better
choice than, for example, the MSE for the purpose of mea-
suring a detected watermark’s quality. We use experimentally
obtained threshold categories for the watermark detection
quality: clearly (< 21), still (< 25), partly (< 31), or only in
traces (< 34) detectable.
2.5. The filters and images used
The filters used (coefficients taken from Davis’ wavelet cod-
ing kit [10]) are given in Table 1.
The 8 images used in our tests are all gray-scale pic-
tures of 512 × 512 pixel size. Most are well known in
the watermarking community and in the public domain.
They are available at our project pages in the Inter-
net ( />papers/filter evaluation).
3. RESULTS AND DISCUSSION
The image degradation and watermark quality were tested
against the following parameters: choice of filter, watermark
intensity, (lossy) compression ratio, decomposition scheme,
the chosen subband depth for marking, and the image it-
self. As the optimal choice of filter was our primary interest,
Table 1
Name Orthogonality Length
Haar Orthogonal 2
Daub4 Orthogonal 4
Daub6 Orthogonal 6
Daub8 Orthogonal 8
Antonini Biorthogonal 9/7
Odegard Biorthogonal 9/7
Villa2 Biorthogonal 13/11
Villa3 Biorthogonal 6/10
Villa4 Biorthogonal 5/3
Villa5 Biorthogonal 2/6
Villa6 Biorthogonal 9/3
we needed to look at all possible combinations of the other
four parameters. Some of these are controllable within the
scheme, others, like the image and the kind of attack, are be-
yond one’s control in real-life watermarking. Also the filters’
performance was found to depend only on some of them in a
way that changing a parameter results in different rankings.
Our results reveal that the most significant correspon-
dences between particular parameters and a filter’s ranking
are the subband depth for marking, the embedding method,
and the kind of compression attack. The embedding inten-
sity and the compression ratio made only little difference.
This observation is of significant interest to all wavelet-based
watermarking schemes. Consequently we grouped the rank-
ing results by these three most sig nificant parameters. The
full rankings averaged over all tested images are shown in
Appendix A.
3.1. Image degradation
Image degradation caused by watermarking was found to
depend mostly on the subband depth allowed for marking.
Marking only the first subband has little effect on the image,
but increasing the embedding depth to the second subband
can already lead to visible artifacts even at low embedding
intensities on highly textured images like Barbara depending
on the embedding method.
The first subband has relatively low energy, the choice
of the most significant coefficients for marking thus moves
most of the watermark towards the coarser scales.
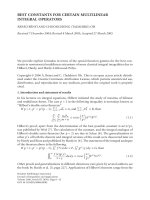
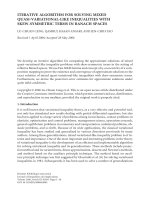
In fact, subband 1 accommodates less than half of the wa-
termark when subbands 1 and 2 are marked, and the ratio
gets smaller if more subbands are marked. This can be ex-
plained by Figure 2 which shows the histogram of the wavelet
coefficients in subbands 1, and 1 and 2 together. Though sim-
ilar in shape, the histogram for subband 1 alone (drawn with
a thicker line) is much narrower.
Since every coefficient in subband s corresponds to four
coefficients in the next finer scale s
− 1, this leads to larger re-
gions affected by changes through marking in coarser scales
and thus potentially more image degradation. Depending on
the length of the wavelet filter bank, the marking of the cho-
sen DWT coefficients will have an effect on a number of pix-
els in the reconstructed image. A good filter with respect to
2096 EURASIP Journal on Applied Signal Processing
Detail coefficients in subbands 1, 2
Detail coefficients in subband 1
−300 −200 −100 0 100 200 300
Coefficient values
0
5000
10000
15000
20000
25000
30000
35000
Occurrences
Figure 2: Coefficient values histogram of image Lena 512, decom-
posed using Villa 3; subbands 1-2.
image quality will “tolerate” this, so that visible artifacts in
the reconstructed image are minimized. This is essentially the
same with wavelet-based lossy compression. However, such
compression will most likely affect different, more uniformly
distributed coefficients and apply less significant changes. We
thus expect filters with good properties for lossy compression
to be potentially good choices for embedding where image
quality is impor tant. T his explains some of the results below.
3.1.1. Multiplicative embedding
When using multiplicative embedding, biorthogonal filters,
most of which are designed (like some of the Villa filters from
[11]) or commonly used for compression (like Antonini from
[12]) exhibit best performances. On the other hand, the or-
thogonal filters Haar, Daub4, Daub6,andDaub8 are on the
bottom of the rankings.
Some filters (e.g., Villa4, Villa6)performwellonlyat
low and others (Antonini, Villa5)athighsubbanddepth,but
there is also an excellent all-rounder (Villa3).
The subband depth of marking has no significant influ-
ence on ra nking distances between the filters. The spread
found between the best and the worst filter slightly decreases
from 1.4 (subband depth 1) to 1.3 (subband depth 2, 3) and
is more or less ev enly distributed.
3.1.2. DWT-SCS embedding
The DWT-SCS embedding leads to different rankings. First,
a group of three filters lead the ranking at subband depths of
2 and 3: Villa6, Villa4, and Villa3. Interestingly this group is
at the bottom at subband depth 1. The four orthogonal filters
form a close group in all degradation ranking, and perform
much better than when used with the multiplicative method.
They are on top at subband depth 1 and just after the top
group at depths 2 and 3.
At subband depth 1, the results need a closer look, since
the differences between the filters are very small. However
unlike the multiplicative method, at higher subband depth
we get a significant spread within each ranking table growing
with increased subband depth (approaching 2 at depth 3).
Interestingly increasing the subband depth does not lead
to increased image distortion with all filters. This stands in
contrast to the multiplicative embedding, but is quite logical
since the uniform quantization used in the DWT-SCS em-
bedding leads to higher relative changes to coefficients with
lower absolute values. As the proportion of coefficients with
high absolute values increases with subband depth, a higher
subband depth causes more subtle changes to the marked
coefficients’ values. But the one to four correspondence be-
tween coefficients in successive subbands means that changes
to coefficients in coarser subbands lead to potentially more
image degradation.
The results obtained using the DWT-SCS embedding
method show that the balance between these two factors de-
pends a lot on the filter used for embedding. Actually only
with Villa5, Odegard,andVilla2, which are also found at the
bottom of the rankings at higher subband depths, the image
degradation increases with the subband depth of marking.
These observations remain the same regardless of the inten-
sity setting s used.
3.1.3. Overall degradation results
With both embedding algorithms, the subband depths of
marking 2 and 3 lead to relatively consistent rankings dif-
fering slightly from the ones obtained at subband depth 1.
The results are different at a subband depth of 1, however the
filters’ results with the DWT-SCS embedding are so close to
each other that we may not want to overestimate this obser-
vation. Interestingly there are some filters with almost sim-
ilar performance at the subband depths 2 and 3 with both
embedding techniques—Villa3 and to a lesser extent Villa4
at the top, and Villa2 at the bottom. The popular orthogonal
filters (Haar, Daub 4, 6, and 8) seem recommendable only
for the DWT-SCS, and Antonini only for the multiplicative
embedding algorithm, respectively.
3.2. Watermark quality
Our results show that our two embedding techniques differ a
lot with respect to the watermarking software’s performance
but do not seem to influence the rankings. In this section, we
first discuss the differences found between the results from
using the two different embedding techniques. After that, we
look at the actual filter rankings in terms of the type of com-
pression attack.
3.2.1. Multiplicative embedding
Similar to the degr adation rankings (see Section 3.1)pro-
gression of the scores associated with the differently ranked
filters is relatively stable with the multiplicative embedding.
Regardless of the filter bank, a watermark inserted in the first
subband needs intensities of more than 30% to survive JPEG
compression with quality factors less than 95%. However,
marking only the first two subbands dramatically improves
the detection results. Even with low embedding intensity of
20% the mark is still clearly detectable at JPEG quality factors
of 85% or more. Marking the first three subbands or even
more makes the watermark virtually invulnerable to lossy
compression.
Filters Ranking for DWT-Domain Robust Digital Watermarking 2097
This can be explained by the multiplicative embedding
formula, y
i
= x
i
(1+αm
i
)—marking large coefficients leads to
high absolute changes. A compression attack using a uniform
quantizer will thus need a hig h quantization step to destroy
the watermark which is impractical because of the resulting
poor image qualit y. Even nonuniform quantizers would have
to operate in the same DWT domain as the one chosen for
embedding the mark to attack a mark embedded in the most
significant coefficients more efficiently. Since, as mentioned
in Section 3.1, the coarser subbands 2 and 3 usually contain
higher proportion of significant coefficients, allowing more
subbands for marking results in a dramatic increase of the
robustness of the watermark at the cost of image quality.
3.2.2. DWT-SCS embedding
The blind DWT-SCS embedding produced overall good re-
sults which were not worse than the nonblind multiplicative
one’s. At subband depth 1 both methods exhibit the same
performance at a given image degradation. In contrast to the
observation made with the multiplicative embedding tech-
nique, an increased subband depth of marking does not au-
tomatically lead to a more robust watermark. However as the
level of degradation caused by marking goes down at higher
subband depths (Section 3.1.2), higher values of ∆ can be se-
lected for the watermark intensity which more than compen-
sates the missing gain of robustness; actually the product be-
tween image and watermark degradation at subband depths
2 and 3 is usually lower than the corresponding one we get
with the multiplicative method.
To find possible reasons for this behaviour, we can use
almost the same considerations as for the image degrada-
tion (see Section 3.1.2). The DWT-SCS’s uniform quantiza-
tion leads to relatively large changes to coefficients with low
and little changes to those with large values. Whether or not
an increased subband depth leads to improved robustness,
depends most of all on the kind of attack: the more similar
the attack’s kind of quantization is to the one used for em-
bedding, the less an increased subband depth of marking (at
the same intensity level) will lead to improved robustness.
In our experiments, we found hardly any difference with the
DWT-based and only slight robustness improvements with
the JPEG compression attack. Since the selection of coeffi-
cients and the uniform quantization used by the DWT-based
compression is more similar to o ur embedding in the DWT-
domain than the (DCT-based) JPEG compression, this result
supports our above statement.
Similar to the results from the degradation rankings, the
progression within the rankings is rather high at higher sub-
bands while there is hardly any difference between the filters
if only the first subband is marked.
3.2.3. JPEG compression rankings
The group of orthogonal filters show the best robustness
against JPEG compression. In the image quality rankings, the
same group is ranked in the midfield with some distance to
the top group when using DWT-SCS, and even at the bot-
tom when u sing the multiplicative embedding, so obviously
these filters are the best choices for watermarking optimized
on robustness. Interestingly, we find one of the biorthogonal
filters, Villa3, consistently ranked in the top group. This re-
sult is remarkable because this filter bank had already shown
very good properties with respect to image quality. In our
experiments no other filter had a comparable all round capa-
bility. In the bottom group of the tables we consistently find
Villa4 that had been in the top group of all image degrada-
tion rankings. The rest of the filter banks in the lower half of
the tables differ depending on the subbands depth of mark-
ing.
3.2.4. DWT-based compression rankings
We tested the filters against DWT-based compression at only
four different quality factors to find out how a different kind
of compression affects the results. For the attack we used
Davis’ simple transform coder [10] which uses quantization
and entropy coding in the DWT domain and the Antonini fil-
ter for decomposition. The rankings are quite different here.
The orthogonal filters were not in the top group any-
more, while the biorthogonal ones with long sets of coef-
ficients provided the best robustness. Interestingly, the best
detection results were achieved with filters of nearly the same
length of the Antonini filter used for the compression attack.
Additional tests (see [2] for more details) revealed that the
rankings of the filters used for embedding are significantly—
but not in an obvious way—influenced by the choice of filter
for the compression attack. Similar observations were made
when repeating these experiments using DWT-SCS embed-
ding. This effect was in a way suggested by [4] in which sim-
ilar transform domains for marking and compression were
found to be beneficial for detection. Further investigation
of this correspondence, and the design of a filter bank with
good robustness against any kind of DWT-based compres-
sion could be the starting point for interesting followup re-
search. In general, long filters give the best results, but the ac-
tual rankings change with the choice of filter for compression
and with other parameters, so that no simple recommenda-
tioncanbemadehere.
3.2.5. Overall detection results
Regardless of the embedding method, both ranking s depend
most of all on the subband depth of marking and the kind
of compression attack used after marking. Unfortunately two
kinds of compression attacks suggest using different filters, so
a filter will either optimize the scheme against one attack or
be a compromise. Such a compromise could be Daub8 with
its very good robustness against JPEG and, since it is a long
filter bank, reasonably good robustness against DWT com-
pression.
3.3. Overall results
In most situations, the DWT-SCS has overall properties su-
perior to the multiplicative method.
Marking an image with the two methods to approxi-
mately similar level of image degradation, the multiplicative
method was only found to have better overall results than the
2098 EURASIP Journal on Applied Signal Processing
SCS at subband depth 1 and a low compression quality fac-
tor used for the attack. In all other cases, especially at higher
subband depths, the DWT-SCS clearly outperforms the mul-
tiplicative technique.
3.4. Possible optimizations
Imperceptibility and robustness usually have conflicting re-
quirements. To achieve the best possible robustness at a given
level of image degradation, additional fine tuning is neces-
sary. Since the two adopted embedding methods differ signif-
icantly in this respect we need to look at possible optimized
settings separately.
3.4.1. Tu ning multiplicative embedding
Good robustness is only achieved when marking more than
only the first subband, but this easily results in visible ar-
tifacts in the marked image. Because of the large abso-
lute changes to large coefficients (Section 3.2.1), robustness
quickly goes into saturation at high subband depths. We can
thus scale down the intensity in higher subbands (as pro-
posed in [13]) for a better tradeoff between image quality
and watermark robustness.
3.4.2. Tu ning DWT-SCS embedding
The quantization-based embedding does not provide a sim-
ilar simple dependency between its intensity settings and
performance. In fact, adapting the ∆ values to the marked
subband introduces a somewhat random effect on the re-
sults. While upscaling leads to proportionally increased im-
age degradation, the detection results do not exhibit a similar
kind of behaviour. There is an obvious interaction between
the quantization performed by the embedding process and
the one resulting from the attacking compression ratio.
The optimal settings thus depend on the weight put on
image quality and robustness. Since only the image quality is
usually under one’s control, the optimization process starts
with selecting an upper bound on al lowed image degrada-
tion. Settings (intensity, choice of filter) leading to not more
than the upper bound can be experimentally determined,
and the selected combination should provide the best pos-
sible robustness against a given attack. However this opti-
mization does not seem as vital as with the multiplicative
embedding, because DWT-SCS usually provides reasonable
performance at nonadaptive settings.
4. CONCLUSIONS, FUTURE WORK
We investigated par ameters that influence the best choice
of filter banks with the aim of finding a good compromise
between the competing requirements of imperceptivity and
robustness. We have established that for both requirements
a filter’s performance depends most of all on the subband
depth used for marking. While finding good filters for opti-
mal image quality is easy, the detection results are influenced
by the kind of attack which is beyond our control in real-life
watermarking.
To achieve good robustness against JPEG compression
allowing little image degradation, the Villa3 filter bank is
more than a compromise if the first two or three subbands
are chosen for embedding. However, the DWT-based com-
pression attack leading to different results suggests that the
kind of (compression) attack has an impact on the optimal
choice of filter bank, too. Because the way an attack is con-
ducted is beyond one’s control in real life, no one filter can
be recommended as an optimal choice here, but in general,
long filters showed good results. While Villa3 has good over-
all properties regardless of the two embedding techniques
we tested, Antonini is a relatively good choice if the multi-
plicative one is used, and Daub8 if the DWT-SCS embed-
ding is used. From the two different embedding techniques
we used in our experiments, the blind DWT-SCS clearly out-
performed the nonblind multiplicative embedding.
For robustness to the two tested attacks, marking more
than the first subband is desirable, but it easily leads to
artifacts. Depending on the embedding algorithm adaptive
marking with changing intensity settings depending on the
marked coefficients’ subbands can help in achieving better
overall results.
This work is part of an ongoing project on wavelet-based
second generation watermarking (see [14]). Such schemes
try to increase robustness against geometric distortion at-
tacks (e.g., StirMark [1]). The need for such advanced tech-
niques gets obvious once we take more sophisticated attacks
than lossy compression into consideration. For example, wa-
termark embedded using a Villa3 filter and DWT-SCS em-
bedding with ∆ = 40.0andα = 1.0atsubbanddepth2,
easily survives JPEG compression of a quality factor of 65%
and DWT compression at a compression ratio of 1 : 14, but
was rendered completely unreadable after a StirMark [1]al-
lowing only geometric attacks at standard settings.
Our next step will be to extend our marking system for
selecting and locating marked coefficients according to fea-
tures in the DWT-transformed image.
APPENDICES
A. THE RANKINGS
Here, we introduce the full rankings averaged overall tested
images. In Tables 2, 3, 4, 5, 6,and7, the abbreviations
used are Ha (Haar), D4 (Daub4), D6 (Daub6), D8 (Daub8),
An (Antonini), Od (Odegard), V2 (Villa2), V3 (Villa3), V4
(Villa4), V5 (Villa5), and V6 (Villa6).
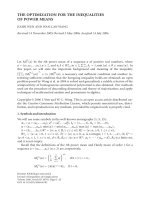
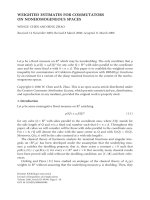
B. DEGRADATION/DETECTION EXAMPLES
In Figure 3, the corresponding MSEs resulting from mar king
are 15.92560 (M70)and2.09668 (S40). In contrast to M70,
S40 causes hardly any perceptible image degradation.
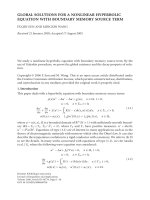
The detection results in Figure 4 were scored in L
q
d
as
3.56445 (M70)and6.10352 (S40). Both detection results are
thus well below the experimentally determined readability
thresholds (see Section 2.4 for the actual thresholds).
All in all S40 exhibits superior overall performance.
Filters Ranking for DWT-Domain Robust Digital Watermarking 2099
Table 2: Detection ranking s (multiplicative embedding) after JPEG
compression (L
q
d
) (Sections 3.2.1, 3.2.3).
1 subband 2 subbands 3 subbands
Ha 16.453 D8 10.259 V3 8.715
D4 17.704 V3 10.533 D4 9.057
D6 17.725 D6 10.678 D6 9.059
D8 17.894 Ha 10.807 D8 9.133
V5 18.562 D4 11.016 Ha 9.260
V2 19.169 Od 11.529 V6 9.337
Od 19.703 V6 11.660 An 9.415
An 19.727 V5 11.969 V5 9.788
V3 19.778 An 12.268 V2 9.911
V6 20.621 V2 12.327 V4 9.933
V4 20.895 V4 12.467 Od 10.098
Table 3: Detection rankings (multiplicative embedding) after DWT
compression (L
q
d
) (Sections 3.2.1, 3.2.4).
1 subband 2 subbands 3 subbands
An 19.269 Od 11.645 V2 10.053
Od 19.698 An 12.012 An 10.170
V2 19.750 V6 12.263 V6 10.288
V4 21.041 V2 12.385 Od 10.340
V6 21.275 V4 12.666 V4 11.733
Ha 24.483 D8 20.992 D8 15.469
V5 26.803 Ha 21.019 Ha 17.135
V3 27.648 V5 22.862 D6 18.107
D8 27.934 V3 24.663 V5 18.728
D4 29.471 D6 25.014 V3 19.364
D6 30.346 D4 25.223 D4 19.733
Table 4: Detection rankings (DWT-SCS embedding) after JPEG
compression (L
q
d
) (Sections 3.2.2, 3.2.3).
1 subband 2 subbands 3 subbands
Ha 6.035 D8 3.018 D8 1.796
D6 6.114 D4 3.115 D4 1.933
V3 6.160 D6 3.146 D6 1.935
D8 6.232 V3 3.167 V3 2.123
D4 6.324 Ha 3.430 Ha 2.267
V5 6.471 Od 3.512 V5 2.397
V2 6.847 V2 3.605 Od 2.408
V6 6.891 V5 3.669 V2 2.440
An 6.939 An 3.833 An 2.545
Od 6.949 V6 4.403 V6 2.883
V4 7.005 V4 5.183 V4 3.827
C. SUMMARY ON THE TOOLS
AND TEST PARAMETERS
Our watermarking software was implemented on base of our
C++ Wavelet and Image class library which among others
also includes a CLI program pgmcompare which we used to
determine the MSE and L
q
d
scores for our experiments. The
class library is Free Software and can be downloaded from
Table 5: Detection rankings (DWT-SCS embedding) after DWT
compression (L
q
d
) (Sections 3.2.2, 3.2.4).
1 subband 2 subbands 3 subbands
V4 7.298 Od 4.658 Od 4.002
V6 7.424 An 4.847 V2 4.032
An 7.450 V2 4.873 An 4.076
Od 7.905 V6 7.180 V6 7.184
V2 7.915 V4 7.557 D8 7.996
V5 9.067 Ha 10.560 V4 8.271
V3 9.221 D8 10.862 V5 10.003
Ha 9.612 V5 10.880 Ha 10.007
D8 10.695 D4 13.588 D6 10.496
D6 12.268 D6 14.030 D4 11.792
D4 12.455 V3 14.094 V3 14.516
Table 6: Degradation rankings multiplicative embedding (MSE)
(Section 3.1.1).
1 subband 2 subbands 3 subbands
V4 5.326 V4 12.919 V3 26.494
V6 5.464 V3 13.118 An 27.358
V3 5.534 An 13.313 V5 27.468
An 5.573 V6 13.340 V4 27.543
Od 5.715 V5 13.724 Od 27.937
V2 5.867 Od 13.739 V6 27.976
V5 6.039 V2 14.020 V2 28.508
D4 6.381 D8 14.913 D8 30.077
D6 6.501 D4 15.157 D4 30.880
D8 6.549 D6 15.413 D6 31.467
Ha 7.427 Ha 16.919 Ha 33.997
Table 7: Degradation rankings DWT-SCS embedding (MSE)
(Section 3.1.2).
1 subband 2 subbands 3 subbands
D4 13.939 V6 10.152 V6 8.495
Ha 13.947 V4 10.573 V4 8.919
V2 14.071 V3 11.096 V3 9.341
D6 14.084 Ha 14.019 Ha 13.809
Od 14.144 D4 14.047 D4 13.842
D8 14.157 D8 14.058 D6 13.881
An 14.496 D6 14.082 D8 13.883
V5 14.564 An 14.148 An 14.551
V3 14.883 V5 15.044 V5 15.442
V6 15.307 Od 15.526 Od 17.068
V4 15.445 V2 16.243 V2 18.145
/>html#software.
We used the CLI tools cjpeg/djpeg (JPEG distribution,
and encode/decode (Davis’ wavelet
kit [10]) to perform the two kinds of lossy compression.
For the JPEG attack, cjpeg was called in the following
way: “cjpeg-quality quality -outfile tmp.jpg image” with the
quality factors 100, 95, 90, 85, 80, 70, and 60. For the DWT
2100 EURASIP Journal on Applied Signal Processing
(a) (b) (c)
Figure 3: (a) Original, (b) Daub4 multiplicative at 70% (M70), and (c) Daub4 DWT-SCS at ∆ = 40 and α = 1.0 (S40).
(a) (b)
Figure 4: After JPEG (70%): (a) M70 and (b) S40.
attack, encode was called in the following way: “encode image
tmp.raw ratio” with the ratio settings 8, 10, 12, 14, and 16
(for 1 : 8, 1 : 10, ).
Throughout our experiments we used PGM images that
were converted to other formats where necessary.
Our Unix shell scripts for automating the experiments
are available upon request.
REFERENCES
[1] F. A. Petitcolas, R. J. Anderson, and M. G. Kuhn, “Attacks on
copyright marking systems,” in Proc. 2nd International Work-
shop on Information Hiding (IH ’98), pp. 218–238, Portland,
Ore, USA, April 1998, Introduces the StirMark benchmark
software.
[2] M. Dietze and S. Jassim, “The choice of filter banks for
wavelet-based robust digital watermarking,” in Proc. Multi-
media and Security Workshop at ACM Multimedia, pp. 37–41,
French Riviera, France, December 2002.
[3] C. Fei, D. Kundur, and R. Kwong, “The choice of watermark
domain in the presence of compression,” in Proc. IEEE In-
ternat ional Conference on Informat ion Technology: Coding and
Computing (ITCC ’01), pp. 79–84, Las Vegas, Nev, USA, April
2001.
[4] R. Wolfgang, C. Podilchuk, and E. Delp, “The effect of match-
ing watermark and compression transforms in compressed
color images,” in Proc. IEEE International Conference on Image
Processing (ICIP ’98), vol. 1, pp. 440–444, Chicago, Ill, USA,
October 1998.
[5] P. Meerwald, “Digital image watermarking in the wavelet
transform domain,” M.S. thesis, Department of Scientific
Computing, University of Salzburg, Salzburg, Austria, 2001.
[6] W. Zeng, B. Liu, and S. Lei, “Extraction of multiresolution
watermark images for resolving rightful ownership,” in Secu-
rity and Wate rmarking of Multimedia Contents, vol. 3657, pp.
404–414, San Jose, Calif, USA, January 1999.
[7] I. J. Cox, J. Kilian, T. Leig hton, and T. Shamoon, “Se-
cure spread spectrum watermarking for multimedia,” IEEE
Trans. Image Processing, vol. 6, no. 12, pp. 1673–1687, 1997.
[8] J. J. Eggers, J. k. Su, and B. Girod, “A blind watermarking
scheme based on structured codebooks,” in IEE Colloquium:
Secure Images and Image Authentication, pp. 4/1–4/21, Lon-
don, UK, April 2000.
[9] C. E. Jacobs, A. Finkelstein, and D. H. Salesin, “Fast mul-
tiresolution image querying,” Computer Graphics, vol. 29, pp.
277–286, November 1995.
[10] G. Davis, “Wavelet Image Compression Construction Kit,”
January 1997, ffdavis.net/dartmouth/wavelet/
wavelet.html.
[11] J. D. Villasenor, B. Belzer, and J. Liao, “Wavelet filter evalu-
ation for image compression,” IEEE Trans. Image Processing,
vol. 4, no. 8, pp. 1053–1060, 1995.
[12] M. Antonini, M. Barlaud, P. Mathieu, and I. Daubechies, “Im-
age coding using wavelet transform,” IEEE Trans. Image Pro-
cessing, vol. 1, no. 2, pp. 205–220, 1992.
[13] J. R. Kim and Y. S. Moon, “A robust wavelet-based digital wa-
termarking using level-adaptive thresholding,” in Proc. IEEE
International Conference on Image Processing (ICIP ’99), vol. 2,
pp. 226–230, Kobe, Japan, October 1999.
[14] M. Kutter, S. Bhattacharjee, and T. Ebrahimi, “Towards sec-
ond generation watermarking schemes,” in Proc. 6th IEEE In-
ternational Conference on Image Processing (ICIP ’99), vol. 1,
pp. 320–323, Kobe, Japan, October 1999.
Martin Dietze is a graduate of t he Uni-
versity of Applied Sciences, Wedel, Ger-
many, with the degree “Diplomingenieur
der Technischen Informatik” (Engineer of
Technical Computer Science) in 1997.
While still a student, he worked for IBM and
some smaller software companies. After re-
ceiving his degree he stayed at the Univer-
sity of Applied Sciences, Wedel, to work as
a System Administrator Teaching Assistant
in software development, where he started working on his D.Phil.
on second generation watermarking in the wavelet domain as a
part-time project at the University of Buckingham in 1999. He then
joined the University of Buckingham in 2001 to work as a Lecturer
and to continue working on his D.Phil. Since 2003 Martin has been
back in Germany, now working as a Research Associate in a project
on repairing and texturizing polygon models for VR applications.
He expects to finish his D.Phil. before the end of 2004.
Filters Ranking for DWT-Domain Robust Digital Watermarking 2101
Sabah Jassim is a mathematics graduate of
Baghdad University and holds a D.Phil. de-
gree in algebraic topology which he received
from the University of Wales-Swansea in
1980. Currently he is a Senior Lecturer in
mathematics at the University of Bucking-
ham, UK. He also holds visiting lecturing
posts at City University, London, UK, and at
the University of Applied Sciences, Wedel,
Germany. Before joining the University of
Buckingham, he lectured at the University College of Swansea, and
Leicester Polytechnic, UK. His research interests and publications
cover a wide range of mathematical applications in computing
(e.g., information security, wavelet-based compression techniques
for on-line transmission of medical video images, algebraically
designed data structures for the computation of Delaunay trian-
gulations and other geometric objects, and deadlock analysis of
large-scale process networks). He is currently sponsored to research
wavelet-based biometrics for face recognition.