Báo cáo hóa học: " Bit Error Rate Analysis for MC-CDMA Systems in Nakagami-m Fading Channels" potx
Bạn đang xem bản rút gọn của tài liệu. Xem và tải ngay bản đầy đủ của tài liệu tại đây (706.81 KB, 10 trang )
EURASIP Journal on Applied Signal Processing 2004:10, 1585–1594
c
2004 Hindawi Publishing Corporation
Bit Error Rate Analysis for MC-CDMA Systems
in Nakagami-m Fading Channels
Zexian Li
Centre for Wireless Communications (CWC), University of Oulu, 90014 Oulu, Finland
Email: fi
Matti Latva-aho
Centre for Wireless Communications (CWC), University of Oulu, 90014 Oulu, Finland
Email: fi
Received 24 February 2003; Revised 22 September 2003
Multicarrier code division multiple access (MC-CDMA) is a promising technique that combines orthogonal frequency division
multiplexing (OFDM) with CDMA. In this paper, based on an alternative expression for the Q-function, characteristic function
and Gaussian approximation, we present a new practical technique for determining the bit error rate (BER) of multiuser MC-
CDMA systems in frequency-selective Nakagami-m fading channels. The results are applicable to systems employing coherent
demodulation w i th maximal ratio combining (MRC) or equal gain combining (EGC). The analysis assumes that different subcar-
riers experience independent fading channels, which are not necessarily identically distributed. The final average BER is expressed
in the for m of a single finite range integral and an integrand composed of tabulated functions which can be easily computed
numerically. The accuracy of the proposed approach is demonstrated with computer simulations.
Keywords and phrases: multicarr ier CDMA, bit error rate, Nakagami fading channel, spread-spectrum communications.
1. INTRODUCTION
Multicarrier code division multiple access (MC-CDMA),
which efficientlycombinesCDMAwithorthogonalfre-
quency division multiplexing (OFDM), has gained consid-
erable attention as a promising multiple access technique for
future mobile communications [1, 2, 3, 4, 5, 6, 7, 8]. MC-
CDMA is a spread spectrum technique where the signal is
spread in the frequency domain. Since the MC-CDMA tech-
nique possesses the advantages of both OFDM and CDMA, it
has the properties desirable for future systems such as insen-
sitivity to frequency-selective fading channels, frequency di-
versity, and the capability of supporting multirate service by
applying either multicode or variable spreading factor tech-
niques [1].
Many papers have been dedicated to the bit error rate
(BER) analysis of MC-CDMA [3, 4, 5, 6, 7]. The perfor-
mance of MC-CDMA has been studied both for the uplink
and the downlink of a mobile communication system [3]
in which perfect time synchronization among users was as-
sumed. To get the BER, three approximation methods for
the distribution of the sum of independently identically dis-
tributed (i.i.d.) Rayleigh random variables (r.v.’s) were em-
ployed in the paper: the law of large numbers (LLN) approx-
imation, the small parameter approximation and the centra l
limit theorem (CLT) approximation. The authors of [5]an-
alyzed the BER performance of MC-CDMA systems with a
frequency offset. The CLT approximation was used in the
analysis. A performance analysis using the LLN approxima-
tion of an MC-CDMA system employing an antenna array
at the base station has been presented in [6]. The bit error
probability in multipath channels was analyzed in [7]based
on the CLT approximation.
It is well known that approximation methods are not al-
ways accurate in practice, thus we have to choose the ap-
proximation method according to the system parameters
and/or operating environment. For a maximal ratio com-
bining (MRC) receiver operating in a Rayleigh fading chan-
nel, the distribution of the sum of exponentially distributed
r.v.’s is known to have a gamma distribution from which the
exact expression for the average probability of error can be
obtained. However, for an equal gain combining (EGC) re-
ceiver, finding the distribution of the sum of the independent
Rayleigh r.v.’s is more problematic. In [9], Beaulieu offered
an infinite ser ies representation of this sum. With the help
of characteristic functions of the decision variables, the au-
thors of [10] studied the performance of MC-CDMA with
an EGC receiver and Rayleigh fading channels. Nakagami
fading channels have received considerable attention in the
study of various aspects of wireless systems [11, 12]. The
1586 EURASIP Journal on Applied Signal Processing
User
data
Spreading
code
S/P
cos(w
0
t)
.
.
.
cos(w
N−1
t)
GI
Channel
(a)
Received
data
Remove
GI
S/P
cos(w
0
t)
.
.
.
cos(w
N−1
t)
Frequency
domain
equalizer
.
.
.
P/S
Spreading
code
User
Data
(b)
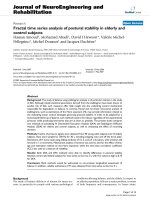
Figure 1: Block diagram for the MC-CDMA (a) transmitter and
(b) receiver (GI: guard interval).
Nakagami distribution provides a more general and versa-
tile way to model wireless channels [13]. The authors inves-
tigated the BER p erformance of MC-CDMA with an EGC
receiver and Nakagami-m fading channels [8] with the same
fading parameter m on different subcarriers. Although usu-
ally the correlation of fading channels amongst subcarriers
cannot be ignored, it can be reduced with a properly designed
frequency interleaver. Furthermore, the BER performance of
MC-CDMA with independent fading channels can provide
a helpful benchmark for system design. Motivated by this,
the objective of this paper is to present an alternative Gaus-
sian approximation (AGA) approach for deriving the expres-
sion for the BER of MC-CDMA with both MRC and EGC
in Nakagami-m fading channels where independent fading
channels between different subcarriers are assumed. By us-
ing an alternative expression for the Gaussian Q(·)function
and the characteristic function of Nakagami-m variables, the
average BER of an MC-CDMA system can be found.
The rest of this paper is organized as follows. Section 2
gives a description of the MC-CDMA system model. The
performance analysis for both MRC and EGC is carried
out in Section 3. Section 4 provides a comparison between
computer simulation results and analytical results. Finally,
Section 5 draws the conclusions.
2. SYSTEM MODEL
In this section, the model of an MC-CDMA system is de-
scribed. We assume that there are K simultaneous users, each
having N subcarriers. The block diagrams of the considered
MC-CDMA transmitter and receiver with one tap frequency
domain equalizers in the uplink are depicted in Figure 1.
2.1. Transmitter
Transmitted signal S
k
(t) corresponding to the block of M
data bits of the kth user is
S
k
(t) =
2P
N
M−1
m=0
N−1
n=0
c
k
[n]b
k
[m]cos
ω
n
t
p
T
b
t − mT
b
,
(1)
where P is the power of a data bit, M is the packet size,
{c
k
[n]} represents the signature sequence of the kth user,
p
T
b
(t) is the rectangular pulse defined over the bit duration
[0, T
b
], and b
k
[m] represents the mth input data bit from
user k which are independent equiprobable r.v.’s (∈±1) with
E[b
k
(m)] = 0andE[|b
k
(m)|
2
] = 1. ω
n
is the angular fre-
quency of the nth subcarrier.
2.2. Channel model
Independent, frequency-selective Nakagami-m fading chan-
nels for each user are considered. With the proper selec-
tion of the number of subcarriers for a user, it is reason-
able to assume that each subcarrier undergoes indepen-
dent frequency-nonselective Nakagami fading. Therefore,
the equivalent time-variant complex fading channel for the
kth user, nth subcarrier can be represented as
H
k,n
(t; τ) = β
k,n
(t)e
jθ
k,n
(t)
δ
τ −τ
k
,(2)
where τ
k
is the propagation delay for the kth user and δ(·)is
the Dirac delta function. The amplitudes {β
k,n
(t)} are inde-
pendent Nakagami-m r.v.’s and the phase offsets {θ
k,n
(t)} are
identical r.v.’s uniformly distributed over [0, 2π). The fading
amplitude β
k,n
is characterized by a Nakagami-m distribu-
tion [13]
p
β
k,n
, Ω
k,n
=
2m
m
k,n
k,n
Ω
m
k,n
k,n
β
2m
k,n
−1
k,n
Γ
m
k,n
exp
−
m
k,n
β
2
k,n
Ω
k,n
(3)
with the parameters m
k,n
= Ω
2
k,n
/E[(β
2
k,n
− Ω
2
k,n
)
2
] ≥ 0.5and
Ω
k,n
= E[β
2
k,n
], E[·] denotes the expectation operator and
Γ(·) is the Gamma function. The Nakagami assumption on
the amplitude implies that γ
k,n
= β
2
k,n
(E
b
/N
0
)(E
b
= PT
b
:
the energy per bit) follows the well-known gamma distribu-
tion
p
γ
k,n
=
m
m
k,n
k,n
¯
γ
m
k,n
k,n
γ
m
k,n
−1
k,n
Γ
m
k,n
exp
−
m
k,n
γ
k,n
¯
γ
k,n
,(4)
where
¯
γ
k,n
= (E
b
/N
0
)Ω
k,n
is the average signal-to-noise ratio
(SNR) per symbol. For the downlink, H
k,n
is the same for
different k at a certain reception point {k = 0, 1, , K − 1}.
2.3. Receiver
The received signal r(t)canbewrittenas
r(t)
=
2P
N
K−1
k=0
M−1
m=0
N−1
n=0
β
k,n
(t)c
k
[n]b
k
[m]
×cos
ω
n
t + θ
k,n
(t)
p
T
b
t − mT
b
− τ
k
+ n(t),
(5)
BER Analysis for MC-CDMA in Nakagami-m Fading Channels 1587
where n(t) is the additive white Gaussian noise (AWGN) with
a double-sided power spectral density of N
0
/2.
The insertion of an equalizer in the frequency domain or
time domain is necessary to upgrade the performance of the
system by multiplying each subcarrier by the factor G
k,n
(m)
in the mth bit interval [14]. Without the loss of generality, we
consider the signal from the first user as the desired signal.
With coherent demodulation, the decision variable v
0
of the
mth data bit of the first user is given by
v
0
=
1
T
b
(m+1)T
b
mT
b
r(t)
N−1
n=0
c
0
[n]G
0,n
(m)cos
ω
n
t + θ
k,n
(t)
dt,
(6)
where it has been assumed that one data bit occupies all
subcarriers
1
and the receiver is synchronized with the de-
sired user (k = 0). The channel fading and phase shift
variables are assumed to be constant over the time interval
[mT
b
,(m +1)T
b
]andaredenotedbyβ
k,n
(m)andθ
k,n
(m).
In this paper, we have paid attention to the two
commonly and effectively used combining methods: MRC
(G
0,n
(m) = β
0,n
(m)) and EGC (G
0,n
(m) = 1) [14, 15]. For
brevity, the time index m is omitted in the following.
3. PERFORMANCE ANALYSIS
An alternative representation of the Q-function was pre-
sented in [16] and leads to a convenient method for perfor-
mance analysis. By applying the Q-function
Q(x) =
1
π
π/2
0
exp
−
x
2
2sin
2
θ
dθ, x ≥ 0(7)
and the characteristic function of Nakagami-m fading r.v.’s,
the bit error probability of an MC-CDMA system can be
evaluated.
In order to be more general, the uplink direction is con-
sidered. For simplicity, it is assumed that different subcar-
riers experience an i.i.d. fading channel, although identical
fading channels are not necessary for the analysis. Assuming
that the users are time synchronous, after demodulation and
combining subcarrier signals, the decision variable in (6)can
be written as
v
0
= S + I + η,(8)
where S represents the desired signal term, I is the multi-
ple access interference (MAI) from other users, and η is the
AWG N ter m.
3.1. Performance of MRC
With G
0,n
= β
0,n
and from (6), (8), we get the desired signal
of (8)as
S =
P
2N
N−1
n=0
b
0
β
2
0,n
,(9)
1
Higher data rates can be obtained by using a small spreading factor (SF),
that is, subcarriers are used by different data bits. For SF = 1, the system
becomes OFDM.
η is a Gaussian random variable with zero mean and variance
σ
2
η
= (N
0
/4T
b
)
N−1
n=0
β
2
0,n
. The MAI term I can be expressed
as follows:
I =
P
2N
K−1
k=1
N−1
n=0
b
k
c
k
[n]c
0
[n]β
k,n
β
0,n
cos
˜
θ
k,n
, (10)
where
˜
θ
k,n
= θ
0,n
− θ
k,n
. θ
0,n
and θ
k,n
are i.i.d. r.v.’s, uni-
formly distributed over [0, 2π). According to [17], the prob-
ability density function of
˜
θ
k,n
can be easily obtained and
E[cos
˜
θ
k,n
] = 0. Since β
k,n
and θ
k,n
(k = 1, 2, , K − 1; n =
0, 1, , N−1) are i.i.d. r.v.’s, all (K −1)×N terms in the sum-
mation of (10) are uncorrelated with zero means. Assuming
that there is no near-far problem, MAI can be approximated
by a conditional Gaussian random variable with zero mean
and variance
σ
2
I
= E
I
2
=
P
2N
(K
− 1)E
β
2
k,n
E
cos
2
˜
θ
k,n
N−1
n=0
β
2
0,n
, (11)
where E[cos
2
˜
θ
k,n
] = 1/2.
We see that v
0
is a conditional Gaussian variable condi-
tioned on {β
0,n
}. Since η and I are mutually independent, the
probability of error using BPSK modulation conditioned on
{β
0,n
} is simply given by [18]
Pr
error |β
0,n
= Q
S
2
σ
2
η
+ σ
2
I
. (12)
To compute the average BER, we must statistically
average ( 12) over the joint probability density function
p
β
(β
0,0
, , β
0,N−1
) of the fading amplitudes. Using the al-
ternative Q-function (7) and the assumption of independent
fading channels at different subcarriers, the average BER can
be expressed as
P
e
=
∞
0
···
∞
0
1
π
π/2
0
exp
−
S
2
/
σ
2
η
+ σ
2
I
2sin
2
φ
× p
β
0,0
β
0,0
, , p
β
0,N−1
×
β
0,N−1
dβ
0,0
···dβ
0,N−1
dφ
=
1
π
π/2
0
N−1
n=0
I
0,n
SINR
0,n
, φ
dφ,
(13)
where SINR
0,n
is the average signal to interference plus noise
ratio (SINR) for the nth subcarrier of the first user and the
following equation has been used:
S
2
σ
2
η
+ σ
2
I
=
1
N/2+
E
b
/N
0
(K − 1)/2
N−1
n=0
γ
0,n
. (14)
1588 EURASIP Journal on Applied Signal Processing
By using ( 4)and
∞
0
x
v
exp(−ax)dx = Γ(v +1)/a
v+1
(a>
0, v>−1) [19], I
0,n
can be expressed as
I
0,n
=
∞
0
exp
−
γ
0,n
2sin
2
φ
N/2+
E
b
/N
0
(K − 1)/2
× p
γ
0,n
dγ
0,n
=
1+
SINR
0,n
m
0,n
sin
2
φ
−m
0,n
.
(15)
The average SINR
0,n
for the nth subcarrier of the first user
can be obtained as
SINR
0,n
=
(P/N)E
β
2
0,n
N
0
+
K−1
k=1
(P/N)E
β
2
k,n
. (16)
If all N subcarriers are identically distributed with the
same average SINR per bit, then (13) simplifies further to
P
e
=
1
π
π/2
0
I
0,n
SINR
0,n
, φ
N
dφ. (17)
Since a multiuser system is considered in this paper, the
average BER of the system is given by
BER =
1
K
K−1
k=0
P
e
(k). (18)
Using (13)–(18), we can obtain the average BER of the MC-
CDMA system with MRC by using the simple form of a single
integral with finite limits and an integrand composed of an
elementary function.
3.2. Performance of EGC
The EGC equalizer is of importance because the enhance-
ment of MAI due to MRC can be alleviated by EGC. The de-
cision of the mth data bit of the first user is used during the
analysis. Similar to MRC, the conditional BER of the system
with EGC can be obtained as
Pr
error|β
0,n
= Q
S
2
σ
2
η
+ σ
2
I
, (19)
where the expressions for S, η,andI are different from those
of the MRC receiver and can be derived from (6)and(8).
The desired signal with perfect channel estimation can be
expressed as
S =
P
2N
N−1
n=0
b
0
β
0,n
, (20)
η is a Gaussian random variable with zero mean and variance
σ
2
η
= NN
0
/4T
b
. The MAI term I can be written in the form
of
I =
P
2N
K−1
k=1
N−1
n=0
b
k
c
k
[n]c
0
[n]β
k,n
cos
˜
θ
k,n
, (21)
where
˜
θ
k,n
has the same meaning as in (10). The term I can
be approximated by a Gaussian random variable with zero
mean and variance
σ
2
I
= E
I
2
=
P
2
(K − 1)E
β
2
k,n
E
cos
2
˜
θ
k,n
. (22)
Using the alternative representation of the Q-function
(7), the average BER can be expressed as
P
e
=
∞
0
···
∞
0
1
π
π/2
0
exp
−
(P/2N)/
σ
2
η
+σ
2
I
2sin
2
φ
N−1
n=0
β
0,n
2
× p
β
0,0
β
0,0
, , p
β
0,N−1
β
0,N−1
× dφ dβ
0,0
···dβ
0,N−1
.
(23)
We extended the technique of [20] to an MC-CDMA sys-
tem with multiple users. By changing variables, (23)becomes
P
e
=
∞
0
1
π
π/2
0
exp
−
A
2
2sin
2
φ
λ
2
p
λ
(λ)dλdφ, (24)
where
A =
P
2N
σ
2
η
+ σ
2
I
λ =
N−1
n=0
β
0,n
(25)
and λ denotes the sum of the fading amplitudes after com-
bining.
Next, according to the definition of the characteristic
function, the term p
λ
(λ) could be obtained by employing the
characteristic function of the Nakagami-m fading channel
p
λ
(λ) =
1
2π
∞
−∞
ψ
λ
(jv)e
−jvλ
dv. (26)
Since the fading experienced by different subcarriers is as-
sumed to be mutually independent, the characteristic func-
tion of λ simply equals the product of the characteristic func-
tion of individual components, leading to
ψ
λ
(jv) =
N−1
n=0
ψ
β
0,n
( jv). (27)
Thus (26) c an be of the form
p
λ
(λ) =
1
2π
∞
−∞
N−1
n=0
ψ
β
0,n
(jv)
e
−jvλ
dv. (28)
By combining (28)and(24), we get
P
e
=
1
2π
2
π/2
0
∞
−∞
N−1
n=0
ψ
β
0,n
( jv)
×
∞
0
exp
−
A
2
2sin
φ
λ
2
− jvλ
dλ
J(v,φ)
dv dφ.
(29)
BER Analysis for MC-CDMA in Nakagami-m Fading Channels 1589
The integral of J(v, φ) can be obtained as [16]
J(v, φ) =
X(φ)+jY(v, φ)
exp
−
sin
2
φ
2A
2
v
2
=
X
2
(φ)+Y
2
(v, φ)exp
j arctan
Y(v, φ)
X(φ)
× exp
−
sin
2
φ
2A
2
v
2
,
(30)
where
1
F
1
(·; ·; ·) is the Kummer confluent hypergeometric
function [21]and
X(φ) =
π
2
sin φ
A
,
Y(v, φ) =−
1
F
1
1
2
;
3
2
;
sin
2
φ
2A
2
v
2
v sin
2
φ
A
2
.
(31)
Generally speaking, the characteristic function of a random
variable will be a complex quantity and hence the product of
the characteristic function in (27) will be also complex. How-
ever, since the average BER is real, it is sufficient to consider
only the real part of the right side of (29), which yields
P
e
=
1
2π
2
π/2
0
∞
−∞
N−1
n=0
ψ
β
0,n
( jv)
J(v, φ)
dv dφ, (32)
where (·) denotes the real part.
Next we elaborate the expression of the characteristic
function corresponding to the Nakagami-m fading channel.
By definition, the characteristic function of β
0,n
is given by
ψ
β
0,n
( jv) = E[exp(jβ
0,n
v)]. It can be expressed as [20]
ψ
λ
( jv) =
N−1
n=0
ψ
β
0,n
( jv)
=
N−1
n=0
U
2
0,n
(v)+V
2
0,n
(v)exp
j arctan
V
0,n
(v)
U
0,n
(v)
× exp
−
N−1
n=0
Ω
0,n
v
2
4m
0,n
(33)
in which
U
0,n
=
1
F
1
1
2
− m
0,n
;
1
2
;
Ω
0,n
v
2
4m
0,n
,
V
0,n
=
Γ
m
0,n
+1/2
Γ
m
0,n
Ω
0,n
m
0,n
v
1
F
1
1 − m
0,n
;
3
2
;
v
2
Ω
0,n
4m
0,n
.
(34)
Substituting (33)and(30) into (32)gives
P
e
=
1
2π
2
π/2
0
∞
−∞
exp
−
sin
2
φ
2A
2
+
N−1
n=0
Ω
0,n
4m
0,n
v
2
× W(v, φ)dv dφ,
(35)
where
W(v, φ) = R(v, φ)cosΘ(v, φ),
R(v, φ) =
X
2
(φ)+Y
2
(v, φ)
N−1
n=0
U
2
0,n
(v)+V
2
0,n
(v),
Θ(v, φ) = arctan
Y(v, φ)
X(φ)
+
N−1
n=0
arctan
V
0,n
(v)
U
0,n
(v)
.
(36)
Finally, letting η(φ) = sin
2
φ/2A
2
+
N−1
n=0
(Ω
0,n
/4m
0,n
)and
changing the variables as x =
η(φ)v, the inner infinite inte-
gral can b e derived as
∞
−∞
W
x
η(φ)
, φ
exp
− x
2
dx (37)
which can be readily evaluated by the Gaussian-Hermite
quadrature formula [21, 22],
∞
−∞
W
x
η(φ)
, φ
exp
− x
2
dx
=
N
p
i=1
H
x
i
W
x
i
η(φ)
, φ
+ R
N
p
,
(38)
where N
p
is the order of the Hermite polynomial H
N
p
(·)and
x
i
is the ith zero of the N
p
-order Hermite polynomial. H
x
i
are
the weight factors of the N
p
-order Hermite polynomial and
are given by
H
x
i
=
2
N
p
−1
N
p
!
√
π
N
p
2
H
N
p
−1
x
i
2
. (39)
The remainder of (38)is
R
N
p
=
N
p
!
√
π
2
n
(2n)!
W
(2N
p
)
√
2A
sin φ
ξ, φ
(−∞ <ξ<∞). (40)
The order number of N
p
can be properly selected by taking
both complexity and accuracy into consideration. Because of
the symmetry of the Hermite polynomials about the origin,
the nonzero roots occur in pairs ±x
i
, and the corresponding
weight coefficients obey the symmetr y relation H
x
i
= H
x
N
p
−i
.
Both the zeros and the weight factors of the N
p
-order Her-
mite polynomial are tabulated in [21, 22] for various poly-
nomial orders N
p
. Thus yielding the final result in the form
of a single finite integral on φ,namely,
P
e
=
1
2π
2
π/2
0
1
η(φ)
N
p
i=1
H
x
i
W
x
i
η(φ)
, φ
dφ. (41)
The average BER of a system with multiple users is obtained
by averaging (41) over individual users P
e
.
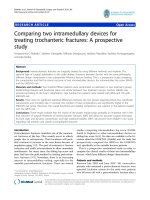
1590 EURASIP Journal on Applied Signal Processing
10
0
10
−1
10
−2
10
−3
10
−4
10
−5
Average BER
02468101214
E
b
/N
0
(dB)
Analytical results
Simulation results
Figure 2: BER as a function of E
b
/N
0
(dB) for the MRC receivers of
the uplink with different numbers of users in a fading channel. The
methods used are AGA analysis and computer simulations (N = 8;
◦: single user; ∗: 2 active users; +: 8 active users).
4. NUMERICAL AND SIMULATION RESULTS
In this section, both computer simulations and a theoret-
ical analysis are carried out to investigate the BER perfor-
mance of an MC-CDMA system with multiple active users in
a Nakagami-m fading channel. The fading channels used in
computer simulations are Rayleigh (corresponding to m = 1)
fading channels and Nakagami-m fading channels (m = 2is
selected). Both the uplink and downlink are considered here.
The simulated system utilizes Walsh-Hadamard (WH) codes
as signature sequences. The number of subcarriers is equal
to the length of the signature sequence. To calculate the BER,
it is assumed that the mean power of each interfering user is
equal to the mean power of the desired signal. It is also as-
sumed that the uplink users are synchronous within a cyclic
prefix. A flat fading channel on each subcarrier is used and
i.i.d. fading among different subcarriers is assumed in this
section.
Figure 2 shows the comparison of the results from
computer simulations and the AGA analysis presented in
Section 3 for the uplink MRC receiver in a Rayleigh fading
channel with different numbers of active users. The number
of subcarriers and maximum number of users used in the
simulation system is 8. As we can see from Figure 2, the re-
sults achieved by the AGA analysis agree well with those of
the computer simulations. Similar results can be obtained
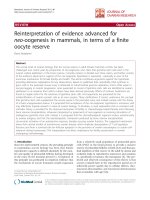
from Figure 3, which demonstrates the performance com-
parison of the same approach for the EGC receiver of the
uplink in a Rayleigh fading channel. From Figures 2 and 3,
it is not difficult to see that the AGA analysis gives nearly
the same results as the computer simulations. There exists
a marginal difference in the multiple user cases when MAI
becomes the dominant factor affecting system performance.
This is due to the inadequate assumption of a Gaussian MAI
10
0
10
−1
10
−2
10
−3
10
−4
Average BER
0246810121416
E
b
/N
0
(dB)
Analytical results
Simulation results
Figure 3:BERasafunctionofE
b
/N
0
(dB)fortheEGCreceiversof
the uplink with different numbers of users in a fading channel. The
methods used are AGA analysis and computer simulations (N = 8;
◦: single user; ∗: 2 active users; +: 8 active users).
model when the number of active users is small (K<10).
In [8], we have compared the analytical results for EGC re-
ceivers using the proposed AGA technique and the method
proposed in [8]. It was shown that the two analytical meth-
ods give quite the same analysis results from which the ac-
curacy of the presented analysis method was further demon-
strated. However, the method presented in [8] requires that
the fading channels on all subcarriers have the same fading
parameters.
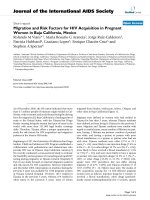
The approach presented in this paper can also be em-
ployed to obtain the BER for the receivers in the downlink of
an MC-CDMA system. Of course the formulas presented in
Section 3 must be changed to correspond to the synchronous
downlink case. The performance comparison between the
analytical and simulation results of both an MRC receiver
and EGC receiver in the downlink are shown in Figures 4
and 5, respectively. The number of subcarriers is fixed to 8
and the number of active users is varied. It is clearly seen
from these two figures that the approach is also accurate in
the downlink. MRC is not practical for the downlink as the
loss of orthogonality of the WH codes is emphasized in the
receiver when applying it. In the downlink, EGC outperforms
MRC in most cases, especially at high SNR. This means that
the loss of orthogonality for EGC, which is caused by channel
fading, is less than that of MRC.
In order to further verify the accuracy of the proposed
AGA method, the comparison between analysis and simu-
lation results for Nakagami-m fading channels with m = 2
is shown in Figure 6 (MRC receivers) and Figure 7 (EGC re-
ceiver). The considered system is uplink MC-CDMA with 8
subcarriers and different numbers of active users. From these
two figures it should be noted that the AGA method gives
more accurate results with m = 2 than in Rayleigh fading
channels.
BER Analysis for MC-CDMA in Nakagami-m Fading Channels 1591
10
0
10
−1
10
−2
10
−3
10
−4
10
−5
Average BER
0246810121416
E
b
/N
0
(dB)
Analytical results
Simulation results
Figure 4: BER as a function of E
b
/N
0
(dB) for the MRC receivers
of the downlink with different numbers of users in a fading chan-
nel. The methods used are AGA analysis and computer simulations
(N = 8; ◦: single user; ∗: 2 active users; +: 8 active users).
10
0
10
−1
10
−2
10
−3
10
−4
10
−5
Average BER
0 2 4 6 8 10121416
E
b
/N
0
(dB)
Analytical results
Simulation results
Figure 5:BERasafunctionofE
b
/N
0
(dB) for the EGC receivers
of the downlink with different numbers of users in a fading chan-
nel. The methods used are AGA analysis and computer simulations
(N
= 8; ◦: single user; ∗: 2 active users; +: 8 active users).
Figures 8 and 9 illust rate the effects of channel fading
parameter m on the performance of MRC and EGC re-
ceivers. Both figures show the analytical results for MRC and
EGC receivers in the uplink with different numbers of users.
The E
b
/N
0
is fixed to 0 dB and the number of subcarriers
N is 8. As expected, the system performance improves as
10
0
10
−1
10
−2
10
−3
10
−4
10
−5
Average BER
02468101214
E
b
/N
0
(dB)
Analytical results
Simulation results
Figure 6:BERasafunctionofE
b
/N
0
(dB) for the MRC receivers of
the uplink with different numbers of users in a fading channel. The
methods used are AGA analysis and computer simulations (N = 8;
fading parameter m = 2; ◦: single user; ∗: 2 active users; +: 8 active
users).
10
0
10
−1
10
−2
10
−3
10
−4
10
−5
Average BER
02468101214
E
b
/N
0
(dB)
Analytical results
Simulation results
Figure 7:BERasafunctionofE
b
/N
0
(dB)fortheEGCreceiversof
the uplink with different numbers of users in a fading channel. The
methods used are AGA analysis and computer simulations (N
= 8;
fading parameter m = 2; ◦: single user; ∗: 2 active users; +: 8 active
users).
the amount of fading decreases, more specifically, as m in-
creases, the performance of both EGC and MRC receivers be-
comes better. The performance of the receivers with the non-
fading channel can be obtained until m approaches 10. By
1592 EURASIP Journal on Applied Signal Processing
0.17
0.16
0.15
0.14
0.13
0.12
0.11
0.1
0.09
0.08
0.07
Average BER
012345678910
m
k = 1
k = 2
k = 4
k = 8
Figure 8: BER as a function of the fading parameter m for the MRC
receiver of the uplink with different numbers of active users (N = 8,
E
b
/N
0
= 0dB).
0.22
0.2
0.18
0.16
0.14
0.12
0.1
0.08
0.06
Average BER
012345678910
m
k = 1
k = 2
k = 4
k = 8
Figure 9: BER as a function of the fading parameter m for the EGC
receiver of the uplink with different numbers of active users (N = 8,
E
b
/N
0
= 0dB).
comparing the MRC receiver and the EGC receiver, it should
be noted that the performance curves of the EGC receiver
change more than that of the MRC receiver and this suggests
that the EGC receiver is more sensitive to the variation of
fading parameter m than the MRC receiver.
Using the expression for the BER obtained for the up-
link transmission in a Nakagami-m fading channel, the av-
erage BER versus the number of active users both for EGC
10
0
10
−1
10
−2
10
−3
10
−4
Average BER
0 50 100 150 200 250
Number of active users
MRC
EGC
Figure 10: BER as a function of the number of active users for both
the EGC and MRC receivers of the uplink in a Rayleigh fading chan-
nel (N = 256, E
b
/N
0
= 0 dB and 7 dB).
and MRC receivers with 256 subcarr iers in a Rayleigh fading
channel (m = 1) is shown in Figure 10.TheE
b
/N
0
is fixed at
0 and 7 dB. The significant impacts of MAI can be observed.
It can also be noted that at E
b
/N
0
= 7 dB, the fully loaded
system works well if efficient channel coding is employed.
5. CONCLUSIONS
The BER analysis for MC-CDMA receivers with multiple ac-
tive users in frequency-selective Nakagami-m fading chan-
nels was presented in this paper. The analysis was applied to
evaluate the performance of both EGC and MRC receivers
in the uplink and downlink. The AGA approach utilizes an
alternative expression for the Q-function, combining this
with the charac teristic function of Nakagami-m r.v.’s, thereby
eliminating the need for deriving the distribution of the sum
of Nakagami-m signals for the EGC receiver and, hence,
avoiding all approximations required therein. The approach
used in this paper has the advantage of simplicity in expres-
sion and computational efficiency. Both theoretical analysis
and computer simulations were used to evaluate the BER
performance of the receivers in Rayleigh fading channels. It
was of importance to observe that the computer simulations
demonstrated the accuracy of the analysis method based on
AGA. Therefore, the method presented here provides us with
a powerful practical tool to evaluate the BER p erformance of
MC-CDMA systems, especially when the number of subcar-
riers and users is too large to obtain simulation results. In
addition, it was also seen that the influence of MAI on the
system performance is significant and that the BER saturates
at high SNR for both EGC and MRC receivers in the uplink
and downlink when the system is heavily loaded.
BER Analysis for MC-CDMA in Nakagami-m Fading Channels 1593
APPENDIX
THE CHARACTERISTIC FUNCTION OF
A RAYLEIGH RANDOM VARIABLE
To obtain the performance of the receivers using EGC
in a Rayleigh fading, we can let m
0,n
= 1inSection 3.
Alternatively, it can be obtained by directly using the char-
acteristic function of Rayleigh r.v.’s.
The characteristic func tion of Rayleigh random variables
can be expressed by virtue of the sine and cosine transforms,
ψ
β
0,n
( jv) =
∞
0
2β
0,n
Ω
0,n
exp
−β
2
0,n
Ω
0,n
cos
β
0,n
v
dβ
0,n
+ j
∞
0
2β
0,n
Ω
0,n
exp
−β
2
0,n
Ω
0,n
sin
β
0,n
v
dβ
0,n
=
1
F
1
1;
1
2
;
−
Ω
0,n
v
2
4
+ j
πΩ
0,n
4
v exp
−
Ω
0,n
v
2
4
.
(A.1)
The following formulas from [23] have been used
∞
0
x
v
exp
− αx
2
cos(xy)dx
=
1
2
α
−(1/2)(1+v)
Γ
1
2
+
1
2
v
×
1
F
1
1
2
+
1
2
v;
1
2
; −
y
2
4α
,
∞
0
x exp
− αx
2
sin(xy)dx
=
1
4
α
−(1/2)(1+v)
√
πa
−3/2
y exp
−
1
4
a
−1
y
2
.
(A.2)
The characteristic function of a Rayleigh random vari-
able can also be written as
ψ
β
0,n
( jv) =
1
F
1
−
1
2
;
1
2
;
Ω
0,n
v
2
4
+ j
πΩ
0,n
4
v
× exp
−
Ω
0,n
v
2
4
,
(A.3)
where the property [21]
1
F
1
(a, b, z) = e
z
×
1
F
1
(b − a, b, z), (A.4)
was used. Then following the same procedure as in Section 3
and making some changes, the performance of EGC in a
Rayleigh fading channel can be obtained.
ACKNOWLEDGMENTS
The authors would like to acknowledge Dr. Mohammed
Abdel-Hafez from United Arab Emirates University for use-
ful discussions when preparing this paper. The reviewers are
appreciated for their helpful comments and suggestions. This
paper w as presented in part a t the IEEE International Con-
ference on Communications (ICC ’02), New York, April 28-
May 2, 2002. This research was supported by the Academy of
Finland, the Finnish National Technology Agency ( TEKES),
Nokia, the Finnish Defence Forces, and Elektrobit.
REFERENCES
[1] K. Fazel and S. Kaiser, Eds., Multi-Carr ier Spread-Spectrum &
Related Topics, Kluwer Academic, Boston, Mass, USA, 2002.
[2] S. Hara and R. Prasad, “Overview of multicarrier CDMA,”
IEEE Communications Magazine, vol. 35, no. 12, pp. 126–133,
1997.
[3] N. Yee, J P. Linnartz, and G. Fettweis, “Multicarrier CDMA
in indoor wireless radio networks,” in Proc. IEEE Personal,
Indoor and Mobile Radio Communications (PIMRC ’93),pp.
109–113, Yokohama, Japan, September 1993.
[4] X. Gui and T. S. Ng, “Performance of asynchronous orthog-
onal multicarrier CDMA system in frequency selective fad-
ing channel,” IEEE Trans. Communications,vol.47,no.7,pp.
1084–1091, 1999.
[5] J. Jang and K. B. Lee, “Effects of frequency offset on
MC/CDMA system performance,” IEEE Communications Let-
ters, vol. 3, no. 7, pp. 196–198, 1999.
[6] C. K. Kim and Y. S. Cho, “Performance of a wireless MC-
CDMA system with an antenna array in a fading channel: re-
verse link,” IEEE Trans. Communications,vol.48,no.8,pp.
1257–1261, 2000.
[7] S. Moon, G. KO, and K. Kim, “Performance analysis of or-
thogonal multicarrier-CDMA on two-ray multipath fading
channels,” IEICE Transactions on Communications, vol. E84-
B, no. 1, pp. 128–133, 2001.
[8] Z. Li a nd M. Latva-aho, “BER performance evaluation for
MC-CDMA systems in Nakagami-m fading,” Electronics Let-
ters, vol. 38, no. 24, pp. 1516–1518, 2002.
[9] N. C. Beaulieu, “An infinite series for the computation of the
complementary probability distribution function of a sum of
independent random variables and its application to the sum
of Rayleigh random variables,” IEEE Trans. Communications,
vol. 38, no. 9, pp. 1463–1474, 1990.
[10] B. Smida, C. L. Despins, and G. Y. Delisle, “MC-CDMA per-
formance evaluation over a multipath fading channel using
the characteristic function method,” IEEE Trans. Communi-
cations, vol. 49, no. 8, pp. 1325–1328, 2001.
[11] M. K. Simon and M S. Alouini, “A unified performance
analysis of digital communication with dual selective combin-
ing diversity over correlated Rayleigh and Nakagami-m fading
channels,” IEEE Trans. Communications, vol. 47, no. 1, pp. 33–
43, 1999.
[12] Q. T. Zhang, “Exact analysis of postdetection combining
for DPSK and NFSK systems over arbitrarily correlated Nak-
agami channels,” IEEE Trans. Communications, vol. 46, no. 11,
pp. 1459–1467, 1998.
[13] M. Nakagami, “The m-distribution—A general formula of in-
tensity distribution of rapid fading,” in Statistical Methods in
Radio Wave Propagation, pp. 3–36, Pergamon Press, Oxford,
UK, 1960.
[14] S. Kaiser, Multi-carrier CDMA mobile radio system-analysis
and optimization of de tection, decoding, and channel estima-
tion, Ph.D. dissertation, University of Munich, Munich, Ger-
many, 1998.
[15] Z. Li and M. Latva-aho, “Performance comparison of
frequency domain equalizer for MC-CDMA systems,” in
Proc. IEEE International Conference on Mobile and Wi reless
1594 EURASIP Journal on Applied Signal Processing
Communications Networks (MWCN ’01), pp. 85–89, Recife,
Brazil, August 2001.
[16] M. K. Simon and M S. Alouini, “A unified approach to the
performance analysis of digital communication over general-
ized fading channels,” Proceedings of the IEEE, vol. 86, no. 9,
pp. 1860–1877, 1998.
[17] A. Papoulis, Probability, Random Variables, and Stochastic Pro-
cesses, McGraw-Hill, New York, NY, USA, 3rd edition, 1991.
[18] J. G. Proakis, Digital Communications, McGraw-Hill, New
York, NY, USA, 3rd edition, 1995.
[19] I. S. Gradshteyn and I. M. Ryzhik, Table of Integrals, Series, and
Products, Academic Press, San Diego, Calif, USA, 5th edition,
1994.
[20] M S. Alouini and M. K. Simon, “Performance analysis of co-
herent equal gain combining over Nakagami-m fading chan-
nels,” IEEE Trans. Vehicular Technology,vol.50,no.6,pp.
1449–1463, 2001.
[21] M. Abramowitz and I. A. Stegun, Handbook of Mathemati-
cal Functions with Formulas, Graphs, and Mathematical Tables,
Dover Publications, New York, NY, USA, 10th edition, 1972.
[22] Z. Kopal, Numerical Analysis, Chapman & Hall, London, UK,
2nd e dition, 1961.
[23] A. Erdelyi, Ed., Tables of Integral Transforms, vol. 1, McGraw-
Hill, New York, NY, USA, 1954.
Zexian Li received the Ph.D. degree from
Beijing University of Posts and Telecom-
munications, Beijing, China in 1999. Before
that, he received the B.S. and M.S. de-
greesfromHarbinInstituteofTechnol-
ogy, Harbin, China, in 1994 and 1996, re-
spectively. From August 1999 to September
2000, he was a Research Engineer in Huawei
Technologies Co. Ltd., Beijing. Since Octo-
ber 2000, he has been working in Centre for
Wireless Communications (CWC) at University of Oulu, Finland.
His research interests include future broadband wireless communi-
cations, multicarrier communication systems, communication the-
or y, information theory, and advanced signal processing for com-
munications.
Matti Latva-aho received the M.S. (E.E.),
Lic.Tech., and Dr. Tech degrees from the
University of Oulu, Finland in 1992, 1996,
and 1998, respectively. From 1992 to 1993,
he was a Research Engineer at Nokia Mobile
Phones, Oulu, Finland. During the years
1994–1998 he was a Research Scientist at
Telecommunication Laboratory and Centre
for Wireless Communications at the Uni-
versity of Oulu. Prof. Latva-aho has been
Director of Centre for Wireless Communications at the Univer-
sity of Oulu during 1998–2003. Since 2000 he has been Professor
of digital transmission techniques at Telecommunications Labora-
tory. His research interests include future broadband wireless com-
munication systems and related transceiver algorithms. Prof. Latva-
aho has published more than 70 conference or jour nal papers in the
field of CDMA communications.