Báo cáo hóa học: " A Digital Signal Processing Method for Gene Prediction with Improved Noise Suppression" ppt
Bạn đang xem bản rút gọn của tài liệu. Xem và tải ngay bản đầy đủ của tài liệu tại đây (784.18 KB, 7 trang )
EURASIP Journal on Applied Signal Processing 2004:1, 108–114
c
2004 Hindawi Publishing Corporation
A Digital Signal Processing Method for Gene Prediction
with Improved Noise Suppression
Trevor W. Fox
Research and Development Department, Intelligent Engines Corporation, 903 42 St. SW, Calgary, Alberta, Canada T3C-1Y9
Email:
Alex Carreira
Department of Electrical and Computer Engineering, University of Calgary, 2500 University Drive N.W.,
Calgary, Alberta, Canada T2N 1N4
Email:
Received 1 March 2003; Revised 15 September 2003
It has been observed that the protein-coding regions of DNA sequences exhibit period-three behaviour, which can be exploited to
predict the location of coding regions within genes. Previously, discrete Fourier transform (DFT) and digital filter-based methods
have been used for the identification of coding regions. However, these methods do not significantly suppress the noncoding
regionsintheDNAspectrumat2π/3. Consequently, a noncoding region may inadvertently be identified as a coding region.
This paper introduces a new technique (a single digital filter operation followed by a quadratic window operation) that suppresses
nearly all of the noncoding regions. The proposed method therefore improves the likelihood of correctly identifying coding regions
in such genes.
Keywords and phrases: gene prediction, digital filter, DNA.
1. INTRODUCTION
Finding coding regions (exons) in a DNA strand involves
searching amongst the many nucleotides that comprise a
DNA strand. Typically a DNA molecule contains millions to
hundreds of millions of elements [1]. The problem of finding
exonsinaDNAsequenceiswellsuitedtocomputersbecause
DNA sequences can be represented by data that is easily pro-
cessed by a computer. DNA strands can be represented by
sequences of letters from a four-character alphabet. Conven-
tion dictates the use of the letters A, T, C, and G in each el-
ement to represent each of the four distinct nucleotides [1].
A nucleotide has two distinct ends: a 3
end and a 5
end. A
covalent chemical bond links the 5
end of one nucleotide to
the 3
end of another nucleotide. A DNA strand is comprised
of many nucleotides linked in this fashion [1]. The DNA se-
quence representing a DNA strand consists of the letters A,
T, C, and G listed in a left-to-right fashion corresponding to
the nucleotides that make up the strand arranged left to right
from their 5
to 3
ends [1].
A DNA strand can be divided into genes and intergenic
spaces. Genes are responsible for protein synthesis. A gene
can be further subdivided into exons and introns for cells
with a nucleus (eukaryotes) [2]. Cells without a nucleus are
called prokaryotes and do not contain introns [2]. The exons,
coding regions within genes, are denoted by start and stop
codons. Codons are a subsequence of three letters within the
DNA sequence. Because codons are comprised of three letters
from the four-letter alphabet that makes up a DNA sequence,
there are 64 possible codons [1]. Of the 64 possible codons,
there are one start codon and three stop codons, and the re-
mainder of the codons correspond to one of the twenty pos-
sible amino acids of a protein [1]. The relationship between
DNA sequences, genes, intergenic spaces, exons, introns, and
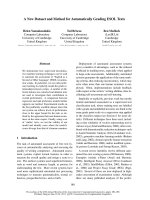
codons is illustrated in Figure 1.
Some exons within the protein-coding regions of DNA
sequences of eukaryotes tend to exhibit a period-three pat-
tern [2, 3, 4, 5]. The period-three pattern of the exons can be
exploited to predict gene locations and even predict specific
exons within the genes of eukaryotic cells [2, 3, 4, 5].
Previous digital signal processing (DSP) methods for the
identification of coding regions (exons) in DNA sequences
include the application of the discrete Fourier transform
(DFT) on overlapping windows [1, 3, 4] and the application
of bandpass digital filters that are centered at 2π/3[2, 6]. The
output of a bandpass digital filter centered at 2π/3canbe
thought of as one measure of the DNA spectral content at
frequency 2π/3. Digital filter methods are of interest because
DSP Method for Gene Prediction 109
5
DNA sequence
3
Gene Gene
Intergenic spaces
(a)
Gene
IntronIntron
Exons
(b)
Stop
codon
Exon
A T G G T G C A C GCT T A T C A C T A A
Intron Exon
Start
codon
Codon
(c)
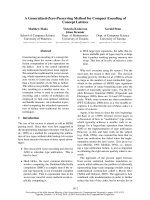
Figure 1: (a) An abstraction to illustrate the genes and intergenic
spaces which comprise a DNA sequence. (b) An abstraction of a
gene to illustrate the subdivision of a gene into exons and introns.
(c) Various subsequences that comprise exons and introns in a gene
(each three-letter grouping is a codon). The start codon is always
ATG.However,oneofthethreepossiblestopcodonsisillustrated
as (TAA).
they are significantly faster than the DFT method and they
can be used to suppress more of the DNA background noise
than it is possible by using the DFT method [2, 6].
DSP methods that only exploit period-three behaviour
have many shortcomings. These methods are unable to reli-
ably locate coding regions that do not have strong period-
three characteristics. Methods based on hidden Markov
models [7, 8, 9] provide superior results in these circum-
stances. The models used in these methods are also suffi-
ciently accurate to account for exon and intron length dis-
tributions [10]. Alternatively, computational methods that
exploit the heterogeneous statistical properties of DNA se-
quences to recursively segment homogeneous subsequences
from their heterogeneous supersequences can be used for the
identification of the borders between coding and noncod-
ing regions [11, 12, 13]. The accuracy of these segmentation
methods for coding region identification in DNA sequences
surpasses the method presented in this paper and other DSP
methods when applied to DNA sequences that do not have
coding regions exhibiting a periodicity of three.
The method presented in this paper is an extension of
DSP methods that exploit period-three behaviour. Previous
DSP methods that exploit period-three behaviour do not en-
tirely suppress the noncoding regions in the DNA spectrum
at 2π/3. As a result, a noncoding region may be incorrectly
identified as a coding region. Also the methods presented in
[2, 6] require four digital filter operations. In contrast, this
paper presents a method that requires only one digital fil-
ter operation followed by a quadratic windowing operation.
The quadratic window produces a signal that has almost zero
energy in the noncoding regions. The proposed method can
therefore improve the likelihood of correctly identifying cod-
ing regions over previous digital filtering methods. However,
the accuracy of the proposed method suffers when dealing
with coding regions that do not exhibit strong period-three
behaviour. Also the methods presented in [7, 8, 9]areableto
accurately model structures in genes, whereas the proposed
method cannot. Despite these limitations, the method pro-
posed in this paper can be used to generate one of the signals
of a more complex gene finding method.
This paper is organized as follows. Section 2 reviews pre-
vious DSP methods for the identification of coding regions
in DNA sequences. In particular, the DFT and digital filter
methods are discussed. Section 3 presents a new computa-
tionally efficient one-step digital filter method for the identi-
fication of coding regions. Section 4 presents a new quadra tic
window operation that improves the suppression of noncod-
ing regions from the DNA spectrum at frequency 2π/3. In the
example presented, noise suppression is improved by almost
three orders of magnitude. Section 5 presents the conclusions
of this research.
2. PREVIOUS DIGITAL SIGNAL PROCESSING
METHODS FOR IDENTIFYING CODING REGIONS
Strands of DNA consist of four nucleotides (or bases), which
are designated by the characters A, T, C, and G [1]. A char-
acter string composed of these four bases can be mapped to
four signals [1]. The signal u
A
(n) takes the value of either 1 if
A is present in the DNA sequence at index n,or0ifAisab-
sent at index n.Forexample,u
A
(n) for the DNA segment AT-
GCTGAA is 10000011. The signals u
T
(n), u
C
(n), and u
G
(n)
can be obtained in a similar fashion.
The DFT of u
A
(n)overN samples is defined [14]as3pt
U
A
(k) =
N−1
n=0
u
A
(n)e
− j2πkn/N
,0≤ k ≤ N − 1. (1)
In a similar fashion, the DFT of u
T
(n), u
C
(n), and u
G
(n)
can be obtained. For many genes, period-three behaviour has
been observed and is useful for identifying coding regions
[2, 3, 4, 5]. Specifically, the (k = N/3)-DFT coefficient mag-
nitude is often significantly larger than the surrounding DFT
coefficient magnitudes and corresponds to a coding region
within the gene [1, 3, 4]. This effect varies and can be quite
pronounced or quite weak, depending upon the gene [2].
A figure that can be used to measure the total spectral
content of a DNA character string at frequency k is defined
as [1, 4, 15]
S
A+C+T+G
(k) =
U
A
(k)
2
+
U
T
(k)
2
+
U
C
(k)
2
+
U
G
(k)
2
.
(2)
110 EURASIP Journal on Applied Signal Processing
0.016
0.014
0.012
0.01
0.008
0.006
0.004
0.002
0
S(N/3)
0 1000 2000 3000 4000 5000 6000 7000 8000
Relative base location n
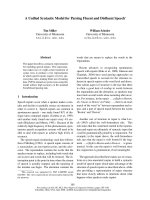
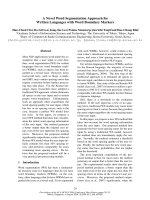
Figure 2: The s ignal S
A+C+T+G
(N/3) for gene F56F11.4 in the C-
elegans chromosome III (N = 351).
The subscript of S
A+C+T+G
(k) indicates that all four nu-
cleotide signals are considered. Corresponding to the pre-
viously described period-three behaviour, the value of
S
A+C+T+G
(k) is large at k = N/3 when a coding region is
present. The progression of S
A+C+T+G
(N/3) can be plotted
by evaluating S
A+C+T+G
(N/3) over a window of N samples,
sliding the window by one or more sample, and recalcu-
lating S
A+C+T+G
(N/3) [1]. This process can be carried out
over the entire DNA sequence. As an example, consider the
gene F56F11.4 in the C-elegans chromosome III. The value of
S
A+C+T+G
(N/3) using N = 351 is plotted over the base num-
bers 7021 to 15080 in Figure 2.
The four dominant peaks in Figure 2 clearly indicate cod-
ing regions. However, a fifth coding region is present from
929 to 1135 but its small peak is obscured by 1/f DNA back-
ground noise. (The work presented in [15, 16, 17]observes
the pr esence of 1/f background noise in DNA sequences.)
The DFT method for the identification of coding regions
can be interpreted as a bandpass digital filter operation fol-
lowed by a decimation operation [2]. The bandpass digi-
tal filter associated with the DFT method is centered at fre-
quency 2π/3 and has a minimum stopband attenuation of
only 13 dB. High frequency selective bandpass digital filters
for the identification of coding regions c an be used instead of
the DFT and have been presented in [2, 6] by Vaidyanathan
and Yoon. The digital filter presented in [6] is a second-
order antinotch filter. The digital filter presented in [2]isan
eleventh-order bandpass digital filter with a minimum stop-
band attenuation of 60 dB.
The digital filter method for the identification of coding
regions does not require the use of a sliding window [2, 6].
Instead, the signals u
A
(n), u
C
(n), u
T
(n), and u
G
(n) are in-
dividually processed using the same digital filter to produce
the signals y
A
(n), y
C
(n), y
T
(n), and y
G
(n). A pseudomeasure
of the total spectral content of a DNA sequence at frequency
2π/3, y
A+C+T+G
(n), is given by [2, 6]
y
A+C+T+G
(n) =
y
A
(n)
2
+
y
C
(n)
2
+
y
T
(n)
2
+
y
G
(n)
2
.
(3)
The signal y
A+C+T+G
(n) produces large values in coding re-
gions that exhibit strong period-three behaviour [2, 6] and is
therefore an indicator for coding regions.
The digital filter method is much faster than the DFT
method. For example, processing gene F56F11.4 in the C-
elegans chromosome III using the DFT method requires 264
seconds on a 400 MHz Pentium II computer. In contrast, the
digital filter method presented in [2] requires only 0.36 sec-
onds, which is 733 times faster than the DFT method.
3. GENE PREDICTION USING A SINGLE
DIGITAL FILTER
The m ethods presented by Vaidyanathan and Yoon in [2, 6]
require a digital filtering operation for each of the four u
A
(n),
u
C
(n), u
T
(n), and u
G
(n) signals for a total of four separate
filtering operations. We now introduce a method that only
requires one application of a digital filtering operation by fil-
tering a single signal composed of u
T
(n)andu
G
(n). This new
approach also removes much more of the DNA background
noise than it is possible by using the methods presented in
[2, 6]. In the following two sections, the optimization prob-
lem for creating this new signal is described and solved for a
specific example.
3.1. Optimized signal construction
The number of digital filter operations can be reduced from
four to one with the creation of a new signal that encapsulates
the entire DNA sequence
u
A+C+T+G
(n) = au
A
(n)+cu
C
(n)+tu
T
(n)+gu
G
(n), (4)
where a, c, t,andg are real-valued parameters. Strand sy m-
metry [18, 19, 20] can be exploited to further reduce the
complexity of (4) to the sum of t wo terms. A long DNA se-
quence can be approximated using a two-symbol representa-
tion, where one symbol is either A or T and the other symbol
is either C or G. In this case, the signal becomes
u
T+G
(n) = tu
T
(n)+gu
G
(n). (5)
Strand symmetry may not hold for shorter DNA sequences
(on the order of 100 bases) and therefore strand symme-
try should be verified before using (5) on short sequences.
Section 3.2 compares the use of (4)and(5)foratestDNA
sequence.
An optimization-based approach can be used to select the
values of t and g (or a, c, t,andg if the strand symmetry
is not used). A digital filter for gene prediction is first ob-
tained from either the literature or from a suitable filter de-
sign method (this paper uses the digital filter presented in
[2]). This digital filter is used in the optimization process to
produce v
T+G
(n)fromu
T+G
(n). A DNA sequence is selected
where all of the coding regions are known. A pseudomeasure
DSP Method for Gene Prediction 111
2
1.5
1
0.5
0
y
A+C+T+G
(n)
0 1000 2000 3000 4000 5000 6000 7000 8000
Relative base location n
(a)
15
10
5
0
y
T+G
(n)
0 1000 2000 3000 4000 5000 6000 7000 8000
Relative base location n
(b)
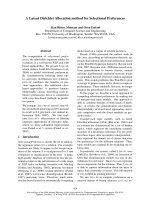
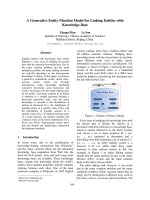
Figure 3: The signals y
T+G
(n)andy
A+C+T+G
(n) for gene F56F11.4
in the C-elegans chromosome III using the proposed single digital
filter method.
of the total spectral content of a DNA sequence at 2π/3is
given by
y
T+G
(n) = v
2
T+G
(n). (6)
The ratio of y
2
T+G
(n) accumulated over all of the coding re-
gions to y
2
T+G
(n) accumulated over all of the noncoding re-
gions is maximized by choosing the t and g parameters:
Maximize
n
0
∈[coding region]
y
2
T+G
n
0
n
1
∈[noncoding region]
y
2
T+G
n
1
. (7)
3.2. Applying the signal optimization
As an example, consider the use of the digital filter presented
in [2] and the chromosome XVI of S. cerevisiae dataset. The
quasi-Newton optimization method [21] is used to solve the
above optimization problem for a two-symbol signal and for
a four-symbol signal. T he method proposed in this section is
then used to process gene F56F11.4 in the C-elegans chromo-
some III over the base numbers 7021 to 15080 (see Figure 3).
Figure 3 demonstrates that y
T+G
(n)andy
A+C+T+G
(n)arevery
similar due to the strand symmetry. The use of y
T+G
(n)is
preferred because of its simplicity.
All five exons in Figure 3 are clearly visible in both
y
T+G
(n)andy
A+C+T+G
(n). The remaining peaks do not have
sufficient magnitude to obscure any of the coding regions.
The total energy of y
T+G
(n) in the noncoding regions is de-
fined as
n∈[noncoding region]
y
T+G
2
(n). This is a useful perfor-
mance measure to gauge the effectiveness of a DSP gene pre-
diction method for the suppression of the noncoding re-
gions in y
T+G
(n). The total energy of y
T+G
(n) using the single
digital filter method is 56.6. In contrast, the total energy of
2.5
2
1.5
1
0.5
0
y
T+G0
(n)
0 1000 2000 3000 4000 5000 6000 7000 8000
Relative base location n
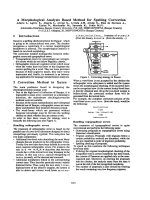
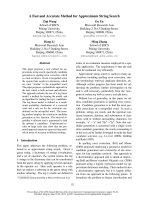
Figure 4: The signal y
T+G0
(n) for gene F56F11.4 in the C-elegans
chromosome III.
y
T+G
(n) in the noncoding regions using the multiple digital
filter method as presented in [2] is 273.7, w hich is almost five
times larger than the proposed single dig ital filter method.
Clearly in this example, the proposed method improves the
likelihood of correctly identifying the coding regions by re-
ducing the total energy of y
T+G
(n) in the noncoding regions.
The initial coding region for gene F56F11.4 in the C-
elegans chromosome III has a weak period-three characteris-
tic, which is evident in Figures 2 and 3.InFigure 2, the initial
coding region is obscured by noise. Optimizing the param-
eters t and g in u
T+G
(n) over a training sequence consisting
of initial, internal, and terminal coding regions can be used
to suppress a significant portion of this noise (see Figure 3).
However, the relative height of the peak in y
T+G
(n) associated
with the initial coding region is almost unchanged.
Our experiments indicate that the method proposed in
this paper cannot be used to increase the relative height of
the peaks in y
T+G
(n) associated with coding regions with-
out also increasing the energy in the noncoding regions.
We have attempted to optimize a new signal, u
T+G0
(n), that,
when filtered, produces larger peaks for initial coding re-
gions. A training dataset composed only of initial coding
regions in XVI of S. cerevisiae was used to obtain t and g.
Figure 4 shows y
T+G0
(n) for gene F56F11.4 in the C-elegans
chromosome III. The relative height of the peak associated
with the initial coding region shown in Figure 4 has in-
creased but at the expense of a significant increase in the
signal energy in the noncoding regions. Consequently, the
use of u
T+G0
(n) has little practical benefit because the in-
creased signal energy in the noncoding regions decrease the
likelihood of correctly identifying the coding regions. Sim-
ilar results can be obtained if t and g are optimized only
for internal coding regions or only for terminal coding re-
gions. In contrast, methods based on hidden Markov models
[7, 8, 9]usesufficiently accurate models to predict the loca-
tion of coding regions that do not have strong period-three
characteristics.
112 EURASIP Journal on Applied Signal Processing
2
1.8
1.6
1.4
1.2
1
0.8
0.6
0.4
0.2
0
y
w
(p)
00.20.40.60.811.21.41.61.82
y(p)
Figure 5: The quadratic window nonlinearity plotted for
Maxvalue = 2.
4. A QUADRATIC WINDOW OPERATION TO SUPPRESS
NONCODING REGIONS
The single digital filter method for the identification of cod-
ingregionsdoesnotalwayssuppressallofthepeaksfound
in the noncoding regions of y
T+G
(n) (see Figure 3). Conse-
quently, the noncoding regions may obscure the coding re-
gions in some datasets. To reduce uncertainty in the identi-
fication of coding regions, a new quadratic windowing oper-
ation is now introduced that can be used to effectively sup-
press the noncoding regions while preserving the coding re-
gions. This quadratic windowing operation is performed af-
ter the single digital filter operation on y
T+G
(n).
Themaximumvalueofy
T+G
(n) in a coding region is al-
most always greater than the maximum value of y
T+G
(n)ina
noncoding region although the difference in magnitude be-
tween the two may be small. It is desirable to exaggerate the
difference in magnitude between the coding and noncoding
regions so that the coding regions can be more easily identi-
fied. To this end, a window of M samples is processed using
the following operation:
y
w
(p) =
y
T+G
(p)
Maxvalue
2
· y
T+G
(p), 1 ≤ p ≤ M,(8)
where p is the window sample index, M is the number of
samples in the window, y
w
(p) is the pth windowed sample
value, and Maxvalue is the largest value of y
T+G
(p) in the
window.
The quadratic windowing operation defined in (8)mul-
tiplies y
T+G
(p) by a value that approaches zero in a quadratic
fashion as y
T+G
(p) approaches zero. Noncoding regions in
the window that have sample values less than Maxvalue are
effectively suppressed. Consider a window of samples that
has maximum sample value of 2. The quadratic window op-
eration produces y
w
(p) values of 0.0313 and 0.25 for y
T+G
(p)
values that equal 0.5 and 1, respectively, as shown in Figure 5.
To preserve the coding regions in y
T+G
(n), the size of the
15
10
5
0
y
T+G
w
(n)
0 1000 2000 3000 4000 5000 6000 7000 8000
Relative base location n
Figure 6: The signal y
T+G
w
(n) for gene F56F11.4 in the C-ele gans
chromosome III using the quadratic window (8).
window should not contain more than one coding region. In
this case, the sole coding region in the window is not sup-
pressed because the value of the largest sample, which be-
longs to the coding region, is not changed when using (8). A
DNA sequence, where all of the coding regions are known,
can be used to select the window size. The w indow size is
set to a value less than the minimum number of samples be-
tween adjacent coding regions and greater than the number
of samples of the widest coding region.
After a window of M samples has been processed, the
window is then moved M samples, which prevents the suc-
cessive windowing operations from overlapping.
The quadratic windowing operation is now applied to
the gene F56F11.4 in the C-elegans chromosome III over
the base numbers 7021 to 15080. Figure 3 shows the origi-
nal y
T+G
(n) signal obtained using the method discussed in
Section 3.2. The quadratic window of (8) is used to obtain
the signal y
w
(p), as shown in Figure 6. The window size is set
to M = 1100 samples. The five coding regions (exons) domi-
nate the signal y
w
(n). In the coding regions, the signal y
w
(n)
has been suppressed to near-zero values, which improves the
certainty of correctly identifying the coding regions.
Table 1 compares the suppression of the noncoding re-
gions by comparing the total energy in these regions for the
multiple digital filter gene prediction method presented in
[2], the single digital filter method presented in Section 3,
and the single digital filter method followed by the quadratic
window operation presented in this section. This numeri-
cal experiment used gene F56F11.4 in the C-elegans chr omo-
some III over the base numbers 7021 to 15080.
The multiple digital filter method does not effectively
minimize the total energy in the noncoding regions. The to-
tal energy in the noncoding regions for the multiple digital
filter method is 720 times greater than the total energy in
noncoding regions for the method proposed in this section
and almost five times greater than the method presented in
Section 3. As a result, a noncoding region may inadvertently
DSP Method for Gene Prediction 113
Table 1: A comparison of the performance between competing
gene prediction methods.
Gene prediction method
Total energy in the
noncoding regions
Single digital filter method followed
by the quadratic window operation
0.38
Single digital filter method 56.6
Multiple digital filter method [2] 273.7
Table 2: A comparison of SNR values between competing gene pre-
diction methods.
Gene SNR SNR
(single digital filter method
followed by the quadratic
window operation)
(multiple digital
filter method [2])
F56F11.4 107 4
ZK250.9 225 18
ZK250.10 848 22
F54D8.1 64 11
be identified as a coding region when using the multiple digi-
tal filter method. In contrast, all five coding regions can easily
be identified using the methods presented in this section.
The quadratic windowing method (single digital filter
method followed by a quadratic window operation) is now
compared in more depth with Vaidyanathan and Yoon’s mul-
tiple digital filter method [2]. Ta ble 2 compares the signal-
to-noise ratio (SNR), see (9), for the following test genes:
F56F11.4 in the C-elegans chromosome III, ZK250.9 and
ZK250.10 in the C-elegans chromosome II, and F54D8.1 in
the C-elegans chromosome III.
The SNR performance measure considers both the en-
ergy in the coding and noncoding regions. High SNR signals
have low energy levels in the noncoding regions and high en-
ergy levels in the coding regions. For high SNR signals, the
task of identifying coding regions is greatly simplified be-
cause the coding regions dominate over the noncoding re-
gions
SNR =
n
0
∈[coding region]
y
2
T+G
n
0
n
1
∈[noncoding region]
y
2
T+G
n
1
. (9)
Table 2 shows that the multiple digital filter method con-
sistently generates significant lower SNR signals than does
the method proposed in this paper. Consequently, the task of
identifying coding regions in signals generated by the multi-
ple digital filter method is more problematic.
5. CONCLUSION
Methods for the identification of coding regions that solely
rely on digital filters [2, 6] are unable to significantly attenu-
ate the noncoding regions in y
T+G
(n). Consequently, a non-
coding region may inadvertently be identified as a coding re-
gion. This paper introduced a new DSP technique (a single
digital filter operation followed by a quadratic window op-
eration) that can be used to suppress nearly all of the non-
coding regions in y
T+G
(n). This paper demonstrated that the
total energy in the noncoding regions of y
T+G
(n)canbere-
duced by a factor of 720 compared to the previous digital
filter techniques for gene F56F11.4 in the C-elegans chromo-
some III. As a result, the proposed method can improve the
likelihood of correctly identifying coding regions.
ACKNOWLEDGMENTS
The authors wish to thank the anonymous reviewers for their
comments and valuable suggestions which helped in improv-
ing this paper.
REFERENCES
[1] D. Anastassiou, “Genomic signal processing,” IEEE Signal
Processing Magazine, vol. 18, no. 4, pp. 8–20, 2001.
[2] P. P. Vaidyanathan and B J. Yoon, “Digital filters for gene pre-
diction applications,” in Proc. Asilomar Conference on Signals,
Systems, and Computers, pp. 306–310, Pacific Grove, Calif,
USA, November 2002.
[3] D. Anastassiou, “DSP in genomics,” in Proc. IEEE Int. Conf.
Acoustics, Speech, Signal Processing, pp. 1053–1056, Salt Lake
City, Utah, USA, May 2001.
[4] S. Tiwari, S. Ramachandran, A. Bhattacharya, S. Bhat-
tacharya, and R. Ramaswamy, “Prediction of probable genes
by Fourier analysis of genomic sequences,” Comput. Appl.
Biosci., vol. 13, no. 3, pp. 263–270, 1997.
[5] J. W. Fickett, “Recognition of protein coding regions in DNA
sequences,” Nucleic Acids Res., vol. 10, no. 17, pp. 5303–5318,
1982.
[6] P. P. Vaidyanathan and B J. Yoon, “Gene and exon prediction
using allpass-based filters,” in Workshop on Genomic Signal
Processing and Statistics, Raleigh, NC, USA, October 2002.
[7] J. Henderson, S. Salzberg, and K. H. Fasman, “Finding genes
in DNA with a hidden Markov model,” J. Comput Biol., vol.
4, no. 2, pp. 127–141, 1997.
[8] D. Kulp, D. Haussler, M. G. Reese, and F. H. Eeckman, “A gen-
eralized hidden Markov model for the recognition of human
genes in DNA,” in Proc. of the 4th International Conference
on Intelligent Systems for Molecular Biology, Menlo Park, Calif,
USA, 1996.
[9] A. Krogh, I. S. Mian, and D. Haussler, “A hidden Markov
model that finds genes in E. coli DNA,” Nucleic Acids Res.,
vol. 22, no. 22, pp. 4768–4778, 1994.
[10] C. B. Burge and S. Karlin, “Finding the genes in genomic
DNA,” Curr. Opin. Struct. Biol., vol. 8, no. 3, pp. 346–354,
1998.
[11] P. D. Cristea, “Large scale features in DNA genomic signals,”
Signal Processing, vol. 83, no. 4, pp. 871–888, 2003.
[12] W. Li, P. Bernaola-Galvan, F. Haghighi, and I. Grosse, “Ap-
plications of recursive segmentation to the analysis of DNA
sequences,” Computers & Chemistry, vol. 26, no. 5, pp. 491–
510, 2002.
[13] W. Li, G. Stolovitzky, P. Bernaola-Galvan, and J. L. Oliver,
“Compositional heterogeneity within, and uniformity be-
tween, DNA sequences of yeast chromosomes,” Genome Re-
search, vol. 8, no. 9, pp. 916–928, 1998.
[14] A. Oppenheim and R. Schafer, Discrete-Time Signal Process-
ing, Prentice-Hall, Englewood Cliffs, NJ, USA, 1989.
114 EURASIP Journal on Applied Signal Processing
[15] R. F. Voss, “Evolution of long-range fractal correlations and
1/f noise in DNA base sequences,” Phys.Rev.Lett., vol. 68,
no. 25, pp. 3805–3808, 1992.
[16] W. Li, “The study of correlation structures of DNA sequences:
a critical review,” Computers & Chemistry, vol. 21, no. 4, pp.
257–271, 1997.
[17] W. Li and K. Kaneko, “Long-range correlation and partial
1/f
α
spectrum in a non-coding DNA sequence,” Europhys.
Lett., vol. 17, no. 7, pp. 655–660, 1992.
[18] D. R. Forsdyke and J . R. Mortimer , “Chargaff ’s legacy, ” Gene,
vol. 261, no. 1, pp. 127–137, 2000.
[19] W. Li, “The study of correlation structures of DNA sequences:
a critical review,” Computers & Chemistry, vol. 21, no. 4, pp.
257–272, 1997.
[20] J. W. Fickett, D. C. Torney, and D. R. Wolf, “Base compo-
sitional structure of genomes,” Genomics,vol.13,no.4,pp.
1056–1064, 1992.
[21] J. E. Dennis and R. B. Schnabel, Numerical Methods for Un-
constrained Optimization and Nonlinear Equations, SIAM,
Philadelphia, Pa, USA, 1996.
Trevor W. Fox received his B.S. and Ph.D.
degrees in electrical eng ineering from the
University of Calgary in 1999 and 2002, re-
spectively. Currently, he is working at the
Intelligent Engines in Calgary, Canada. His
main research interests include digital fil-
ter design, reconfigurable digital signal pro-
cessing, and genomic signal processing.
Alex Carreira received his B.S. and M.S.
degrees in electrical engineering from the
University of Calgary, Canada, in 1999 and
2003, respectively. His main research inter-
ests are digital signal processing with pro-
grammable logic devices, configurable and
reconfigurable computing, and rapid pro-
totyping of systems for programmable logic
devices.