Báo cáo hóa học: " Handwriting: Feature Correlation Analysis for Biometric Hashes" ppt
Bạn đang xem bản rút gọn của tài liệu. Xem và tải ngay bản đầy đủ của tài liệu tại đây (740.43 KB, 17 trang )
EURASIP Journal on Applied Signal Processing 2004:4, 542–558
c 2004 Hindawi Publishing Corporation
Handwriting: Feature Correlation Analysis
for Biometric Hashes
Claus Vielhauer
Multimedia Communications Lab (KOM), Darmstadt University of Technology, 64283 Darmstadt, Germany
Platanista GmbH, 06846 Dessau, Germany
Faculty of Computer Science, Otto-von-Guericke University, 39106 Magdeburg, Germany
Email:
Ralf Steinmetz
Multimedia Communications Lab (KOM), Darmstadt University of Technology, 64283 Darmstadt, Germany
Email:
Received 17 November 2002; Revised 9 September 2003
In the application domain of electronic commerce, biometric authentication can provide one possible solution for the key management problem. Besides server-based approaches, methods of deriving digital keys directly from biometric measures appear to
be advantageous. In this paper, we analyze one of our recently published specific algorithms of this category based on behavioral
biometrics of handwriting, the biometric hash. Our interest is to investigate to which degree each of the underlying feature parameters contributes to the overall intrapersonal stability and interpersonal value space. We will briefly discuss related work in feature
evaluation and introduce a new methodology based on three components: the intrapersonal scatter (deviation), the interpersonal
entropy, and the correlation between both measures. Evaluation of the technique is presented based on two data sets of different
size. The method presented will allow determination of effects of parameterization of the biometric system, estimation of value
space boundaries, and comparison with other feature selection approaches.
Keywords and phrases: biometrics, signature verification, feature evaluation, feature correlation, cryptographic key management,
handwriting, information entropy.
1.
MOTIVATION
Today, a wide spectrum of technologies for user identification and verification exists and a great number of the systems
that have been published are based on long-term research.
The basic concept behind all biometric systems is the idea
to make use of machine-measurable traits to distinguish persons. In order to be adequate for this process, a number of
requirements must be fulfilled by a human trait feature, see
[1]. For our working context, the following four are of main
interest:
(i) uniqueness: the feature must vary to a reasonable extent amongst a wide set of individuals (intervariability);
(ii) constancy (permanence): the feature must vary as little
as possible for each individual (intravariability);
(iii) distribution (universality): the feature must be available for as many potential users as possible;
(iv) measurability (collectability): the feature must be electronically measurable.
Biometric characteristics, which fulfill the above requirements, can be classified in a number of ways, for example,
see [2, 3]. One common approach is to divide into measures,
which are either originating from a physiological or a behavioral trait of subjects, although it has been shown that every
process of capturing biometric measures includes behavioral
components to some extent [2]. In the context of our work
based on handwriting, we use the terminology of passive and
active biometric schemes to clearly point out the aspects of
the user awareness and cooperation.
Active schemes include all schemes taking into account
time-relevant information such as voice and online handwriting recognition, keystroke behavior, and gait analysis.
Such biometric features require a specific action from the
users and thus can only be obtained with their cooperation.
An example for this cooperative approach is the signaturebased user authentication, where the user actively triggers
the verification process by feeding the system with a writing sample. Passive traits like fingerprint and face recognition, hand geometry analysis or iris scan, as well as the offline
Handwriting: Feature Correlation Analysis for Biometric Hashes
analysis of handwriting are based on visible physiological
characteristics, which are retrieved in a time-invariant manner. These biometric features can be obtained from users
without their explicit cooperation, thus allowing identification of persons without their agreement or even knowledge.
A straightforward paradigm for such an enforced verification
is the forensic identification using fingerprints. For potential
applications, this basic difference between active and passive
biometric schemes has a significant consequence, as each application will have different requirements with respect to the
subject’s cooperation. While, for example, in access control
applications, one can expect a high degree in user cooperation as the desire of physical or logical access can be anticipated, this is not necessarily the case in forensic applications,
for example, for proof of identity.
From the perspective of potential applications, online
handwriting as an active biometric scheme appears to be particularly interesting in domains that deal with combined document and user authentication, which today is handled by
electronic signatures. Nowadays, legal and design aspects of
electronic signature infrastructures are clearly defined, for
example, in the European Directive for Electronic Signature [4], and security aspects are handled by cryptographic
techniques. However, there still are problems in the area
of user authentication because electronic signatures make
use of asymmetric cryptographic schemes, requiring management of public and secret (private) keys. Today’s practice of storing private keys of users of electronic signatures
on chip cards protected by personal identification number
(PIN) has a systematic weakness. The underlying access control mechanism is based on possession and knowledge, both
of which can be transferred to other individuals with or without the holder’s intension. Making use of biometrics for key
management can fill this security gap. A straightforward approach is to protect the private key by performing biometric user verification prior to release from the secured environment, for example, a smart card [5]. This approach is
based on a biometric verification with a binary result set
(verified or not verified) as a decision to control access. A
physically secure location is still required for the sensitive
data.
In this paper, we will present a feature analysis strategy
for examination of a biometric system based on online handwriting analysis with a specific system response category, the
biometric hash, which has recently been published [6]. The
biometric hash is a mathematical fingerprint based on a set
of preselected statistical features of the handwritten sample
of an individual, which can directly be used for key generation, avoiding the problem of secure storage. Our evaluation strategy for this system is based on three statistical measures:
(a) intrapersonal stability reflecting the degree of scatter
within each individual feature;
(b) interpersonal entropy of hash value components as a result of the biometric hash algorithm. This value is an
indicator for the potential information density of each
feature component;
543
(c) feature stability and entropy correlation to analyze the
dependency between measure (a) and (b) with respect
the contribution of each feature parameter to the entire biometric hash.
These three measures are evaluated to analyze the given biometric hash algorithm at a specific operation point, where
the contribution of our work is twofold. Firstly, we aim to
conceptually prove the concept of biometric hash generation
by analyzing the relevance of information carried by each individual feature. Secondly, we present a new feature analysis based on correlation of deviation and entropy along with
evaluation results for this method. While typically in feature
selection problems, the aim is to reduce the complexity of a
given problem by separating features that carry no or little information, there is no requirement for dimension reduction
for the evaluated algorithm due to its low complexity. Our
aim is to find quantitative terms for the share of the resulting
value space for each of the feature components, which can be
used as a basis for an estimation of the achievable value space.
We will present a strategy for systematic, quantitative analysis of feature relevance for generating a biometric hash value
and briefly discuss a limited set of related work in the area of
feature analysis and feature selection with respect to this specific biometric application. Further, we will discuss the problem of correlation and entropy of the feature space within
the scope of biometric hashes for several semantic classes for
handwriting. We will present results of evaluations of the biometric hash using the method presented, which are based on
two different test databases. For the first database with limited size, details will be presented and the discussion will be
summarized into a feature significance classification. In order to validate the findings of the initial evaluation, the results are reviewed based on results of a second, extended test
containing writing samples from a large database consisting
of several thousand signatures.
The paper is structured as follows. In Section 2, we will
give an introduction to feature evaluation and a discussion of
the selected work in this domain followed by a discussion on
the distinction of handwriting in several domains like handwriting recognition, forensic writer identification, or signature verification in Section 3. Section 4 will briefly describe
the state of the art of biometric hash systems and introduce
our system concept of biometric hashes based on handwriting. In Section 5, we present an analysis scheme towards intrapersonal deviation of feature values, including test results
from our experiments. From the same test database, the information entropy as a measure for the achievable hash value
space on an interpersonal scope is introduced and the results
are presented in Section 6. Based on the findings in Sections
5 and 6, a correlation analysis is performed in Section 7, including a relevance classification of the features examined. As
the initial test data set is too small to justify significant conclusions, Section 8 presents findings of applying this feature
analysis method based on an extended data set and compares
them with results from the initial test. Finally, we will conclude our work in Section 9 and summarize our contribution
and future activities.
544
2.
EURASIP Journal on Applied Signal Processing
INTRODUCTION AND RELATED WORK
The task of automated biometric user authentication requires the analysis and comparison of individually stored reference measures against features from an actual test input.
Storage of reference templates is a machine learning problem,
which requires the determination of adequate feature sets for
classification. Feature evaluation or selection describing the
process of identifying the most relevant features for a classification task is a research area of broad application. Today, we
find a great spectrum of activities and publications in this
area. From this variety, we have selected those approaches
that appear to show the most relevant basics and are most
closely related to our work discussed in the paper.1
In an early work on feature evaluation techniques, which
has been presented almost three decades ago, Kittler has discussed methods of feature selection in two categories: measurement and transformed space [7]. It has been shown
that methods of the second category are computationally
simple, while theoretically, measurement-based approaches
lead to superior selection results, but at the time of publication, these methods were computationally too complex to
be practically applied to real-world classification problems.
In a more recent work, the hypothesis that feature selection
for supervised classification tasks can be accomplished on
the basis of correlation-based filter selection (CFS) has been
explored [8]. Evaluation on twelve natural and six artificial
database domains has shown that this selection method increases the classification accuracy of a reduced feature set in
many cases and outperforms comparative feature selection
algorithms. However, none of the domains in this test set is
based on biometric measures related to natural handwriting
data. Principal component analysis (PCA) is one of the common approaches for the selection of features, but it has been
observed that, for example, data sets having identical variances in each direction are not well represented [9]. Chi and
Yan presented an evaluation approach based on an adopted
entropy feature measure which has been applied to a large
set of handwritten images of numerals [10]. This work has
shown good results in the detection of relevant features compared to other selection methods. With respect to the feature
analysis for the biometric hash algorithm, it is required to
analyze the trade-off between intrapersonal variability of feature measures and the value space, which can be achieved by
the resulting hash vectors over a large set of persons. Therefore, we have chosen to evaluate not only the entropy for each
feature, but also the degree of intrapersonal variability of feature values. Our evaluation strategy presented in this work is
based on application-specific entropy which is determined
from the response of the biometric hash function and intrapersonal deviations of feature parameters as measures for
scatter. An overview of the algorithm and the initial feature
1 An exhaustive discussion of the huge number of approaches that have
been published in the subject is beyond the scope of this paper. Therefore the
authors have decided to refer to a very limited number of references which
appear to be of significant relevance for the purpose of evaluating the specific
technique discussed in this paper.
set as presented in the original publication will be given in
Section 4.
3.
DISTINCTION OF HANDWRITING
Three main categories of handwriting-based biometric approaches can be identified: handwriting recognition, forensic
verification, and user authentication. Handwriting recognition denotes the process of automatic retrieval of the ground
truth of a handwritten document; it can also be considered
as a specialization of optical character recognition (OCR).
Here, a wide variety of approaches based on offline and online analysis have been suggested. A comprehensive overview
of the state of the art in handwriting recognition can be
found in [11]. Determination of the identity of the writer
is not the primary aim in handwriting recognition, thus in
this category, systems make use of individual writing characteristics in order to improve the overall recognition accuracy. In this kind of systems, user-specific templates are
generated during a training phase in order to store information about the writing style along with the writing semantic.
Based on this information, handwriting systems can be designed in a way that a writer can be identified while writing
arbitrary text. This idea was taken over by researches at a very
early point in time [12]. While in handwriting recognition,
the primary purpose of storing user-specific templates is the
improvement of recognition rates, forensic applications use
sets of writing samples of known origin in order to compare
them with a handwritten document written by an unknown
or suspected person. The aim typically is to find evidence on
the originator of a handwritten document in court cases. Expert testimonies-based methods to analyze the individuality
of handwriting are generally accepted at court since many
decades, for example, since 1923 in the United States, and
research towards an automated writer verification system is
still an actual topic. For example, a quantitative assessment
of the discriminatory power of handwriting was performed
in [13]. By nature of forensic applications, the verification
does not require the approval or even knowledge of writers. In handwriting verification systems however, users enroll to the system with the intention of a later approval of authenticity within a secured scenario. Typically, handwritingbased biometric verification and identification systems use
one specific semantic class: signatures. Signature as proof of
authenticity is a socially well-accepted transaction, especially
for legal document management and financial transactions.
The individual signature serves five main functions [14]: not
only authenticity and identity functions, which can be provided by any of the biometric schemes, but also finalization,
evidence, and warning functions, which are unique to the
signature. Furthermore, handwriting allows the use of additional semantic classes to the signature. Publications on
the use of writing semantics like pass phrases or symbols in
handwriting verification systems can be found in [15, 16].
For the overall security, this combination of knowledge and
traits shows advantages compared to the signature. Firstly,
the image of a signature is a public feature which is available to everyone holding a hardcopy of a signed document.
Handwriting: Feature Correlation Analysis for Biometric Hashes
This simplifies attacks by a potential forger, especially on
time-invariant features. Secondly, additional semantics can
be used to register several different references for one user,
allowing the design of challenge-response systems. Another
aspect is the possibility to change the content of the reference
sample, which is important in case a biometric feature gets
compromised.
Handwriting verification systems typically operate in two
different modes. In the verification mode, the system is fed
with a pretended identity and a writing sample and the response is either a positive or negative match. Identification
only requires a writing sample input and the system will either output the most likely identity or a mismatch. Besides
these two typical modes, biometric hashes denote an additional class of system responses. The following section will
introduce this category of biometric systems.
4.
BIOMETRIC HASHES
Information exchange over public networks like the Internet implies a wide number of security requirements. Many
of these security demands can be satisfied by cryptographic
techniques which generally are based on digital keys. Here,
we find two constellations of keys: keys for symmetric systems, where all participants of the secret communication
share the same secret key, and public keys, which consist of
pairs of a secret key (private) and a publicly available key.
While systems of the first category are typically designed for
efficient cipher systems, the second type is used mainly in
digital signatures or protocols to securely exchange secret session keys. In either category, we have the requirement to protect the keys from unauthorized access. As cryptographically
strong keys are rather large, and it is certainly not feasible to
let users memorize their personal keys. As a consequence of
this, in real-world scenarios today, digital keys are typically
stored on smart cards protected by a special kind of password, the PIN. However, there are problems with PIN; for
example, they may be lost, passed on to other persons accidentally or purposely, or they may be reverse-engineered by
brute force attacks.
These difficulties in using passcode-based storage of
cryptographic keys motivate the use of biometric authentication for key management which is based on human traits
rather than knowledge. Various methods to apply biometrics
to solve key management problems have been presented in
the past [17]:
(i) secure server systems which release the key upon successful verification of the biometric features of the
owner;
(ii) embedding of the digital key within the biometric reference data by a trusted algorithm, for example, bitreplacement;
(iii) combination of digital key and biometric image into a
so-called Bioscrypt TM in such a way that neither information can be retrieved independently of the other;
(iv) derivation of the digital key directly from a biometric
image or feature.
545
There are problems with all of these approaches. In the first
scenario, a secured environment is required for the server
and further, all communication channels need to be secured,
which is not possible in all application scenarios. Embedding
secret information in a publicly available data set like in the
second suggestion will allow an attacker to retrieve secret information for all users once the algorithm is known. The
idea of linking both digital key and biometric feature into
a BioscryptTM can result in a good protection of both data
sets, but it is rather demanding regarding the infrastructure
required. Approaches of the fourth category face problems
due to the fact that biometric features typically show a high
degree of intrapersonal variability due to natural and physiological reasons. A key that is composed directly from the
biometric feature values might not show stability over a large
set of verifications. Secondly, if the derivation of the key is
based on passive traits like the fingerprint, the key is lost for
all times, once compromised.
To overcome the problems of the approaches of the last
category, it is desirable to derive a robust key value directly
from an active biometric trait, which includes an expression
of intention by the user. A voice-based approach for such a
system can be found in [18], where cryptographic keys are
generated from spoken telephone number sequences. As for
all biometric techniques based on voice, there is a security
problem in reply attacks, which can easily be performed by
audio recording. For key generation based on handwriting,
we have presented a new biometric hash function in [6]. By
making use of handwriting, an active, behavioral trait, and
additional semantic classes like pass phrases and PINs, the
system allows to change the biometric reference in case it
would get compromised. Instead of providing a positive or a
negative verification result, the biometric hash is a vector of
ordinal values unique to one individual person within a set
of registered users. Originally, the new concept of biometric
hash has been presented where the hash vector was calculated by statistical analysis of 24 online and offline features
of a handwriting sample. Continuative research has lead to a
system implementation based on 50 features, as presented in
Section 4.1. A brief description of the algorithm will be given
in Sections 4.2 and 4.3.
4.1.
System overview
The initial prototype system is implemented on a Palm
Vx handheld computer equipped with 8 MB RAM and a
MC68EZ328 CPU at a clock rate of 20 MHz. The built-in
digitizer has a resolution of 160 × 160 pixels at 16 gray scales
and provides binary pen-up/pen-down pen pressure information. Although it is widely observed that writing features
based on pressure can show a great significance for writer
verification, we limit our system to one-bit pen-up/pendown signals. This is due to the fact that our superior work
context is aimed towards device-independence, and a wide
number of digitizer devices do not support pressure signal
resolutions above one bit.
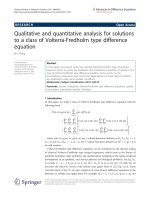
Figure 1 illustrates the process of the biometric hash calculation. In the data acquisition phase, the pen position
546
EURASIP Journal on Applied Signal Processing
Interval: ILow , . . . , IHigh
Interval
matrix (IM)
x(t)
y(t)
p0|1 (t)
x/ y
Normalization
(time variant)
Data
aquisition
Offset (Ω)
50
parameter
Feature
extraction
Interval
length ∆I
Interval
mapping
.
.
.
i
0, . . . , IInitHigh + t ∗ ∆IInit
i
if IInitLow − ti∗ ∆IInit ≤0,
(3)
h50
Hash
vector
Figure 1: Process of the biometric hash calculation.
signals x(t)/ y(t) and the binary pressure signal p0|1 (t) are
recorded from the input device. These signals are then made
available for the feature extraction both in a normalized
(x/ y normalization for determination of time variant features) and an unfiltered signal. After feature extraction of
50 statistical parameters, these are mapped to the biometric
hash by the interval mapping process, making use of a userspecific interval matrix (IM). The IM is determined during
enrollment, and the algorithm for this will be presented in
Section 4.3.
which is, for each of the j features, an initial interval
[IInitLow , . . . , IInitHigh ] with an initial interval length ∆IInit is
determined. Then the effective interval [ILow , . . . , IHigh ] is defined by the initial interval, with the left boundary IInitLow reduced by ti∗ ∆IInit (or 0, if the term becomes negative) and the
right boundary IInitHigh increased by ti∗ ∆IInit .
The parameter-specific tolerance factor ti is introduced to
compensate for the intravariability of each feature parameter.
Factor values for ti are dependent on the number of samples
per enrollment N and have been estimated in separate intrapersonal variability tests as described in Section 5. Table 2
presents values for ti which have been estimated for each of
the parameters ni based on an enrollment size of N = 6.
All feature parameters are of nonnegative integer type
and test values will be rounded accordingly. Thus the effective interval length ∆Ii can be written as
∆Ii = IHigh + 0.5 − ILow − 0.5 = IHigh − ILow + 1,
4.2. Feature parameters
The proceeding of obtaining a hash vector by interval mapping requires the utilization of a fixed number of scalar feature values, which are computed by statistical analysis of the
sampled physical signals. A comprehensive overview of relevant features used in publications on signature verification
can be found in [19, 20]. Due to the resource and hardware limitations on a PDA platform like the one used in
our project, we have based our initial research on biometric
hash on 24 statistical features, which have been extended for
the work presented in this paper to 50 parameters shown in
Table 1. To satisfy the need to have a fixed number of components, these features are either based on a global analysis of
signals or on partitioning to a fixed number of subsets, which
was chosen intuitively.
4.3. Interval matrix determination
The IM is a matrix with a dimension of K × 2, where K denotes the number of feature components that is taken into
account, as listed in Table 1. Each of the i ∈ [1, . . . , K] twodimensional vector components consists of an interval length
∆Ii and an offset value Ωi . The interval length and offset values are determined for each user during an enrollment process consisting of j ∈ [1, . . . , N] writing samples for each
of the nonnegative feature parameters ni, j in the following
min/max strategy:
(4)
whereas the interval offset value Ωi is defined as
Ωi = ILow MOD ∆II .
(5)
Thus, the IM can be written as follows:
∆I1 , Ω1
∆I2 , Ω2
.
IM =
.
.
.
(6)
∆IK , ΩK
4.4.
Hash value computation
The hash value computation is based on a mapping of each
of the feature parameters of a test sample to an integer value
scale. Due to the nature of the determination of the interval
matrix, all possible values v1 and v2 within the extended interval [ILow , . . . , IHigh ] for each of the i ∈ [1, . . . , K] features
ni within IM, as defined in the previous Section 4.3, fulfill the
following condition:
v1 − Ωi
∆Ii
=
v2 − Ωi
∆Ii
∀v1 , v2 ∈ ILow , . . . , IHigh ,
v1 − Ωi
∆Ii
=
v2 − Ωi
∆Ii
∀v1 , v2 ∈ ILow , . . . , IHigh .
/
(7)
Initial interval: IInitLow , . . . , IInitHigh
= MIN ni, j , . . . , MAX ni, j
=
h1
IInitLow − ti∗ ∆IInit , . . . , IInitHigh + ti∗ ∆IInit
if IInitLow − t ∗ ∆IInit > 0,
;
Initial interval length: ∆IInit = IInitHigh − IInitLow ;
(1)
(2)
That is, all given v1 and v2 within the extended interval lead
to identical integer quotients, whereas values below or above
the interval border lead to different integer values. Thus, we
Handwriting: Feature Correlation Analysis for Biometric Hashes
547
Table 1: Feature parameters for the biometric hash calculation.
Parameter name
Index
Param.
Description
Segment count
Duration
Sample count
Maximum count
Aspect ratio
Pen-up pen-down ratio
X-integral
Y -integral
X-velocity
Y -velocity
X-acceleration
Y -acceleration
X-distribution velocity
Y -distribution velocity
Segmented x-areas
Segmented y-areas
Path length
Delta X
Delta Y
Effective average speed
Pixel count 12-segment
Cumulated integral error x
Cumulated integral error y
Integral error sign x
Integral error sign y
Cumulated radiant
Average radiant
Cumulated distance
Average distance
Average x-position
Average y-position
1
2
3
4
5
6
7
8
9
10
11
12
13
14
15–19
20–24
25
26
27
28
29–40
41
42
43
44
45
46
47
48
49
50
n1
n2
n3
n4
n5
n6
n7
n8
n9
n10
n11
n12
n13
n14
n15 –n19
n20 –n24
n25
n26
n27
n28
n29 –n40
n41
n42
n43
n44
n45
n46
n47
n48
n49
n50
Number of pen-down events
Total writing duration in ms
Total number of samples
Sum of local maximum in x- and y-signals
x/ y ratio of the writing image times 1000
Ratio of total pen-up and total pen-down times multiplied by 1000
Total area covered by the absolute x-signal
Total area covered by the absolute y-signal
Average absolute writing velocity in x-direction
Average absolute writing velocity in y-direction
Average absolute writing acceleration in x-direction
Average absolute writing acceleration in y-direction
Maximum x-distribution Max(x) − Min(x) over total writing time
Maximum y-distribution Max(y) − Min(y) over total writing time
x-integral of 5 segments of equal length TTotal /5
y-integral of 5 segments of equal length TTotal /5
Total path length of writing trace in pixel
Total horizontal image expansion
Total vertical image expansion
Ratio of total writing path length and total writing time
Number of pixels in each 4 by 3 sector
Sum of absolute x-differences between discrete integration rectangle versus trapeze
Sum of absolute y-differences between discrete integration rectangle versus trapeze
Effective sign of feature 41
Effective sign of feature 42
Radiant of cumulated x/ y from upper left corner of image
Average radiant of all x/ y sample points from upper left corner of image
Distance t of cumulated x/ y from upper left corner of image
Average distance of all x/ y sample points from upper left corner of image
Average of all x-sample values
Average of all y-sample values
write the hash function h for each feature parameter fi of a
test sample as follows:
h fi , ∆Ii , Ωi =
f i − Ωi
∆Ii
.
(8)
Thus, the resulting hash vector consists of K components of
integer values.
5.
INTRAPERSONAL SCATTER: FEATURE DEVIATION
One major problem in using biometric features to directly
derive hash values is the trade-off between natural intrapersonal variability of feature values between several samples
of an individual user and the requirement to have a persistent value in the biometric hash. A trivial example for this
dilemma is the total writing time of a signature. This feature
is very straightforward to calculate and, therefore, very often
used in verification systems with limited resources like digital
signal processor chips [21]. Amongst first-order features, it
shows a rather stable intrapersonal behavior. If, for example,
a natural intrapersonal variance of 5% is observed, the average signature duration of a subject is 5 seconds; all duration
values in [4.75, . . . , 5.25] seconds should be acceptable to authenticate this particular feature. Depending on the sampling
rate of the digitizer device used for the signature capture, this
can lead to a great number of acceptable discrete values, a
sampling rate of 10 milliseconds would lead to 51 possible
values that would lead to a positive result. Thus in order to
achieve stable hash values, all features must be mapped into
a value space, using, for example, an interval-mapping algorithm, as described in Section 4. The evaluation of intrapersonal deviations of features was performed by measuring
the average deviations between enrollment and test sets of
enrollments for a given test database, and details of the test
procedure are given below.
548
EURASIP Journal on Applied Signal Processing
Table 2: Tolerance values estimation for N = 6.
Parameter name
ti (%)
ni
Segment count
Duration
Sample count
Maximum count
Aspect ratio
Pen-up pen-down ratio
X-integral
Y -integral
X-velocity
Y -velocity
X-acceleration
Y -acceleration
X-distribution velocity
Y -distribution velocity
Segmented x-area 1
Segmented x-area 2
Segmented x-area 3
Segmented x-area 4
Segmented x-area 5
Segmented y-area 1
Segmented y-area 2
Segmented y-area 3
Segmented y-area 4
Segmented y-area 5
Path length
Delta X
Delta Y
Effective average speed
Pixel count segment 1/12
Pixel count segment 2/12
Pixel count segment 3/12
Pixel count segment 4/12
Pixel count segment 5/12
Pixel count segment 6/12
Pixel count segment 7/12
Pixel count segment 8/12
Pixel count segment 9/12
Pixel count segment 10/12
Pixel count segment 11/12
Pixel count segment 12/12
Cumulated integral error x
Cumulated integral error y
Integral error sign x
Integral error sign y
Cumulated radiant
Average radiant
Cumulated distance
Average distance
Average x-position
Average y-position
565
1400
590
715
635
625
645
505
625
780
545
585
685
765
1800
1085
595
860
1010
1060
1030
820
760
635
655
630
710
750
1065
565
1060
470
460
1070
495
565
320
825
760
690
615
340
0
0
495
395
840
1010
915
1045
n1
n2
n3
n4
n5
n6
n7
n8
n9
n10
n11
n12
n13
n14
n15
n16
n17
n18
n19
n20
n21
n22
n23
n24
n25
n26
n27
n28
n29
n30
n31
n32
n33
n34
n35
n36
n37
n38
n39
n40
n41
n42
n43
n44
n45
n46
n47
n48
n49
n50
Handwriting: Feature Correlation Analysis for Biometric Hashes
549
400
350
300
Deviation (%)
250
200
150
100
0
n43
n44
n29
n30
n40
n5
n20
n23
n8
n15
n42
n27
n32
n35
n3
n37
n38
n22
n46
n1
n33
n39
n21
n36
n45
n14
n12
n9
n31
n18
n17
n10
n11
n24
n50
n28
n41
n4
n26
n13
n6
n25
n7
n47
n48
n16
n49
n34
n2
n19
50
Feature
Figure 2: Sorted histogram of average deviation di in feature values of signatures with e = 6 in initial test.
This initial test was based on 10 users with 10 writing
samples of 5 semantic classes. All users are familiar with computer devices and the writing samples were collected during 2
enrollment sessions, where the second recording session was
at least two weeks after the first. As mentioned in the motivation, additional evaluations based on extended databases are
described in Section 8 and will be concluded with a comparison of test results.
Our tests for evaluation of the intravariability have been
performed separately for the following 5 different semantic
classes:
(i) signature;
(ii) fixed PIN (all users were asked to write the same PIN
8710);
(iii) arbitrary pass phrase (user may choose any combination of words/numbers);
(iv) the German word Sauerstogefă ò for all users;
a
(v) arbitrary specific symbol (the user may use a short
sketch of his choice).
The tests have been performed based on all 10 users for each
feature and each semantic class according to the following
instructions:
(1) for each of the semantic classes s ∈ [signature, PIN, pass
phrase, fixed word, and user-defined symbol],
(a) for each of the g ∈ [1, . . . , 10] users ug and for each
of the i ∈ [1, . . . , 50] features ni ,
(i) divide each set of 10 samples into all possible
combinations of e enrollment samples and 10 − e
test samples;
(b) for each of the e enrollments and each of the 10 − e
tests, calculate the following deviation:
(i) determine minimum and maximum enrollment
values veMin and veMax from all e samples;
(ii) determine average enrollment value µe = veMin +
(veMax − veMin )/2;
(iii) determine minimum and maximum values tMin
and tMax from the actual test sample;
(iv) calculate maximum relative deviation de from average enrollment value µe :
de = MAX
µe − tMin
µe − tMax
,
µe − veMin
µe − veMax
;
(9)
(v) average de of all enrollments of all users and semantic class s into average feature deviation di,s .
Figure 2 presents the histogram for the averaged deviations
for each of the features numbers i of this test for an enrollment size of e = 6 samples and the semantic signature.
The two features n43 and n44 (integration error sign for
x and y signals) resulted in a feature value of 0 for all tests,
thus the relative deviation cannot be determined. We observe
a relatively strong increase in deviations between feature n15
and n42 . Further, the gradient significantly increases for all
features right of n17 . In order to determine particularly low
550
EURASIP Journal on Applied Signal Processing
and high variance features, we classify features of the first
category into low, the second into high, and all remaining
into medium intravariance. We get the classification of low
intravariance and high intravariance features in Table 3 and
Table 4, respectively.
There are two interesting observations. The three features
with the lowest intravariability are in the same feature category as n34 , being amongst the three features with the highest
variability. All these features are calculated by calculating the
number of pixels of the writing trace in segmented images,
which are obtained by dividing the signature image into 4 × 3
equal-sized images according to Figure 3.
While the two upper, leftmost areas show a high stability,
the pixel count in area 6 is varying strongly. The other interesting observation is the ranking and n25 (trace path length)
and n2 (total writing duration). Both features are time- or
sequence-variant and are commonly known as rather reliable features for verification. Apparently these features are
not significantly stable in the biometric hash generation and
furthermore, it is interesting to see that in amongst the 8 parameters of the low-variability class, only one online feature
(n8 , Y -Integral) can be found. An explanation for this observation can be the global nature of features, which is a prerequisite for the calculation of the biometric hash as described
in Section 4. Furthermore, the observation that segmented
features in the upper left areas show a lower intrapersonal
variance can be explained by the natural left-to-right writing
orientation in Latin handwriting.
6.
FEATURE ENTROPY
In Section 5, we have discussed aspects of intrapersonal variability of biometric features based on handwriting. Intrapersonal variability can be interpreted as a measure of instability
of a feature parameter. For biometric systems, feature stability is a fundamental requirement; therefore, relevant features
should show a low intrapersonal deviation. Besides the stability, the individuality of features needs to be ensured. For
the evaluation of individually, we present an entropy analysis in this section. Both characteristics together will then be
combined into an indicator for the suitability of a particular
feature for the biometric hash in the Section 7.
Information entropy had been introduced by Shannon
more than half a century ago [22, 23], and is a measure for
the information density within a set of values with known
occurrence probabilities. Knowledge of the information entropy is the basis for design of several efficient data coding
and compression techniques like the Huffman code [24] as
it describes the effective amount of information contained
in a finite set. This question of effective information content
is directly related to the uniqueness of a biometric feature,
which motivated the authors to perform an entropy analysis
for each feature of the biometric hash.
In the biometric hash scenario as described in Section 4,
the interpersonal variability has a direct impact on the hash
value space. For features with a low interpersonal variability, it can be expected that many users will have similar or
Table 3: Features showing a low intravariability for N = 6 with the
semantic class being signature.
Feature
Description
n29
n30
n40
n5
n20
n23
n8
n15
Pixel count 12-segment (1/12)
Pixel count 12-segment (2/12)
Pixel count 12-segment (12/12)
Aspect ratio
Segmented y-area 1/5
Segmented y-area 4/5
Y -integral
Segmented x-area 1/5
Deviation (%)
32
51.9
60.4
61.5
64.2
64.6
67.9
68.7
Table 4: Features showing a high intrapersonal variability for N =
6 with the semantic class being signature.
Feature
Description
n10
n11
n24
n50
n28
n41
n4
n26
n13
n6
n25
n7
n47
n48
n16
n49
n34
n2
n19
Y -velocity
X-acceleration
Segmented y-area 5
Average y-position
Effective average speed
Cumulated integral error x
Maximum count
Delta X
X-distribution velocity
Pen-up pen-down ratio
Path length
X-integral
Cumulated distance
Average distance
Segmented x-area 2/5
Average x-position
Pixel Count 12-segment 6/12
Duration
Segmented x-area 5/5
Deviation (%)
153.2
163.3
171.8
179.2
180.9
182.1
193.1
204.6
206
215.7
219.1
230.2
238.2
256.9
269.7
293.3
295.2
306.2
368.8
1
2
3
4
5
6
7
8
9
10
11
12
Figure 3: Segmentation of the writing image into 12 equal-sized
areas.
identical hash values, whereas a high interpersonal variability
indicates a large potential value space. Consequently, we consider the feature entropy of responses of the biometric hash
function as a measure to which degree the potential value
space of the hashing function is actually occupied by realworld hash values. Our aim is to estimate to which extend
Handwriting: Feature Correlation Analysis for Biometric Hashes
551
100%
90%
80%
70%
H(ni )
60%
50%
40%
30%
20%
0%
n1
n2
n3
n4
n5
n6
n7
n8
n9
n10
n11
n12
n13
n14
n15
n16
n17
n18
n19
n20
n21
n22
n23
n24
n25
n26
n27
n28
n29
n30
n31
n32
n33
n34
n35
n36
n37
n38
n39
n40
n41
n42
n43
n44
n45
n46
n47
n48
n49
n50
10%
Feature
Figure 4: Feature entropy of initial test relative to H(n1 ) = 1.93 with the semantic being signature.
each biometric feature is capable of representing individual
values to build the biometric hash. For this estimation, we
apply the general formula to determine the entropy H of a
system X consisting of k ∈ [1, . . . , n] states with a respective
occurrence probability of pk , in our context, each of the n
states represents the occurrence of value vk in the response
of the biometric hash system, being one of the unique values
that have been observed over all T test passes for each feature.
Thus the occurrence probability for feature value vk writes to
pk = count(vk )/T and the feature entropy can be written to:
n
H(X) = −
pk · log2 pk .
(10)
k=1
In this part of our analysis, we are mainly interested in a
global quantitative comparison of information capacity of
each of the features, as described in Section 4. In order to do
so, the interpersonal feature entropy for the same test set as
described in Section 5 has been determined. For a classification, all entropy values have been normalized to the highest
entropy occurrence, which was found for feature n1 with an
entropy of H(n1 ) = 1.93.
Figure 4 shows the result of the entropy test, and it visualizes the information content. For a number of features,
the hash value was the same for all users in all verification
tests. These cases lead to an entropy of zero, thus n15 through
n24 , n28 through n40 , and n42 are zero and do not contribute any user-specific information in the biometric hash
scenario. Amongst the remaining nonzero entropy features,
five show entropy significantly higher than 50%; these are
n1 , n3 , n26 , n45 , and n46 . The remaining features show relatively low entropy in the range between 7% and slightly above
30%. The clear boundary above 50% motivates our classification into high-entropy (greater than 50%), low-entropy
(greater than 0%, equal to 50%), and zero-entropy features.
Thus in summary, the entropy test resulted in 5 relevant,
high-entropy, 20 low-entropy, and 25 zero-entropy features.
7.
FEATURE STABILITY AND ENTROPY CORRELATION
In Sections 6 and 7, we have presented two feature evaluation measures for biometric hashes: intrapersonal deviation
as a term of instability and intrapersonal entropy as a measurement for information density. In order to have a quantitative measure for the trade-off between deviation and stability, we introduce the feature correlation Ci as the product
between the relative feature stability Si and the feature entropy Hi = H(ni ) for one specific semantic class as per the
description of the entropy test in Section 6 as follows:
Si = 1 − di / MAX di , i ∈ [1, . . . , K] ,
(11)
where di denotes average feature deviation (see Section 5),
Ci = Si · Hi | i ∈ [1, . . . , K].
(12)
The correlation between feature stability and entropy is a
measure for the relevance of individual features in the biometric hash generation because it is a numerical valuation of
the uniqueness and constancy that is required for adequate
biometric features as pointed out in Section 1. With a total
552
EURASIP Journal on Applied Signal Processing
1
0.9
0.8
0.7
Correlation
0.6
0.5
0.4
0.3
0.2
0
n1
n2
n3
n4
n5
n6
n7
n8
n9
n10
n11
n12
n13
n14
n15
n16
n17
n18
n19
n20
n21
n22
n23
n24
n25
n26
n27
n28
n29
n30
n31
n32
n33
n34
n35
n36
n37
n38
n39
n40
n41
n42
n43
n44
n45
n46
n47
n48
n49
n50
0.1
Feature
Figure 5: Feature stability and entropy correlation.
number of K = 50 features for our tests and di being the average deviation for feature number i as per the feature variance
test in Section 5, Si is normalized to the maximum feature deviation, thus can have values in the range of [0, . . . , 1], which
is also the case for the feature entropy Hi . By calculating the
product of both numbers, we receive the feature correlation
values Ci as shown in the histogram of Figure 5.
In order to determine suitable features for the biometric
hash, we classify features according to their significance according to the following scheme:
(i)
(ii)
(iii)
(iv)
no significance: CI = 0,
low significance: 0 < Ci < 0.25,
medium significance: 0.25 ≤ Ci < 0.5,
high significance: 0.5 = CI .
The classification summary in Table 5 displays that there is a
clear threshold between the 7 features with high and medium
significance (n1 , n3 , n46 , n45 , n44 , n43 , n26 ) and the best feature
in the low-significance class n9 . This leads us to the conclusion that these features are most suitable amongst the 50
tested for our application of biometric hashes. All 7 features
are based on time variant information; however, only n3, the
sample count, has a linear relation to the writing signal. All
other features are second order, based on combined temporal
and spatial information.
8.
EVALUATION ON EXTENDED DATA SETS
Although the initial evaluation presented in the previous sections confirms the feasibility of feature evaluation in principle, the underlying initial data set is too small to justify signif-
icant conclusions. Furthermore, during the initial test, where
both signal capturing and data processing were performed
on a computationally slow handheld computer, it has turned
out that tests on larger data sets could not be performed in
reasonable time. Therefore, methods for the biometric hash
have been migrated to a PC platform using Object Pascal,
and additional tests have been performed on reasonably performant Windows 2000 PC (1.7 GHz, 512 MB RAM).
Data sets used for these extended tests are subsets from a
handwriting verification database, which has been collected
in an educational environment over a period of three years,
containing 5829 signatures from 60 writers obtained from
various digitizer tablet devices, as can be seen from Table 6.
The only limitation compared to the initial test set from
Section 5 is the number of features that has been implemented on the new platform, which at the time of publication were 36 of the originally 50-dimensional feature set
presented in Table 1. The remaining feature set (see Table 7)
was considered to be reasonable to evaluate, particularly as
for some of the missing features from the original set, it can
be assumed that they are highly correlated (e.g., n26 and n27
with n5, n28 with n9 and n10) as they are linearly dependent due to the nature of their determination. Additionally,
with the extended database, we have the advantage of a first
hardware independent analysis of the algorithm, as sample
features originating from various different digitizer devices
are included.
Based on this extended data set, samples were taken from
all devices shown in Table 7 while the evaluation methodology was chosen identically to the initial approach described
in Sections 5, 6, and 7 with the following adoptions:
Handwriting: Feature Correlation Analysis for Biometric Hashes
553
Table 5: Feature significance classification.
Significance high
Significance medium Significance low Significance 0 Feature number
X
X
X
X
X
X
X
X
X
X
X
X
X
X
X
X
X
X
X
X
X
X
X
X
X
X
X
X
X
X
X
X
X
X
X
X
X
X
X
X
X
X
X
X
X
X
X
X
X
X
n1
n3
n46
n45
n44
n43
n26
n9
n7
n6
n50
n5
n49
n48
n47
n41
n4
n27
n25
n2
n14
n13
n12
n11
n10
n8
n15
n16
n17
n18
n19
n20
n21
n22
n23
n24
n28
n29
n30
n31
n32
n33
n34
n35
n36
n37
n38
n39
n40
n42
Correlation
Description
0.67462039
0.501734511
0.499881971
0.440496027
0.274043819
0.314424886
0.286563794
0.078190808
0.027517839
0.030396689
0.03764345
0.061011774
0.025678147
0.038058075
0.051751071
0.03706768
0.080758321
0.148098756
0.068807745
0.012428692
0.046557959
0.074828997
0.125008667
0.040800259
0.085432856
0
0
0
0
0
0
0
0
0
0
0
0
0
0
0
0
0
0
0
0
0
0
0
0
0
Segment count
Sample count
Average radiant
Cumulated radiant
Integral error sign y
Integral error sign x
Delta X
X-velocity
X-integral
Pen-up pen-down ratio
Average y-position
Aspect ratio
Average x-position
Average distance
Cumulated distance
Cumulated integral error x
Maximum count
Delta Y
Path length
Duration
Y -distribution velocity
X-distribution velocity
Y -acceleration
X-acceleration
Y -velocity
Y -integral
Segmented x-area 1
Segmented x-area 2
Segmented x-area 3
Segmented x-area 4
Segmented x-area 5
Segmented y-area 1
Segmented y-area 2
Segmented y-area 3
Segmented y-area 4
Segmented y-area 5
Effective average speed
Pixel count segment 1/12
Pixel count segment 2/12
Pixel count segment 3/12
Pixel count segment 4/12
Pixel count segment 5/12
Pixel count segment 6/12
Pixel count segment 7/12
Pixel count segment 8/12
Pixel count segment 9/12
Pixel count segment 10/12
Pixel count segment 11/12
Pixel count segment 12/12
Cumulated integral error y
554
EURASIP Journal on Applied Signal Processing
Table 6: Test set size of the extended database by tablet type.
Tablet name
Aiptek Hyperpen 8000
Palm Vx
EIZO Flexscan Touchscreen 18
Wacom 1 serial
Wacom Cintiq 15
Wacom Intuos 2
Wacom Intuos 2 Inkpen
Wacom 1 USB
Wacom Valito
Count (signatures)
9
447
1118
621
1284
547
31
971
801
Table 7: Feature parameters evaluated from the extended test set.
Parameter name
Segment count
Duration
Sample count
Aspect ratio
Pen-up pen-down ratio
X-integral
Y -integral
X-velocity
Y -velocity
X-distribution velocity
Y -distribution velocity
Segmented x-areas
Segmented y-areas
Path length
Pixel count 12-segment
Average x position
Average y position
Index
1
2
3
5
6
7
8
9
10
13
14
15–19
20–24
25
29–40
49
50
Param.
n1
n2
n3
n5
n6
n7
n8
n9
n10
n13
n14
n15 –n19
n20 –n24
n25
n29 –n40
n49
n50
(i) semantic class (s ∈ [signature]);
(ii) number of users is g ∈ [1, . . . , 54];
(iii) the selection of samples was implemented by drawing
10 sets of e = 6 enrollment samples and 10 − e = 4 test
samples minus for each user ug and each tablet type
from the database in a pseudorandom manner.
Due to the large number of samples for some users in the extended database, disallowing an exhaustive evaluation of all
enrollment/test set pairs, the approach of pseudorandom selection was chosen to reasonably limit the number of trials.
Results of deviation and entropy analysis of the extended test
are presented in Figures 6a, 6b. Furthermore, Figure 7 visualizes the comparison of correlation between feature entropy
and deviation between the initial tests as per Figure 5 and the
results of the extended database in ascending order for the
later factors.
Correlation factors from the extended test show a statistical characteristics with a means value of µExtended = 0.175
and standard deviation of sExtended = 0.133 as compared to
Description
Number of pen-down events
Total writing duration in ms
Total number of samples
x/ y ratio of the writing image times 1000
Ratio of total pen-up and total pen-down times multiplied by 1000
Total area covered by the absolute x signal
Total area covered by the absolute y signal
Average absolute writing velocity in x direction
Average absolute writing velocity in y direction
Maximum x-distribution Max(x) − Min(x) over total writing time
Maximum y-distribution Max(y) − Min(y) over total writing time
x-integral of 5 segments of equal length TTotal /5
y-integral of 5 segments of equal length TTotal /5
Total path length of writing trace in pixel
Number of pixels in each 4 by 3 sector
Average of all x sample values
Average of all y sample values
the initial correlation factor distribution with µInitial = 0.048
and sExtended = 0.137 for the feature set evaluated in the extended test. This indicates an overall increase of significance
of the values (note that the standard deviation has changed
insignificantly) over a set of several digitizer devices and using signature as writing semantics. Furthermore, it can be
observed that amongst the five features showing the highest
correlation in the extended data set (n43 , n3 , n5 , n32 , n1 ), all
except n5 have been classified as high or medium significant
in Section 7. A plausible explanation for n5 (representing the
aspect ratio) being more stable in the extended tests is that
as compared to the initial test, only signature samples were
taken into account, showing a higher stability in image layout as compared to semantics written with a lower degree
of routine. Another interesting observation is the ranking of
the correlation of segmented pixel count features n31 = 0.32
and n32 = 0.44, which are both well noticeable above the
standard deviation in the distribution of the extended test,
while both features resulted in a correlation value of 0 in the
initial test.
Handwriting: Feature Correlation Analysis for Biometric Hashes
555
400
350
300
Deviation (%)
250
200
150
100
n38
n37
n30
n33
n34
n36
n29
n39
n31
n40
n35
n8
n19
n2
n22
n3
n14
n32
n7
n24
n16
n17
n20
n9
n13
n25
n15
n21
n5
n23
n49
0
n1
n10
n50
n6
n18
50
Feature
(a)
100%
90%
80%
70%
H(ni )
60%
50%
40%
30%
20%
n33
n34
n35
n36
n37
n38
n39
n40
n49
n50
n19
n20
n21
n22
n23
n24
n25
n29
n30
n31
n32
n17
n18
n7
n8
n9
n10
n13
n14
n15
n16
0%
n1
n2
n3
n5
n6
10%
Feature
(b)
Figure 6: Sorted feature deviation histogram and relative entropy determined from extended test database. (a) Feature value deviations
extended test. (b) Relative feature entropy of initial test based on H(n19) = 3, 61.
556
EURASIP Journal on Applied Signal Processing
1
0.9
0.8
Correlation Ci
0.7
0.6
0.5
0.4
0.3
0.2
n9
n2
n23
n50
n31
n49
n3
n5
n32
n1
n14
n35
n10
n6
n30
n24
n25
n13
0
n37
n38
n29
n22
n40
n36
n8
n7
n19
n17
n34
n20
n39
n18
n21
n16
n15
n33
0.1
Feature
All tablets
Palm
Figure 7: Comparison between stability-entropy correlation of initial and extended databases.
9.
CONCLUSION AND FUTURE WORK
In this article, we have presented a new method to evaluate a given biometric authentication algorithm, the biometric
hash, by analyzing the features taken into account. We have
presented test results from two different data sets of quite
different size and origin and introduced three measures for
feature evaluation: intrapersonal feature deviation, interpersonal entropy of hash value components, and the correlation
between both. Based on this basic idea, we resulted in an initial perception that on a very specific device, a PDA, 7 out of
50 investigated features can be classified as high or medium
significant.
As the first results indicated the suitability of our approach, we have performed tests on a significantly extended
database in order to get more general and statistically more
relevant conclusions. Three main conclusions can be derived
from the second test:
(i) with a few exceptions, all of the features showing high
significance in the initial test have been reconfirmed;
(ii) entropy of hash values increases over a large set of different tablets as compared to the PDA device; all features have shown nonzero entropy in the extended test;
(iii) feature scattering appears to be rather high on PDA devices as compared to the average over the set of various
tablets.
The evaluation data set presented in this work is the largest
data set used for a feature analysis of dynamic handwriting
based on signature and other semantic classes that could be
found in the literature. In [16], a number of 10 different semantic classes for writer verification has been suggested and
tested with 20 different users; however, this work limits observations on results in terms of false acceptance rate (FAR)
and false rejection rate (FRR) and does not analyze variability within feature classes. Due to the total size of our tests,
we consider our findings as statistically significant, opening
many areas for future work, where we plan to concentrate on
three main aspects: algorithm optimization, additional tests
including feature benchmarking, and applications.
Our main working direction will aim to optimize the biometric hashing technique under operational conditions for
specific applications, including boundary estimates for the
theoretically achievable key space and the extension of feature candidate sets. Also, it will be necessary to perform detailed quantitative analysis of additional semantic classes. Especially the classes of pass phrases and numeric codes are of
great interest, as they will allow design of applications including user authentication based on knowledge and being.
There is also room for improvement in the interval-matching
algorithm. The tolerance value introduced in (3) is estimated based on statistical tests over all users and all semantic classes. Here, we are working on adoptive, user-specific
Handwriting: Feature Correlation Analysis for Biometric Hashes
tolerance value determination rather than a global estimation. Although there is no security threat the IM, as it does
not allow reverse-engineering of the full biometric template,
there still is the problem of enrollment and storing this information for each user individually. To overcome this potential objective for real-world applications, we are working
towards mechanisms to determine a biometric hash without
any a priori parameters based on the individual.
Based on the introduced three statistical measures, it is
also interesting from the discipline of feature selection research to perform feature selection benchmarks by comparing FAR and FRR, based on different feature sets. Here, it will
be necessary to determine competing feature sets based on
the method presented in this paper and a selection of other
published feature evaluation approaches of different nature.
A comparison of verification and recognition results for the
biometric hash algorithm, parameterized with these different
feature sets, will allow conclusions in regard to the impact of
feature selection on recognition accuracy.
REFERENCES
[1] A. Jain, R. Bolle, and S. Pankanti, “Introduction to biometrics,” in Biometrics: Personal Identification in Networked Society, A. Jain, R. Bolle, and S. Pankanti, Eds., vol. 479 of The
Kluwer International Series in Engineering and Computer Science, pp. 1–41, Kluwer Academic Publishers, Boston, Mass,
USA, January 1999.
[2] J. L. Wayman, “Fundamentals of biometric authentication
technologies,” International Journal of Image and Graphics,
vol. 1, no. 1, pp. 93–113, 2001.
[3] D. D. Zhang, Automated Biometrics: Technologies and Systems,
vol. 7 of The Kluwer International Series on Asian Studies in
Computer and Information Science, Kluwer Academic Publishers, Boston, Mass, USA, 2000.
[4] Directive 1999/93/EC of the European parliament and of the
council of 13 December 1999, />repository/legal-directive-20000119.html.
[5] B. Struif, “Use of biometrics for user verification in electronic
signature smartcards,” in Smart Card Programming and Security (Proc. International Conference on Research in Smart Cards
(e-smart ’01)), I. Attali and T. Jensen, Eds., vol. 2140 of Lecture Notes in Computer Science, pp. 220–227, Cannes, France,
September 2001.
[6] C. Vielhauer, R. Steinmetz, and A. Mayerhă fer, Biometric
o
hash based on statistical features of online signatures,” in Proc.
16th International Conference on Pattern Recognition (ICPR
’02), vol. 1, pp. 123–126, Quebec City, Quebec, Canada, August 2002.
[7] J. Kittler, “Mathematical methods of feature selection in pattern recognition,” International Journal of Man-Machine Studies, vol. 7, no. 5, pp. 609–637, 1975.
[8] M. A. Hall, Correlation-based feature selection for machine
learning, Ph.D. thesis, Department of Computer Science, University of Waikato, Hamilton, New Zealand, 1999.
[9] D. A. Forsyth and J. Ponce, Computer Vision: A Modern Approach, Prentice-Hall, Englewood Cliffs, NJ, USA, 2003.
[10] Z. Chi and H. Yan, “Feature evaluation and selection based
on an entropy measurement with data clustering,” Optical
Engineering, vol. 34, no. 12, pp. 3514–3519, 1995.
[11] R. Plamondon and S. N. Srihari, “On-line and off-line handwriting recognition: a comprehensive survey,” IEEE Trans. on
557
[12]
[13]
[14]
[15]
[16]
[17]
[18]
[19]
[20]
[21]
[22]
[23]
[24]
Pattern Analysis and Machine Intelligence, vol. 22, no. 1, pp.
63–84, 2000.
F. Maarse, L. Schomaker, and H.-L. Teulings, “Automatic
identification of writers,” in Human-Computer Interaction:
Psychonomic Aspects, G. van der Veer and G. Mulder, Eds., pp.
353–360, Springer-Verlag, New York, NY, USA, October 1988.
S. Lee, S.-H. Cha, and S. N. Srihari, “Combining macro and
micro features for writer identification,” in Document Recognition and Retrieval IX, P. B. Koutor, T. Kanungo, and J. Zhou,
Eds., vol. 4670 of Proceedings of SPIE, pp. 155–166, Proceedings SPIE, San Jose, Calif, USA, December 2001.
J. Kaiser, Vertrauensmerkmal unterschriftgestaltungskriterien fă r sichere signierwerkzeuge,” in Informatik 2001—
u
Tagungsband der GI/OCC-Jahrestagung, pp. 500–504, Vienna,
Austria, September 2001.
C. Vielhauer, Handschriftliche authentikation fă r digitale
u
wasserzeichenverfahren, in Sicherheit in Netzen und Medienstrămen, M. Schumacher and R. Steinmetz, Eds., pp. 134–148,
o
Springer-Verlag, Berlin, Germany, September 2000.
Y. Kato, T. Hamanoto, and S. Hangai, “A proposal of writer
verification of hand written objects,” in IEEE International
Conference on Multimedia and Expo (ICME ’02), pp. 585–588,
Lausanne, Switzerland, August 2002.
R. K. Nichols, ICSA Guide to Cryptography, McGraw-Hill,
New York, NY, USA, 1999.
F. Monrose, M. K. Reiter, Q. Li, and S. Wetzel, “Using voice
to generate cryptographic keys,” in Proc. Odyssey, The Speaker
Verification Workshop, Crete, Greece, June 2001.
R. Plamondon and G. Lorette, “Automatic signature verification and writer identification—the state of the art,” Pattern
Recognition, vol. 22, no. 2, pp. 107–131, 1989.
F. Leclerc and R. Plamondon, “Automatic signature verification: the state of the art 1989–1993,” International Journal of
Pattern Recognition and Artificial Intelligence, vol. 8, no. 3, pp.
643–660, 1994.
H. Dullink, B. van Daalen, J. Nijhuis, L. Spaanenburg, and
H. Zuidhof, “Implementing a DSP kernel for online dynamic handwritten signature verification using the TMS320
DSP family,” Tech. Rep. SPRA304, Texas Instruments, EFRIE,
France, 1995.
C. E. Shannon, “A mathematical theory of communication,”
Bell System Technical Journal, vol. 27, no. 3, pp. 379–423, 1948.
C. E. Shannon, “A mathematical theory of communication,”
Bell System Technical Journal, vol. 27, no. 4, pp. 623–656, 1948.
M. Nelson and J.-L. Gailly, The Data Compression Book, M&T
Books, New York, NY, USA, 1995.
Claus Vielhauer is an Assistant Researcher
at Otto-von-Guericke University of Magdeburg, Germany, where he has joined the department of Computer Science in 2003 as
the Leader of the biometrics research group
as part of the Advanced Multimedia and Security Lab (AMSL). In addition, he is working for the Multimedia Communications
Lab (KOM) of Technical University Darmstadt, Germany, since 1999, where he also
received his M.S. degree in electrical engineering. His research interests are in biometrics with specialization in handwriting recognition and quality evaluation. His main activities are concentrated
on the algorithm design for hardware-independent signature verification systems and key management for PKI using biometrics.
He has a great number of international publications in the area of
558
signature verification and biometric test criteria. Furthermore, he
is a member of technical program committees of international conferences of great importance to biometrics (ICME, ICBA) and has
been organizing and cochairing a number of special sessions on
biometrics (ICME, SPIE). Additionally, since 2000, he is the Managing Director of Platanista GmbH, a spinoff company focusing on
IT security.
Ralf Steinmetz worked for over nine years
in industrial research and development of
distributed multimedia systems and applications. Since 1996, he has been the head
of the Multimedia Communications Lab at
Darmstadt University of Technology, Germany. From 1997 to 2001, he directed the
Fraunhofer (former GMD) Integrated Publishing Systems Institute (IPSI) in Darmstadt. In 1999, he founded the Hessian Telemedia Technology Competence Center (httc e.V.). His thematic focus in research and teaching is on multimedia communications
with his vision of real “seamless multimedia communications.”
With over 200 refereed publications he has become ICCC Governor in 1999 and he was awarded the ranking of Fellow of both the
IEEE in 1999 and ACM in 2002.
EURASIP Journal on Applied Signal Processing