Coca-Cola Company Financial Statement 2009-2012
Bạn đang xem bản rút gọn của tài liệu. Xem và tải ngay bản đầy đủ của tài liệu tại đây (1.35 MB, 48 trang )
MINISTRY OF EDUCATION AND TRAINING
HOA SEN UNIVERSITY
FACULTY OF ECONOMIC AND COMMERCE
o0o
PROJECT
Subject: Financial Statement Analysis
COCA-COLA COMPANY
FINANCIAL
STATEMENT 2009 - 2012
Lecturer : Đặng Thị Thu Hằng
Class : TC302DE01 - 0100
Group : 01
Group members : 1. Phạm Nguyên Quỳnh Thi 2002386
2. Bùi Cảnh Vinh 2001796
3. Lý Gia Thạnh 070901
August 2013
LECTURER COMMENTS
………………………………………………………………………………
………………………………………………………………………………
………………………………………………………………………………
………………………………………………………………………………
………………………………………………………………………………
………………………………………………………………………………
………………………………………………………………………………
………………………………………………………………………………
………………………………………………………………………………
………………………………………………………………………………
………………………………………………………………………….……
………………………………………………………………………………
………………………………………………………………………………
………………………………………………………………………………
………………………………………………………………………………
………………………………………………………………………………
………………………………….……………………………………………
………………………………………………………………………………
………………………………………………………………………………
………………………………………………………………………………
………………………………………………………………………………
………………………………………………………………………….……
………………………………………………………………………………
………………………………………………………………………………
………………………………………………………………………………
………………………………………………………………………………
………………………………………………………………………………
………………………………….……………………………………………
………………………………………………………………………………
………………………………………………………………………………
………………………………………………………………………………
ABSTRACT
Those days, financial statement analysis is becoming more and more important in
economic cycle. Although each of financial reporting firms has a different statement.
Therefore, in this research, we would like to analyze the financial statement of Coca-Cola
Company - the world’s leading soft drink maker – during four years 2009 - 2012. Then,
we would like to conclude and give opinions about limitations and unsolved problems
regarding to this subject.
THANKFULNESS
We highly appreciate our dedicated teachers at Hoa Sen University, especially Ms. Đặng
Thị Thu Hằng, who has assisted us in doing this project. Furthermore, we also thank our
classmates for their kindness in helping us deal with difficulties.
We cannot avoid mistakes due to lacking of experiences, so we hope to get your honest
advices for us to improve better.
PREFACE
In our report, we would like to mention to analyze the financial statement of The Coca-
Cola company during 2009 to 2012. Every aspect is a purpose we want to impart to you:
First purpose: Introduction of Coca-Cola Company
Second purpose: Steps to analyze the performances.
Third purpose: Conclusion and suggestion of our group
The project was conducted by three members with following distribution of work:
Name
Assignment
Completion
Phạm Nguyên Quỳnh Thi
Complete the power point and
writing report.
Ratios analysis
100%
Bùi Cảnh Vinh
Income statement analysis
Cash flow analysis
100%
Lý Gia Thạnh
Introduction
Balance sheet analysis
100%
7
TABLE OF CONTENTS
LECTURER COMMENTS 3
ABSTRACT 4
THANKFULNESS 5
PREFACE 6
TABLE OF CONTENTS 7
CONTENTS 9
1. Introduction to Coca-Cola 9
1.1 Brief Introduction 9
1.2 Mission and Objectives 11
1.2.1 Mission 11
1.2.2 Vision 11
1.3 Past and Present 12
1.4 Products and Competency 15
2. Balance sheet 17
3. Income statement 18
3.1 Reasons for change in Sales 18
3.2 Reasons for change in Net Income 19
4. Cash flow statement 19
4.1 Operating cash flow 20
4.2 Investing cash flow 20
4.3 Financing cash flow 21
5. Ratios analysis 23
5.1 Activity ratios 23
8
5.1.1 Short-term activity ratios 23
5.1.2 Long-term activity ratios 28
5.2 Liquidity analysis 29
5.3 Long-term debt and solvency analysis 32
5.3.1 Capitalization table and debt ratio 32
5.3.2 Interest coverage ratios 33
5.4 Profitability analysis 34
5.5 Dupont system of analysis 37
5.5.1 Two-component disaggregation of ROE 38
5.5.2 Three- component disaggregation of ROE 38
6. Suggestions 39
9
CONTENTS
1. Introduction to Coca-Cola
1.1 Brief Introduction
The Coca-Cola Company (Coca-Cola), the world’s leading soft drink maker, operates
in more than 200 countries and sells 400 brands of nonalcoholic beverages. Coca-
Cola is also the most valuable brand in the world. Coca-Cola is a globally recognized
successful company.
The Coca-Cola was founded in May of 1886 and continues for more than a century
through the times of war and peace, prosperity and depression and economic boom
and bust. As late as the 1990s, Coca-Cola was one of the most respected companies
Picture 1.1: The Coca-Cola logo’s history
Source:
10
in the world, building and known as a very successful management team.
The Coca-Cola Company establishes its firm in the worldwide areas and currently sells its
products to over 200 countries. The firm operations are divided into several geographies which
are Eurasia and Africa, Europe, Latin American, North American and Pacific.
The Coca-Cola Company is a beverage company which produces more than 3000 beverage
products. This Company is also a manufacturer, distributor, bottler, and marketer of non-alcoholic
beverage concentrates and syrups. Under the implementation of the Coca-Cola system, the Coca-
Cola Company has to cooperate with over 300 bottling partners worldwide. The company
manufactures and sells concentrates, beverage bases and syrups to bottling operations, owns the
brands and is responsible for consumer brand marketing initiatives. Our bottling partners
manufacture, package, merchandise and distribute the final branded beverages to our customers
and vending partners, who then sell our products to consumers. The company has 92800
worldwide associates around the world live and work in the market the company serves. In 2009,
The Coca-Cola Company outputted 24.4 billions unit cases products and the sales revenue of The
Coca-Cola Company for the year is 30990 millions. The company produces the products such as
waters, juices and juice drinks, teas, coffees, sports drinks and energy drinks. The company has
four of the world’s top five nonalcoholic sparkling beverage brands which are Coca-Cola, Diet
Picture 1.2: The Coca-Cola bottle’s history
Source:
11
Coke, Sprite and Fanta. Since 1998, the company has been struggling with internal
weaknesses and external threat.
1.2 Mission and Objectives
1.2.1 Mission
Coca-Cola declares the purpose as a company and serves as the standard against
actions and decisions:
To refresh the world…
To inspire moments of optimism and happiness…
To create value and make a difference.
1.2.2 Vision
The vision of Coca-Cola is the framework for their guides of every aspect of its
business. It is presented in 6Ps:
1. People: Be a great place to work where people are inspired to be the best they can
be.
2. Portfolio: Bring to the world a portfolio of quality beverage brands that anticipate
and satisfy people's desires and needs.
3. Partners: Nurture a winning network of customers and suppliers, together we
create mutual, enduring value.
4. Planet: Be a responsible citizen that makes a difference by helping build and
support sustainable communities.
5. Profit: Maximize long-term return to shareowners while being mindful of our
overall responsibilities.
6. Productivity: Be a highly effective, lean and fast-moving organization.
12
1.3 Past and Present
1894 … A modest start for a bold idea
In a candy store in Vicksburg, Mississippi, brisk sales of the new fountain beverage
called Coca-Cola impressed the store's owner, Joseph A. Biedenharn. He began
bottling Coca-Cola to sell, using a common glass bottle called a Hutchinson.
Biedenharn sent a case to Asa Griggs Candler, who owned the Company. Candler
thanked him but took no action. One of his nephews already had urged that Coca-
Cola be bottled, but Candler focused on fountain sales.
1899 … The first bottling agreement
Two young attorneys from Chattanooga, Tennessee believed they could build a
business around bottling Coca-Cola. In a meeting with Candler, Benjamin F. Thomas
and Joseph B. Whitehead obtained exclusive rights to bottle Coca-Cola across most
of the United States (specifically excluding Vicksburg) for the sum of one dollar. A
third Chattanooga lawyer, John T. Lupton, soon joined their venture.
1900-1909 … Rapid growth
The three pioneer bottlers divided the country into territories and sold bottling rights
to local entrepreneurs. Their efforts were boosted by major progress in bottling
technology, which improved efficiency and product quality. By 1909, nearly 400
Coca-Cola bottling plants were operating, most of them family-owned businesses.
Some were open only during hot-weather months when demand was high.
13
1916 … Birth of the contour bottle
Bottlers worried that the straight-sided bottle for Coca-Cola was easily
confused with imitators. A group representing the Company and bottlers asked glass
manufacturers to offer ideas for a distinctive bottle. A design from the Root Glass
Company of Terre Haute, Indiana won enthusiastic approval in 1915 and was
introduced in 1916. The contour bottle became one of the few packages ever granted
trademark status by the U.S. Patent Office. Today, it's one of the most recognized
icons in the world - even in the dark!
1920s … Bottling overtakes fountain sales
As the 1920s dawned, more than 1,000 Coca-Cola bottlers were operating in
the U.S. Their ideas and zeal fueled steady growth. Six-bottle cartons were a huge hit
after their 1923 introduction. A few years later, open-top metal coolers became the
forerunners of automated vending machines. By the end of the 1920s, bottle sales of
Coca-Cola exceeded fountain sales.
1920s and 30s … International expansion
Led by longtime Company leader Robert W. Woodruff, chief executive
officer and chairman of the Board, the Company began a major push to establish
bottling operations outside the U.S. Plants were opened in France, Guatemala,
Honduras, Mexico, Belgium, Italy, Peru, Spain, Australia and South Africa. By the
time World War II began, Coca-Cola was being bottled in 44 countries.
1940s … Post-war growth
During the war, 64 bottling plants were set up around the world to supply the
troops. This followed an urgent request for bottling equipment and materials from
14
General Eisenhower's base in North Africa. Many of these war-time plants were later
converted to civilian use, permanently enlarging the bottling system and accelerating
the growth of the Company's worldwide business.
1950s … Packaging innovations
For the first time, consumers had choices of Coca-Cola package size and type the
traditional 6.5-ounce contour bottle, or larger servings including 10-, 12- and 26-
ounce versions. Cans were also introduced, becoming generally available in 1960.
1960s … New brands introduced
Following Fanta® in the 1950s, Sprite® , Minute Maid® , Fresca® and TaB® joined
brand Coca-Cola in the 1960s. Mr. Pibb® and Mello Yello® were added in the
1970s. The 1980s brought diet Coke® and Cherry Coke® , followed by
POWERADE® and DASANI® in the 1990s. Today hundreds of other brands are
offered to meet consumer preferences in local markets around the world.
1970s and 80s … Consolidation to serve customers
As technology led to a global economy, the retailers who sold Coca-Cola merged and
evolved into international mega-chains. Such customers required a new approach. In
response, many small and medium-size bottlers consolidated to better serve giant
international customers. The Company encouraged and invested in a number of
bottler consolidations to assure that its largest bottling partners would have capacity
to lead the system in working with global retailers.
1990s … New and growing markets
Political and economic changes opened vast markets that were closed or
underdeveloped for decades. After the fall of the Berlin Wall, the Company invested
heavily to build plants in Eastern Europe. And as the century closed, more than $1.5
15
billion was committed to new bottling facilities in Africa.
21st Century …
The Coca-Cola bottling system grew up with roots deeply planted in local communities.
This heritage serves the Company well today as people seek brands that honor local
identity and the distinctiveness of local markets. As was true a century ago, strong locally
based relationships between Coca-Cola bottlers, customers and communities are the
foundation on which the entire business grows.
1.4 Products and Competency
Coca-Cola originated as a soda foundation beverage in 1886 to one of the most popular
beverage over the world due to few main causes:
Adoption of strong bottling system.
Massive levels of penetration and recognition.
Distribution network.
Three businesses, units-sparkling beverages, still beverages and emerging brands will
define Coca-Cola’s focus in the North America market, where it faces stiff competition
from rival PepsiCo and makers of healthier beverages such as juices.
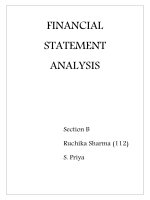
Picture 1.2: Brands of Coca-Cola
Source:
16
Fanta® in the 1950s, Sprite® , Minute Maid® , Fresca® and TaB® joined brand Coca-
Cola in the 1960s. Mr. Pibb® and Mello Yello® were added in the 1970s. The 1980s
brought diet Coke® and Cherry Coke® , followed by POWERADE® and DASANI® in
the 1990s. Today hundreds of other brands are offered to meet consumer preferences in
local markets around the world.
17
2. Balance sheet
As you can see from THE COCA-COLA COMPANY AND SUBSIDIARIES
CONSOLIDATED COMMON SIZE OF BALANCE SHEET. The composition of assets,
liabilities, and shareholders’ equity accounts changed from 2009 to 2012. Notable changes
occurred for intangible assets (26.4% in 2009 versus 31.% in 2012), loans and notes
payable (13.9% in 2009 versus 18.9% in 2012), long-term debt (10.4% in 2009 versus
17.1% in 2012), retained earnings (86.5% in 2009 versus 67.8% in 2012), and treasury
stock (52.2% in 2009 versus 40,6% in 2012).
The first thing we noticed is that Coca-Cola has a nearly identical composition of current
versus noncurrent assets (30/70) by years. However, cash and cash equivalents of Coke’s
assets decreases by years along with marketable securities increases by years. It could
mean that Coke keeps less cash and tranfers it into more marketable securities. Another
thing is the composition of coke’s accounts receivable slightly decreases by years. It
could also mean that Coke has become more aggressive in terms of the conditions by
which it will offer credit to customers.
The next observation is Coca-Cola’s capital structures. Coke’s liabilities over equity has a
split percentage nearly identical by years (40/60). Interestingly, Coke’s short-term debt,
specially, loans and notes payable strongly increase by years. This could just be an
indication that Coke relies more heavily on commercial papers to fund its short term
operations; It could also mean that Coke has a significantly amount of long term debt
increases, and that explain why the shareholder’s equity composition, specially, retained
earning has been greatly decreased by year.
18
3. Income statement
3.1 Reasons for change in Sales
Though the economy has been doing better than it has in the past years, prices for
certain things are still increasing (ex: Higher Education, Health Insurance, etc.) and
the population is far less able and willing to make purchases that are not necessary.
Also, increases in health awareness regarding soft drinks, sugar, etc. may have also
resulted in people being more hesitant to purchase Coca-Cola products due to fear of
health risks and obesity. This
causes a decrease in demand
and therefore a decrease in
sales.
The rate of COGS increases
over the years and the highest
is in 2012, gross profits also
increased over the years, There were 3% increases for both cost of goods sold and net
operating revenues from
20010 to 2011. Over the past
two years the company has
stayed relatively even as far as
profit, costs and revenue. This’s how that the company is stable and still able to make
sales despite the world’s current economic condition but the percentage fell
backwards because the COGS increased more than the profit. Although operating
income increase gradually and the highest in 2012, but percentage of operating
income decreased gradually and the operating of 2012 had increased, in compared
with 2010. Interest expense strongly decreased due to fewer loans and interest rates
higher than a year ago
Income before income taxed are lower than 2010's, because the expense and COGS
of 2011 and 2012 suddenly increased, that lead to the same results on gross profit and
Chart 3.1: Revenue and operating income of CoCa-Cola from
2008 to 2012
Source:
19
after deducting the minority interest (Less: Net income attributable to noncontrolling
interests) was the highest in 2010 and 2012's has increased again after 2011's
decreased.
3.2 Reasons for change in Net Income
Certain factors affecting net
income were high costs for sugar
and aluminum, bad debt, and an
overall weak US economy.
Fortunately, in the recent years
there has been evidence that the
economy is on its way to recovery,
hence why the Net Income in
20012 may have been higher than
the Net Income in 2011. Slowly,
the economy is working more in
favor of the food and beverage
industry which is why Net Income seems to be increasing at Coca-Cola as well as
companies such as Tyson Foods, and Pepsi Co. Fluctuation of foreign currency
exchange rates can affect Sales and Net Income.
Rate of the stock remains relatively positive, but it's still lower than the rate of first
two years, that led to the declining of stock values, although there has been a
breakthrough after 2009 with is the weighting is nearly 200%.
4. Cash flow statement
Total Cash Flow from Operating Activities was the lowest in 2009 (8,186 million) and
the highest in 2012 (10,645 million). Total Cash Flows from Investing Activities was also
the lowest in 2009 (4,149 million) and the highest in 2012 (11,404 million). Total Cash
Flows from Financing Activities was the lowest in 2011 (2,234 million) and the highest
in 2010 (3,465 million). It was according that the net cash flow during the year of 2012
was negative in comparison with past three years was positive. It indicated in 2012 Coca-
Chart 3.2: Revenue and net income of CoCa-Cola from 2008 to
2012
Source:
20
Cola was develing about investment strongly. After looking back over Coca-Cola’s cash
flow history, I found that the numbers for investing and financing activities alternate
every year. For example, in 2009 2010, more money was spent in investing as opposed to
financing. In 2011, more money was spent in financing and less was spent in investing. In
2012, more money was spent in investing activities than financing activities. Judging by
this pattern, they go back and forth
between financing and investing as
their main focus for the year.
4.1 Operating cash flow
As you can see from this
analysis, there was an
approximately 500,000 dollar
increase in the Net Income of this company after decreasing rapidly in 2011 (3
million). This is an 6.25% change from the year before and is a promising sign for the
company. Net Revenues, however,
increased gradually year by year
since 2009(highest is in 2012 not
2010). Although, Coca-Cola is
earning more money per year according to the analysis on Sales, they were able to
increase their expenses for the year (including cost of goods sold) and greatly impact
their net income for each year in order to increase their earnings.
Striking thing here is the expenses and liabilities, taxes payable fell sharply compared
to the previous year but the net income still the highest caused by the sharp change in
amounts earned
4.2 Investing cash flow
The purchase of short-term investments increased sharply but Proceeds from
disposals of short-term investments are equivalent, because investment is not
effective
Chart 4.1: Cash flow statement of CoCa-Cola from 2008 to 2012
Source: />
21
It’s notable that the purchase of other investments increased strongly. Proceeds from
disposals of bottling companies and other investments also increased sharply in 2012,
that lead to investment ratio in 2012 increased by about 6 times in 2011 and increased
3 times compared with 2 years, the main reason is from buying of investors.
4.3 Financing cash flow
In 2012 was also the year's biggest issue debt leading to repayment most.
The issuance of stock fell despite a lot of investment. Besides, the payable dividend
has increased over the years.
The company paid dividend increase steadily for customer. The cash dividends
accounted for more than 50% of the net income. The company has paid over 4.400
million in dividends over each of the past three years. The net income has stayed
relatively the same so this means that the company normally pays about half of their
net income to dividends.
The company pays
dividends so that they
can keep their investors
happy and continue to
be given money by
them.
Net cash provided by
(used in) financing
activities increased and
decreased steadily over
the years.
Only net Cash Flows Year In 2012 is negative, because the strong investment cost so
much compared with 3 years before (so there was no profit). The overall cash flow
for the 2011 year is highest. But it decrease strongly in 2012 (30%). These numbers
Chart 4.2: Cash and cash equivalent of CoCa-Cola
22
show that Coca-Cola’s sales and production has increased in 2012 and also that the
price of these things may have also increased due to the recession. The decrease of
next cash flow from 2011 to 2012 most likely pushed Coca-Cola to invest more, as
you can see from the nearly 4 billion dollar increase in cash from investing activities
from 2011 to 2012.
Loss is also the general problem of subsidiaries. Although there are still many late
cash in liquidation, even flow fell 30% compared to 2011.
In conclusion, in the future, the investment will promote efficiency. IPS 2013/2014
significantly increased because of short-term investments and acquired more investments.
Profit will return in 2013.
5. Ratios analysis
Although reviewing trends and using common-size analysis provides an excellent starting
point for analyzing financial information, managers, investors, and other stakeholders
also use various ratios to assess the financial performance and financial condition of
organizations.
Each ratio is explained the meaning, provided the formula, calculated the ratio for Coca-
Cola for 4 years, and compare some ratios for Coca-Cola to PepsiCo’s ratio and industry
averages
1
.
5.1 Activity ratios
To carry out operations, a firm needs to invest in both short-term and long-term
assets. Activity ratios give the relationship between the firm’s level of operations and
the assets needed to sustain the activity. Activity ratio can also be used to forecast a
firm’s capital requirements.
5.1.1 Short-term activity ratios
1. Inventory turnover
The inventory turnover ratio indicates the efficiency of the firm’s inventory
management. Its benchmark is 6. This ratio for Coca-Cola for 2010 is calculated as
follows:
1
Source: Stock Analysis on Net (www.stock-analysis-on.net)
Copyright © 2012 EBIT Financial Analyses Center
Dec 31, 2012 Dec 31, 2011 Dec 31, 2010 Dec 31, 2009 Trends
ACTIVITY RATIOS
Short-term activity ratios
Inventory turnover 5.837 5.891 4.790 4.710
DOH 63 62 76 77
Receivables turnover 10.090 9.460 7.928 8.246
DOS 36 39 46 44
Working capital turnover 19.153 38.338 11.436 8.091
Payable turnover 24.386 21.428 18.611 21.979
Number of days of payables 15 17 19 16
Long-term activity ratios
Total asset turnover 0.557 0.582 0.482 0.637
Fixed asset turnover 3.317 3.115 2.385 3.241
24
Inventory turnover =
The inventory turnover ratio indicates Coca-Cola sold and restocked inventory 4.79
times during 2010 (substantially lower than PepsiCo’s 8.87 times). This ratio
increased steadily from 2009 to 2012 and is. Coca-Cola’s is well lower the industry
average of 10.105 times. In addition, it is lower than 6 during for year, that means the
Coca-Cola has managed the inventory inefficient. Inventory languishes in warehouse
or on the shelves but not rather “turns over” rapidly as it doesn’t move quickly from
time of acquisition to sale.
2. Days of inventory on hand
The Days of inventory on hand for Coca-Cola for 2010 is calculated as follows:
DOH (Days of inventory on hand) =
~ 76
days
The DOH indicates Coca-Cola sold its inventory in 76 days in 2010 (substantially
higher than PepsiCo’s 35 days), on average. The number of days decreased by 14
days from 2009 to 2012. Coca-Cola is also above the industry average of 49 days.
“Retail grocery stores turn inventory over every 22 days, meaning that shelves are
emptied and restocked about every three weeks. In addition to extremely fast
Dec 31, 2012 Dec 31, 2011 Dec 31, 2010 Dec 31, 2009 Trends
Coca-Cola Co. 5.84 5.89 4.79 4.71
Industry, Consumer Goods 9.77 10.72 10.21 9.72
Inventory Turnover, Comparison to Industry
Dec 31, 2012 Dec 31, 2011 Dec 31, 2010 Dec 31, 2009 Trends
Coca-Cola Co. 63 62 76 77
Days of inventory on hand
25
inventory turnover, retail grocery stores collect credit sales in seven days. Thus it
takes 29 days, on average, to convert freshly stocked inventory to cash.”
2
Therefore, the DOH of Coca-Cola has been considerable higher than the benchmark
of its industry. It is not good. Coca-Cola has taken a long time to hold the inventory
until it is sold.
3. Receivables turnover
The receivables turnover ratio measures the effectiveness of the firm’s credit policies.
This ratio for Coca-Cola for 2010 is calculated as follows:
Receivables turnover =
The receivables turnover ratio indicates Coca-Cola collected receivables 7.93 times
during 2010 (lower than PepsiCo’s 2.64 times). This ratio decreased by 0.32 times
from 2009 to 2012 and rise steadily from 2010 to 2012. Coca-Cola’s is below the
industry average of 9.70 times.
4. Days of sales outstanding
The Days of sales outstanding ratio is typically compared to the company’s credit
terms to evaluate how effectively receivables are being collected. Its benchmark is 12.
This ratio for Coca-Cola for 2010 is calculated as follows:
DOS (Days of sales outstanding) =
~ 46
days
2
Source: Industry averages found at MSN Money, Home Page
Dec 31, 2012 Dec 31, 2011 Dec 31, 2010 Dec 31, 2009 Trends
Coca-Cola Co. 10.09 9.46 7.93 8.25
Industry, Consumer Goods 11.35 12.67 11.57 13.32
Receivables Turnover, Comparison to Industry