Mẫu Writing task 1 Ielts
Bạn đang xem bản rút gọn của tài liệu. Xem và tải ngay bản đầy đủ của tài liệu tại đây (61.2 KB, 3 trang )
WRITING TASK 1:
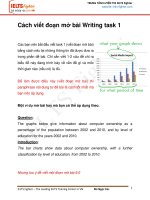
LINE GRAPHS L3
The line graph illustrates how + S + changed over a …-year period, ranging from (year) to (year).
As can be seen from the graph, there was a significant difference between the…
... showed the greatest increase of…, reaching the highest amount in (year), while … had a gradual
rise in…, reaching its highest point in (year).
… and … had similar trends, with both peaking in (year) as well.
From the line graph, … had the highest//most … throughout the period, starting from (data) in
(year) and steadily dropping/rising to (data) in (year).
… and … followed similar trends, with both having fairly constant … from (year) to (year), around
(data) and (data), respectively. Afterward, both … experienced a sharp increase in…, reaching
around (data) and (data), respectively, in (year).
The graph also showed that the... had a remarkable increase, whilst ... had a significant decrease
from (year) to (year).
… showed a sharp increase in…, reaching to (data) in (year).
On the other hand, … showed a dramatic decrease in…, falling to (data) in (year).
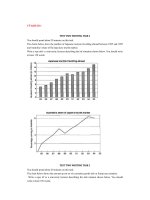
BAR CHARTS L6
The chart illustrates the percentage/ amount/number of …, divided into (number) difference groups/
types:…, over a …-year period from (year) to (year).
As can be seen from the chart, there was a significant difference in the… across + the … groups/
the types/ over the period.
While… had the lowest…, … had the highest….
From the bar chart,... rose steadily from about (data) in (year) to about (data) in (year). Similarly,
… showed a remarkable growth, from only about (data) in (year) to about (data) in (year).
The highest percentage of… was found in the…, with (data). This was followed by the… and…. ,
with both having (data) and (data) respectively.
In contrast, … varied over the period. It started at about (data) in (year) and reached a peak of about
(data) in (year). Afterward, it fell sharply to about (data) in (year), returning to the same as point in
the beginning of the period. Despite this fluctuation, … had the highest… among them.
The lowest percentage of… was observed in the…, with only (data) of… The percentage of…
varied slightly across the … groups, ranging from (data) to (data).
TABLE L11
The table illustrates the percentage/number/figures of… in (place)… The … is divided into ..
(number).. groups/categories:....
As can be seen from the table, there was a significant difference in the… among the..(places)..
… had the highest…, while … had the lowest…
From the table, … showed a remarkable/slight increase in… with (data), which was the
largest/smallest … among all…
Besides, … also increased from (data) in (year) to (data) in (year), afterward decreased to (data) in
(year), which was the only decrease among all…
Additionally, … had the highest … at (data), which was more than double … and…
… and … had similar … at (data) and (data) respectively.
On the other hand, … showed a steady increase/decrease from (data) in (year) to (data) in (year),
which was the second largest increase/decrease among…
Moreover, … showed a gradual increase/decrease from (data) in (year) to (data) in (year), which
was the smallest increase/decrease among…
Finally, … showed a slight increase/decrease from (data) in (year) to (data) in (year), afterward
remained unchanged in (year).
PIE CHARTS AND MULTIPLE CHARTS L17
The charts illustrate the percentage/ amount/number of …, divided into (number) difference groups/
types:…, over a …-year period from (year) to (year)/ in (year).
*These two charts illustrate us the figures of how and where the… , divided into (number)
difference groups/types:…, over a …-year period from (year) to (year)/ in (year).
As can be seen from the charts, the (first) chart showed the proportions of …, whilst the (second)
chart showed the percentages of … While the major proportion/number/amount of…(1st graph)…
was mainly contributed by…, (the ...(2nd graphs)... + had a more balanced distribution + in the/ of…
among the ..(number)… categories. / the main issue for...(2nd graphs)... + was the…)
From the first chart,/ The first chart shows that + the major proportion of… was mainly contributed
by …, which accounted for… of all … In contrast, … and… were the least common/attention …
for… , with only … and … respectively. The other… for … were … and …, with … and …
respectively.
On the other hand, the second chart showed that the main… for … was …, which represented (data)
of all… … was the second most common at (data). This was followed by … and…, with (data) and
(data) respectively. The… that received the least attention were … and …, about (data) and (data)
respectively.
DIAGRAMS L23
The diagram illustrates the process of ..., outlining the various stages involved in this fundamental
production/fix/changing/biological process.
It is clear that there are (number) groups of stages in the production/fix/changing/biological process,
beginning with ... and ending with...
The first group of stages consists of (number) maneuvers/steps that are related to... To begin with,...
Next,...
The next groups of stages are related to... and finish the process. By this stage, ... Afterward,... The
final step/ stage is that...
MAPS L25
The maps + illustrate + how the layout of… (and its surroundings) + changed over a …-year period,
ranging from (year 1) to (year 2).
As can be seen from the maps, … experienced + a remarkable development in terms of
(transportation, lodging, accommodation, and recreational facilities/ facilities and services). Most
noticeably, a new ... and a new... were established to make ... more modernized by (year 2).
One of the most noticeable changes was the… , which was replaced by a new… in the + southeastern corner/ south-western corner/ north-eastern corner/ north-western corner. Meanwhile,
the ... was in the + north/ northeast/ east/ southeast/ south/ southwest/ west/ northwest + side,
which still remained in (year 2). There was ... in the + north/ northeast/ east/ southeast/ south/
southwest/ west/ northwest + side of the…, but it was demolished/ expanded/ narrowed … in
(year 2).
Another noticeable change was the … , which was constructed in the + north/ northeast/ east/
southeast/ south/ southwest/ west/ northwest side of the… . In addition, the... and the... were built
in place of ..., whereas the... remained unchanged. The... was converted into … , which was in the
south-eastern corner/ south-western corner/ north-eastern corner/ north-western corner.