Sample writing task 2 Q3 2023
Bạn đang xem bản rút gọn của tài liệu. Xem và tải ngay bản đầy đủ của tài liệu tại đây (1.45 MB, 53 trang )
SAMPLE TASK 1
Question 1
Actual answer IDP 9998
The bar chart compares how much money five organizations gave to developing nations annually between 2008
and 2011.
Overall, there were distinct trends in the financial support provided by the examined organizations. While
Organization 2 markedly increased its assistance to economically disadvantaged countries, Organization 5 kept
cutting back on its subsidies. The funding allocated by the other organizations fluctuated by varying degrees. It
is also clear that Organization 2 exceeded Organization 3 to claim the first spot for the latter half of the period.
Organizations 2 and 3 were the ones that subsidized developing countries the most throughout the period. In the
first two years, the latter topped the chart, giving $1.5 billion in 2008 and around $1.8 billion in 2009 to less
developed nations. These figures were around $200 million higher than the corresponding numbers for
Organization 2. However, in the latter half of the timeframe, financial aid coming from Organization 2 far
surpassed that from Organization 3, as the former surged to around $2.4 billion in 2010 and further to $2.6
billion at the end. Organization 3, in contrast, had reduced its support to $1.4 billion by 2010, and this was
followed by a slight recovery that brought its number back to its initial level.
It is noticeable that the funding pattern of Organization 5 stood in stark contrast to that of Organization 2.
Initially, Organization 5 allocated roughly $1.2 billion to supporting developing nations. Yet, this figure had
dwindled steeply to only $0.4 billion by 2011, representing a threefold overall decline, which is the most
pronounced change rate in the chart. Regarding Organization 1, at first, it provided the lowest financial
assistance at approximately $0.6 billion. However, shortly thereafter, it overtook Organizations 4 and 5 to claim
the third place, with its aid package soaring to nearly $1 billion in 2009, followed by a slight decline to $0.7
billion at the end.
Finally, except for the year 2008, Organization 4 consistently displayed the lowest figures. Commencing at
$700 million, the amount of money that this organization gave to developing countries had halved by 2009 and
further declined to $250 million by the end of the period, despite a recovery in 2010.
Word count: 363 - Written by Thanh Nguyen
Question 2
The pie charts compare the production of different kinds of energy in France in the years 1995 and 2005.
Overall, there were slight increases in the production of energy coming from coal and natural gas, whereas that
from petrol dwindled significantly. This was a tradeoff for the growing popularity of nuclear and alternative
energy sources. Despite this, France was heavily reliant on fossil fuels in both years surveyed.
Regarding fossil fuels, in 1995, the contributions of coal, gas, and petrol to energy production were almost
even, with each accounting for roughly 30% of the total. By 2005, there had been increases, albeit rather
negligible, in the exploitation of the former two energy sources, whereas petrol's contribution had shrunk by a
third, settling at 19.55%. Despite these changes, the pecking order remained the same: coal led the way, trailed
closely by gas, with petrol taking the third spot.
The decline in dependence on petrol was counterbalanced by significant upticks in energy derived from nuclear
and other, unspecified sources. Specifically, the shares of nuclear and other energies almost doubled, rising
from 6.4% and 4.9% in 1995 to 10.1% and 9.1% in 2005, respectively. Despite showing the most significant
growth rates, they remained minor sources in the country surveyed.
Word count: 206 – Written by Thanh Nguyen
Question 3
The table below shows population figures for four countries for 2003 and projected figures for 2025 and 2050.
Band 8.5 - Graded by Tony Grace
The table provides demographic information about Argentina, Indonesia, Italy, and the Republic of Korea in
2003, as well as predicting how their populations will have changed by 2025 and 2050.
Overall, if predictions are correct, all countries will see their populations increase, with the exception of Italy,
whose numbers will decrease slightly, and Indonesia will remain by far the most populous country throughout.
Looking first at Indonesia and Argentina, the former had the highest population of nearly 240 million in 2003,
whereas that of the latter country was the lowest, at only 34 million. By 2050, according to projections, the
Indonesian population will have reached 312 million; meanwhile, Argentine resident numbers will experience
the greatest growth, doubling to 62 million.
Turning to the other nations, there were 48 million people residing in the Republic of Korea in 2003, and this
country’s population is anticipated to increase to 52 million by 2025 and level off there until 2050. In contrast,
the Italian population is predicted to observe a slight decline, from 54 million in 2003 to 47 million 22 years
later, and this downward trend will likely continue until 2050, at which point this country will reportedly have a
population of 45 million.
Word count: 202 - Written by Thanh Nguyen
Question 4
The table illustrates how many barrels of oil were produced on a daily basis in Nigeria, Chad, Congo, and
Somalia between 2000 and 2004.
Overall, all examined countries witnessed increases in their production, with the exception of Congo, whose
numbers dwindled significantly over the period shown. Notwithstanding this, Congo was generally the largest
oil producer throughout the period, leaving aside the year 2004, which saw Nigeria surpassing Congo to claim
the first spot.
Congo and Nigeria consistently produced significantly higher quantities of oil compared to the other countries.
The former commenced with the highest figure in the whole chart, at 275,000 barrels per day (bpd), while the
latter trailed behind, producing 205,000 bpd. Thereafter, however, Congo’s output embarked on a downward
trend, bottoming out at 203,000 bpd. In contrast, the amount of oil produced in Nigeria, after slight falls
between 2001 and 2002, had increased to 213,000 bdp by 2004.
Turning to the remaining nations, they were consistently the smallest producers, despite registering the most
pronounced growth rates. Specifically, the Somalian oil production expanded tenfold from 5,000 to 50,000 over
the period. The increase observed in Chad was even more significant. Although this country was the only one
to start producing oil in 2003, with a modest 8,000 bpd, its production had rocketed to match Somalia's at
50,000
bpd
by
the
end
of
the
period.
Word count: 225 – Written by Thanh Nguyen
Question 5
The line chart shows average attendance at the cinema among various age groups in the
US from 2000 to 2011.
Band 8.5 - Graded by Tony Grace
The line graph illustrates cinema attendance rates of people in four age brackets in the US
between 2000 and 2011. Overall, all examined age groups showed significant rises in
attendance rates, with 15- to 24-year-olds registering the most pronounced increase, and this
group also had the highest rates throughout.
Looking first at the younger groups, namely the 15-24 and 7-14 ones, the former commenced
with the highest cinema attendance rate of nearly 18%, which was nearly double the figure for
children aged 7 to 14, at 10%. Thereafter, despite slight falls, attendance of the 15-24 age
bracket increased significantly, peaking at nearly 60% in 2010, before ending up at slightly
over 50%. Following a roughly similar upward trend, the proportion of cinemagoers aged
between 7 and 14 had tripled to 30% by 2011, after reaching 2009’s peak of roughly 40%.
Turning to the other older groups, 25-to 35-year-olds, whose initial figure stood at 5%, saw
their rate increase steadily until 2007, from which point it fluctuated mildly and eventually
ended up at the same level as the 7-14 age cohort’s. Finally, going to movie theaters was by
far the least popular among those aged over 35, although by 2011, attendance of this
demographic had risen rapidly to about 15%, up from only 2% in the first year surveyed.
Word count: 218 - Written by Thanh Nguyen
Question 6
The table presents the prevalence of bicycle usage among the population of a particular town in 2011, grouped
by five age brackets.
Overall, females were more inclined to use bicycles than males across all age segments. This difference was
most pronounced in the 10-17 age group. Furthermore, bicycle usage generally declined with age, though an
uptick was observed in the oldest age category.
Looking first at the younger cohorts, children below the age of 9 showed the highest bicycle usage, with just
over half of them riding bicycles. Among those between 10 and 17 years old, the cycling rate for females was
42.2%, which was about double the figure for their male counterparts, at 24.6%.
Turning to the older groups, 17.1% and 12.3% of women aged 18 to 39 and 40 to 59 were reportedly bike
users, outranking men, at only 9.7% and 8%, in that order. Interestingly, for those aged 60 and above, bicycle
usage saw a minor resurgence: 18.5% of women and 13.2% of men in this age category reported cycling.
Word count: 180 - Written by Thanh Nguyen
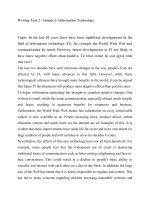
Question 7
The charts below show the number of people in Europe who were affected by four different types of noise by
day and by night in cities and rural areas in 2007.
Band 8.5 - Graded by Tony Grace
The bar charts illustrate how many European people in cities and the countryside were impacted by different
kinds of noise in the daytime and nighttime in 2007.
Overall, noise levels were higher during the day, and city dwellers were more affected compared to their rural
counterparts. It is also reported that traffic was the largest source of noise pollution in both examined types of
location.
Looking first at the two major noise sources, namely traffic and trains, the former affected 64 million city
residents during the day and 48 million at night. The numbers being impacted by this noise in rural areas were
half as high, at 34 million in the daytime and 24 million at night. The disparity between urban and rural
demographics was far smaller in terms of train noise pollution. Specifically, 10 and 8 million people living in
cities were reportedly disturbed by noise from trains in the daytime and at night, respectively, and this was the
case for 8 and 6 million rural inhabitants.
Turning to aircraft and industry, noise from flights was a problem for 4 million individuals in cities and 2
million in the countryside in the day. These numbers fell significantly by night, both to 1 million. Finally,
industrial noise impacted more than 1 million city dwellers in a day, while not affecting anyone in rural
locations.
Word count: 224 - Written by Thanh Nguyen
Question 8
Band 9 - Graded by Tony Grace
The table outlines the average annual income in various sectors for the year 2004, alongside the percentage
change from the previous year, while the pie chart reveals the distribution of graduates across these sectors.
Overall, the public service sector was the most popular sector for graduates and also the best paid, and the
agricultural one paid the least, although it was the second most popular sector. Meanwhile, people in wholesale
and retail trades saw the highest year-on-year pay rise.
Public services topped the income scale in 2004, providing an average annual income of $92,000, which was a
3.7% increase from the previous year. This sector also absorbed the most graduates, constituting 30% of the
total. Conversely, the sector with the lowest income was agriculture, offering an average income of $40,000, a
modest 2.31% increase from 2003. This sector, however, employed a significant 25% of graduates.
The financial sector saw a minimal income increase of 2.9% from 2003, with the average salary being $83,000
in 2004. Despite the high income, this sector accounted for only 5% of the total graduate employment, the
lowest among all sectors. Meanwhile, manufacturing managed to employ 20% of the graduates, despite having
a much lower average income of $52,000 (a 4% increase from 2003).
In the transportation sector, the average worker earned $81,000 in 2004, representing a 4.5% increase in income
compared to 2003. Notwithstanding such a high pay rate, this sector could only attract 10% of the graduates. A
similar graduate employment rate was seen in the wholesale and retail trade sector, which offered an average
income of $77,000, showing by far the highest percentage increase from the previous year at 8.4%.
Word count: 290 - Written by Thanh Nguyen
Question 9
The table illustrates demographic changes across different age cohorts in New Zealand between 2011 and 2012.
Overall, while the total population increased, its composition shifted, with a minor decrease in the younger age
brackets and an expansion in the senior citizen demographic.
The overall population witnessed a slight uptick of 0.6%, increasing from 4,381,269 in 2011 to 4,410,284 in
2012. This general increase, however, did not manifest uniformly across all age groups.
The most significant change was observed in the senior demographic of 65 and older. This age group
experienced noticeable growth of 4%, with its size rising from 573,946 to 596,903. Meanwhile, the cohort of 40
to 64-year-olds mirrored the overall population trend, experiencing a modest increase of 0.6% from 1,331,907
to 1,339,898.
In contrast, the younger segments of the population, characterized by those under 15 and within the 15-39
bracket, registered a mild decline of 0.2% each, with the numbers declining from 898,160 to 896,364 and from
1,577,256 to 1,574,102, respectively.
Word count: 182 - Written by Thanh Nguyen
Question 10
Band 8.5 - Graded by Tony Grace
The table illustrates the proportion of first-year students on three different courses who bestowed a 'very good'
rating on the various resources provided by their college in three different courses.
Overall, while commerce students were mostly pleased with all resources, economics and law students
exhibited more varied approval rates. In particular, teaching and tutor services were generally well-received
across all courses, while other resources garnered more diverse opinions.
Commerce students generally expressed the highest satisfaction across all resources, with the proportions rating
them 'very good' uniformly above 80%. These students found teaching and pre-course information most
impressive, with 95% positive feedback for both. Tutor services were also highly appreciated by 93% of the
students, whereas print and other resources garnered slightly lower, yet still substantial, approval rates at 86%
and 81% respectively.
In contrast, the satisfaction rates among law students were noticeably lower. Their highest appreciation was
shown for 'other resources', at 80%, while the teaching aspect of the course saw the lowest approval, at 62%.
Other aspects, namely pre-course information, tutor services, and print resources were rated 'very good' by
between 70% and 76% of the students.
Economics students, while expressing high satisfaction with teaching and tutor services at 95% and 90%
respectively, demonstrated less enthusiasm for other areas. Pre-course information and other resources were
approved by about 60%, while print resources secured an 81% satisfaction rate.
Word count: 228- Written by Thanh Nguyen
Question 11
The table below shows the percentage of adults in urban and rural areas who took part in four free time
activities in 1990 and 2010.
1990
Reading
2010
Urban
Rural
Urban
Rural
61
71
78
78
Animated play
10
18
10
14
Playing
21
26
14
26
Photography
7
14
17
24
The table compares the participation rates of adults in both urban and rural regions in four recreational
activities in 1990 and 2010.
Overall, a predominant pattern across all activities and both time periods is the consistently higher participation
in rural areas than urban ones, except for reading in 2010, where the percentages were identical. It is also
reported that reading was by far the most popular pastime in both years surveyed.
When examining the reading activity, it is evident that the urban and rural figures converged in 2010, at 78%,
from initial differences of 61% and 71%, respectively. This convergence was a result of a significant increase
in urban readership and a modest growth in rural areas. Meanwhile, the pursuit of photography saw a
substantial increase, as adult participation rates in urban and rural areas increased markedly from 7% to 14%
and from 14% to 24%, in that order.
Regarding the remaining activities, the figure for urban participation in animated play remained at 10%,
whereas its rural counterpart saw a decline from 18% to 14%. Playing - the generally second most preferred
activity, on the other hand, exhibited contrasting trends. Urban participation in this pastime experienced a stark
fall from initially 21% to 14% in 2010, while rural rates stayed unchanged at 26% across both years.
Word count: 215 - Written by Thanh Nguyen
Question 12
The chart below shows the annual rice production in four countries in 1995, 2005, and 2015
The bar chart compares the annual rice production for four different countries - referred to as A, B, C, and D- in
1995, 2005, and 2015.
Overall, the surveyed countries exhibited diverse trajectories of rice production over the period, with Country A
demonstrating a consistent upward trend, Country B fluctuating, and Country C maintaining a relatively stable
output with a slight dip towards the end. Notably, Country D saw the most pronounced growth rate, albeit from
the lowest base.
Over the given timespan, Country A consistently led in rice production, and demonstrated a gradual upward
trend. Commencing at approximately 45 million tons per year (MTPY) in 1995, production of this nation had
slightly increased to 50 MTPY by 2015 (the highest figure in the chart). Country B, on the other hand,
displayed a somewhat erratic pattern. The production rose from initially 35 MTPY to reach parity with Country
A in 2005, producing around 47 MTPY. However, the trend inverted in 2015, as production of Country B
descended to about 42 MTPY.
As opposed to A and B, Countries C and D had far lower rice production. Country C's output was relatively
stable over the period shown, despite a minor increase from about 5 to 7 MTPY between 1995 and 2005, before
eventually reverting to the initial level. Meanwhile, Country D’s production was stagnant at approximately 2
MTPY in 1995 and 2005, but experienced a surge to 5 MTPY by 2015, equalling Country C's output for that
year.
Word count: 234 - Written by Thanh Nguyen
Question 13
The bar chart shows the percentage of adult male smokers in seven countries along with the world average in
2000 and 2015.
The bar chart presents data on the portion of male smokers in seven different countries in the years 2000 and
2015. This is presented alongside the world mean.
Overall, except for Egypt and Lebanon, whose figures increased, the other categories witnessed declines. It is
also reported that among the seven countries given, Armenia had the highest proportions of male smokers in
both
years
given.
There was a 10% decline in male smoking worldwide, dropping from 45% in 2000 to 35% in 2015. However,
this trend was not universal. Egypt and Lebanon, for example, bucked the trend with increases in male smoking
of 10% and 15%, respectively. By 2015, five out of the seven countries analyzed had male smoking rates
higher than the global average, a shift from 2000 when only Armenia, Bangladesh, and Cuba exceeded the
average. Yet, even with the spikes in smoking rates in Egypt and Lebanon, they still lagged behind Armenia
and
Cuba,
where
over
half
the
male
population
smoked.
Most other countries show decreases in smoking, with Bangladesh leading the way with the most significant
drop, falling from 65% to 40%. In contrast, Cuba's decline was the most modest, with a reduction of just around
2%. Both Australia and Mexico experienced roughly a third reduction in their smoking rates, mirroring the
global trend. However, it is worth noting that the percentage of Australian male smokers remained about 15%
below the global average in both years surveyed.
Word count: 241 - Written by Thanh Nguyen
Question 14
The table outlines key details of six global underground train systems, encompassing aspects such as network
size, ticket pricing, and the annual volume of passenger trips.
Overall, every subway system listed accommodates over a billion passengers annually and operates more than
ten lines. Yet, there is a pronounced variance in ticket prices and significant differences in the lengths of the
subway networks across these cities.
Tokyo and Beijing lead the pack in terms of utilization, boasting twice as many annual trips compared to most
other systems. Economically speaking, they are among the more affordable options; only the Mexico City
Metro edges them out in affordability, with a fare of 23 cents – a stark contrast to Paris, where a ride costs
almost ten times as much.
Despite its high ticket price, the Paris metro's infrastructure is relatively compact, spanning just 127.4 miles.
This is a mere fraction compared to New York's expansive 659-mile system. However, Paris surprisingly
operates 16 lines, outpacing most other cities. Meanwhile, the London Underground, with the fewest lines, sees
1.2 billion trips yearly, the lowest ridership of the group. To add to its distinctions, it is also the priciest; a
single ride costs $7.30, nearly three times the fare of New York's subway, which ranks as the second most
costly.
Word count: 216 - Written by Thanh Nguyen
Question 15
The graphic provides insights into visitors entering the UK from abroad. The line graph charts the expenditure
of these visitors in the UK over three decades, while the pie charts detail the reasons people visited in both
1980 and 2010.
Overall, the amount of money that foreign visitors spent whilst in the country increased significantly over the
period surveyed. It is also reported that there was a shift in the reasons for people coming, with the proportions
going for business and visiting friends or relatives increasing at the expense of declines in those visiting for
holiday and other purposes.
From the line graph, it is evident that despite variations throughout the period, there was a general upward
trend, with visitors in 2010 spending over 2 billion more than at the outset. A significant spike occurred in
1996, with visitor spending reaching a high of 12 billion pounds, the most substantial sum within the observed
time frame.
Delving into the reasons behind the visits, vacations were the predominant motivation for travel to the UK.
However, this figure saw a decline of five percent, dropping from 44.1% to 39.1% between the two years
surveyed. The category labeled 'other' also experienced a decrease. In contrast, visits driven by business or to
see friends and family increased, with the former rising from 20.7% to 22.8%, while the latter saw an almost
10% increase, to 28.2% in 2010.
Word count: 238 - Written by Thanh Nguyen
Question 16
The diagram provides a detailed look at the process of recycling glass. Overall, this cyclical process can be
divided into six main stages. We can also see that there is no limit to how many times glass can be recycled and
reused.
Initially, consumers need to segregate used glass bottles from regular household waste, placing them into
dedicated recycling bins. These bins are then picked up by waste collection trucks and transported to a
recycling facility.
At this facility, the initial action involves washing and sterilizing the collected glass using specialized
equipment. After being cleaned and sterilized, the glass undergoes another phase where it is crushed and
subsequently melted. This molten glass is then molded into new glass items using a shaping machine. Once
manufactured, these new glass bottles are ready to be filled and distributed to retail outlets for consumer
purchase. Following use, these bottles can enter the recycling loop once more.
Word count: 153 - Written by Thanh Nguyen
Question 17
The diagram illustrates the process through which uranium is utilized to generate nuclear power.
As is evident from the picture, the procedure encompasses six main stages, from extraction to disposal, with an
option to recycle certain portions of the material rather than committing them to permanent underground
storage.
Initially, uranium is extracted from the earth and then subjected to a series of refinement and conversion
processes. The culmination of this phase is the production of fuel pellets known as U-235. These pellets serve
as the primary fuel source in nuclear power plants. Remarkably efficient, these pellets can sustain energy
production for up to four years before needing replacement. After this duration, there is an opportunity to
reprocess some of the spent pellets for further use.
Nevertheless, not all used pellets are suitable for recycling. Those that are not are securely sealed in specialized
containers and then buried underground for safe disposal.
Word count: 151 - Written by Thanh Nguyen
Question 18
The two diagrams depict the water cycle in both a forested environment and a developed urban area.
Overall, each illustration consists of six stages, beginning with rainfall and concluding with runoff. Both areas
receive an equivalent amount of rainfall. However, urban regions display notably less water evaporation and
ground absorption compared to rural landscapes.
On the surface, it is evident that in forested environments, a larger fraction of the water evaporates from both
the ground and trees compared to urban settings. Conversely, in urban areas, a significant amount of water runs
over the surface, often collecting pollutants as it courses through the city. While the level of erosion is not
displayed in the forested area diagram, this phenomenon increases in cities.
Subterraneously, forests showcase a substantial volume of water seeping through both topsoil and subsoil. In
contrast, urban areas witness less water penetration into the subsoil, resulting in a decreased baseflow.
Consequently, the water table sits noticeably higher beneath woodland regions than beneath metropolitan areas.
Word count: 165 - Written by Thanh Nguyen
Question 19
The two maps depict the development of Lynwich College from 2006 to its present state, highlighting
significant facility expansions, though at the cost of some natural spaces.
At first glance, it is evident that the college has undergone substantial infrastructural development over the
years, leading to a more densely constructed campus. This development, however, has encroached upon the
previously green spaces that existed in 2006. Additionally, there have been notable improvements in
transportation options for students. The car park has been downsized, making room for an expanded bicycle
storage area.
The college's library has been relocated, paving the way for the construction of a cafeteria and a sports center in
its place. This new cafeteria now serves as a central hub, bridging the academic section in the south-west with
the sports facilities in the south-east, and connecting to the improved transportation facilities in the north-east.
Back in 2006, the college seemed to primarily cater to students arriving by car. However, the recent
modifications reveal a shift in this perspective. Apart from the added bicycle area, there is now a designated bus
parking bay situated on the northern edge of the campus, complemented by a new pathway leading into the
college grounds.
Overall, Lynwich College has seen extensive developmental changes over the years, enriching its sports,
dining, and transportation amenities. Interestingly, while these areas have been enhanced, the academic
facilities of the college appear to have been left untouched.
Word count: 238 - Written by Thanh Nguyen
Question 20
The map below shows the development of the village of Ryemouth between 1995 and present.
The diagrams showcase the transformation of a coastal village named Ryemouth since 1995.
Overall, the village has witnessed the rise of new residential houses and apartment complexes, complemented
by improved sports amenities. This expansion, however, has come at the price of green spaces, the local fishing
industry, and agricultural plots, signaling Ryemouth's evolution into a modern, residential hub.
Focusing on the village's northern section, the northwest quadrant has seen the addition of new houses, with
four situated on the left and five on the right. While the central residential square, housing four dwellings,
remains intact, the western road has been extended to accommodate two additional houses. To the right, the
previous agricultural land adjacent to the forest park has been repurposed into a golf course, along with two
tennis courts.
Shifting our attention south from the golf course, a new parking area emerges, placed to the east of an already
existing hotel. Directly across from these establishments and by the beach, the café stands as it did in 1995,
untouched by the wave of development. Moving westward along the beach road, beyond the T-junction, the
original five shops have transitioned into restaurants. Directly across from these dining venues, four modern
apartment buildings have risen, occupying the land where the fish market once stood. The adjacent fishing port