XÂY DỰNG VÀ ỨNG DỤNG THANG ĐO BIẾNG ĂN VÀO NGHIÊN CỨU THỰC TRẠNG BIẾNG ĂN Ở TRẺ EM DƯỚI 5 TUỔI TẠI THÀNH PHỐ HUẾ - Full 10 điểm
Bạn đang xem bản rút gọn của tài liệu. Xem và tải ngay bản đầy đủ của tài liệu tại đây (1.43 MB, 61 trang )
HUE UNIVERSITY
UNIVERSITY OF MEDICINE AND PHARMACY
HOANG THI BACH YEN
DEVELOPING AND APPLYING THE PICKY EATING SCALE
TO STUDY ON PICKY EATING
AMONG CHILDREN UNDER 5 YEARS OF AGE IN HUE CITY
DOCTORAL THESIS SUMMARY
Speciality of Public Health
Code: 9720701
HUE - 2020
This thesis is implemented at:
UNIVERSITY OF MEDICINE AND PHARMACY,
HUE UNIVERSITY
Academic Advisors:
Prof. Le Thi Huong, MD, PhD.
A/Prof. Vo Van Thang, MD, PhD.
Reviewer 1:
Reviewer 1:
Reviewer 1:
Thesis will be defended at Hue University
At: , date month , year
The thesis can be found at:
National Library of Vietnam
Library of University of Medicine and Pharmacy, Hue University
HUE UNIVERSITY
UNIVERSITY OF MEDICINE AND PHARMACY
HOANG THI BACH YEN
DEVELOPING AND APPLYING THE PICKY EATING SCALE
TO STUDY ON PICKY EATING
AMONG CHILDREN UNDER 5 YEARS OF AGE IN HUE CITY
DOCTORAL THESIS SUMMARY
Speciality of Public Health
Code: 9720701
HUE – 2020
INTRODUCTIONS
Picky eating is the consumption of an insufficient amount of food on
demand, resulting in failure-to-thrive. It is a common problem among
children but there is still no single widely accepted definition so far,
therefore there is little consensus on an appropriate assessment measure.
Literature review shows that picky eating is common among
children, ranging from 5.6% to 58.7% in children under 6 years of
age. In Vietnam, there is very little research on this topic. The
prevalence of picky eating were 44.9% among children under 5 years
old at The National Hospital of Pediatrics (Hanoi), 54.58% among
children from 1 to 6 years old and 20.8% among children under 5
years old in Ho Chi Minh City. These studies also used different
methods, no uniform standard as well as no scale has been developed
for assessment of picky eating.
Studies on related factors of picky eating in young children is
limited so far. Some studies showed that picky eating may be
affected by factors such as pressure to eat, feeding practices
(including parental control); social influences; the absence of
exclusive breastfeeding; the introduction of complementary foods
before 6 months and the late introduction of chewy foods.
Vietnam is going through a transition period in nutrition with double
burden of malnutrition and overweight/obesity as well as non-
communicable diseases and micronutrient deficiencies. Due to the
growing of economic, food security is more ensured compared to the
previous period, picky eating has become a popular and more concerned
problem. Having a scale to define picky eating in the Vietnamese
context is essential not only for the child, parents, caregivers but also for
health and educational workers. This study aims to:
1. Develop and test scale for assessment of picky eating for
children under 5 years of age in Hue city.
2. Determine the prevalence and describe characteristics of picky
eating in children under 5 years of age in Hue city in 2017 according
to that scale.
3. Identify some factors related to picky eating.
1
Chapter 1
LITERATURE REVIEW
1.1. CONCEPTION OF PICKY EATING
There are many different concepts about picky eating (PE),
however, no single widely accepted definition. Our study uses the
definition of Lumeng (2005) cited by Ekstein et al (2010): “Picky
eating was defined as an unwillingness to eat familiar foods or to try
new foods, severe enough to interfere with daily routines to an extent
that was problematic to the parent, child, or parent–child relationship”.
1.2. CHILDREN’S PICKY EATING
1.2.1. The common signs of picky eating in children
According to previous studies, PE in young children often have
the following signs:
- Prolonged mealtimes: keeping the food in mouth without
chewing and mealtimes last more than 30 minutes.
- Changing amount of food intake: decreasing the number of
meals or amount of food intake per meal compared to other children
of the same age.
- Limited food diversity
- In coordinate attitudes and behaviors at mealtimes
In addition, there are some other signs such as: sweating when
eating, pretending to be sick or saying to be full to avoid eating,
spraying foods, throwing foods…
1.2.2. Methods for assessment of picky eating
There is currently no consistent definition of PE, so there is no
gold standard, unique criteria for assessment. Previous studies from
all over the world and Vietnam used different methods/criteria for
determining of PE, each of these has its own advantages and
disadvantages. Therefore, developing a scale for assessment of PE is
obviously essential because this is an important issue that can affect
the child's growth.
Reviewing previous studies showed some signs of PE which were
grouped into 3 groups as follows:
1. Time for each meal and eating activities of the child,
including keeping food in mouth without chewing for swalowing,
slow eating and activities of the child when eating.
2
2. Number of meals, diversity and amount of food that the
child consumed per day, including: number of meals, quantity and
quality of food, eating snacks.
3. Emotional or behaviors of the child at mealtime, including:
Being scared, worried, nervous at mealtimes, having opposed and
avoided behaviors…
These are basis elements for developing our scale of PE
assessment in children.
1.3. ASSESSMENT OF THE RELIABILITY OF THE SCALE
AND EXPLORATORY FACTOR ANALYSIS
1.3.1. Assessment of scale reliability
Cronbach‟s Alpha is a measure used to assess the reliability, or
internal consistency, of a set of scale or test items. Cronbach‟s Alpha
ranges from 0 to 1. In theory, Cronbach‟s Alpha is as high as possible
but not greater than 0.95.
By convention, scale items are good if Cronbach‟s is greater than
or equal to 0.8. When Cronbach‟s Alpha ranges from 0.8 to nearly 1,
the measurement scale is good; from 0.65 to nearly 0.8 is useable.
Corrected item - total correlation coefficient must be 0.3 or more.
After testing the scale‟s reliability by Cronbach's Alpha
coefficient, Exploratory Factor Analysis (EFA) will be used to
evaluate the convergence and discriminant values of the scale.
1.3.2. Exploratory Factor Analysis
EFA is a process which can be carried out to validate scales of
items in a questionnaire.
Statistical parameters in Exploratory Factor Analysis are Bartlett‟s
test of sphericity; Correlation matrix; Communality; Eigenvalue;
Factor loadings; Factor matrix; Factor scores; Kaiser-Meyer-Olkin
(KMO) measure of sampling adequacy; Percentage of variance;
Residuals.
Chapter 2
METHODOLOGY
2.1. PARTICIPANTS
Children from 6 - <60 months old living in Hue city and their
caregivers.
2.1.1. Criteria for selection of children
2.1.1.1. Selection of children for cross-sectional study (quantitative)
3
Inclusion criteria
- Children from 6-<60 months old who had been introduced
complementary food and have been living in Hue city for at least one
year.
- Children did not suffer from any chronic disease.
Exclusion criteria
- Children with abnormalities of the mouth such as cleft lip and
cleft palate that might affect their eating ability.
- Children have been identified with developmental disorders:
Down syndrome, mental retardation...
- Children with acute or chronic diseases which was diagnosed by
health workers (with medical records).
2.1.1.2. Selection of children for cross-sectional study (qualitative)
Children had been defined to be picky eaters by PE scale from
quantitative study aboved.
2.1.1.3. Selection of children for case - control study
Selection criteria for picky eating group
Children had been defined to be picky eaters by picky eating scale
from cross-sectional study.
Selection criteria for non-picky eating group
- Children had been defined to be non-picky eaters by picky
eating scale from cross-sectional study
- For each picky eater, we took 2 non-picky eaters of the same
gender, age group and living as the same ward as the picky eaters.
2.1.2. Criteria for selection of caregivers
- The person who was in charge of processing and feeding
children every day. If the caregiver was not father/mother, he/she
must have had at least 1 month for taking care of the child before the
time of study.
- Only one caregiver would be chosen for each child for
participating in all stages of our study.
- Agree to participate.
4
2.2. STUDY METHODOLOGY
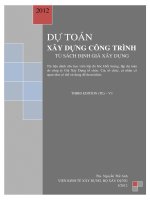
2.2.1. Study design
Phase 1 Phase 2 Phase 3
Develop and test Determine the Describe some
prevalence and describe factors related to
the scale for characteristics of PE
assessment of PE PE
n = 10 Step 1 Step 2 Case-control
observations Cross-sectional Cross-sectional study
n=84 children
study study n = 462
for pilot (quantitative (quantitative 154 picky
n=5 after pilot
method) method) eaters
308 non-
n = 714 n = 10 picky eaters
Estimate the in-depth Identify
prevalence interviews some factors
and describe n = 02 FGDs related to PE
(each FGD had
8 participants)
Explain for
quantitative data
Figure 2.1. Study design
2.2.2. Sample sizes and sampling methods
2.2.2.1. Sample sizes and sampling methods for phase 1
Observation of the child’s meal: Ten children from 18 - <60
months of age (mostly from 24 - <36 months) was selected on
purpose. All of these children were perceived to be picky eaters by
caregivers and was being taken to public places for feeding.
Pilot study for testing the scale: Sample size was selected
according to Bollen 5: 1 (1989) principle: the sample size must be at
least 5 times the number of observed variables. Our scale had 14
questions, corresponding to 14 observed variables, so the minimum
sample size was 14 x 5 = 70 children. In fact, we had chosen 84
children living in 4/27 wards of Hue city (2 wards from the North
and 2 wards from the South of Huong River, including Phu Thuan,
Phu Hau, An Tay, Vi Da). We chose 21 children for each ward.
5
2.2.2.2. Sample sizes and sampling methods for phase 2
- Cross-sectional study
714 children under 5 years old (and 714 caregivers) were enrolled.
The multi-stage sampling method was used as showing in Figure 2.2.
Figure 2.2. Sampling procedure
- Qualitative data
Selecting children who have identified to be picky from cross-
sectional study to collect qualitative data (including 10 in-depth interviews
and 2 FGDs). These data aimed to explain for quantitative results.
2.2.2.3. Sample sizes and sampling methods for phase 3
Estimated required sample size was n = 151.13. We chose all of
PE children from cross-sectional study (154 children) to be case
group and selected 308 non-picky eating children from cross-
sectional study to be control group. For each picky eater, we took 2
non-picky eaters of the same gender, age group and living as the
same ward as the PE children.
2.2.3. Data collecting time
Exploration study was conducted from October to November
2014. Pilot study, cross-sectional and case-control studies were
conducted in 2017.
6
2.2.4. Methods and techniques of data collection
Phase 1: Developing and testing scale for assessment of picky
eating
- Mealtime observation: Observation 10 meals of 10 children
who were perceived to be picky eaters by caregivers. Observations
were conducted once for each child, at the child‟s home or at some
playing places.
For observations at home: Observed a random meal without
warning.
For observations outside the children‟s home: Unparticipated
observation from the beginning until the end of a random meal (lunch
or dinner). The researcher then approached the caregiver to collect
some more information about the child and the caregiver.
- Reviewing data on picky eating in published studies.
Literature searches were made for papers published from 1998 to
2017 using the keywords “bieng an”, “chan an”, “picky eating”,
“picky eaters”, “fussy eating”, “fussy”, “eating behaviors”, “eating
disorders”, “feeding disorders”, “eating difficulties”, “feeding
difficulties”, “infantile anorexia”, “feeding problems”, “food
rejection”… to find definitions of PE and related issue. Some hard
copies of papers also were found. From these searches, 66
international papers and 10 national papers were found.
Based on the results from mealtime observations and literature review,
especially Huynh Van Son „s study in Ho Chi Minh City, we developed
picky eating scale with 14 questions in three components, in which 5
questions for information on length of time for each meal and eating
activities; 5 questions for information on number of meals, diversity and
amount of food that the child consumed per day; and 4 questions for
information on emotional or behaviors of the child at mealtime. Each
question was scored based on the level of feeding difficulty, ranged from 0
to 3 points (the higher scores demonstrated greater picky eating behavior,
0 for the easiest or normal feeding and 3 for the most difficulty feeding).
The scoring from 0 to 3 points based on a previous study implemented in
Vietnamese context by Huynh Van Son et al.
- Pilot study: Direct interviewing the caregivers for testing the
reliability and validity of the scale.
Phase 2: Cross-sectional study
Collecting of quantitative data: Directly interviewing the
7
caregivers about the child's PE situation and food frequency by using
designed questionnaire.
Collecting of qualitative data: Followed by above step, we used
guidelines for in-depth interviews and FGDs.
Phase 3: Case - control study
Using designed questionnaire for direct interviewing the caregivers.
2.3. STATISTICAL ANALYSIS
Using Epidata 3.1 software for entering data and SPSS version 20
software for data analysis.
2.3.1. Testing the scale
Reliability analysis: We calculated Cronbach‟s Alpha for each of
3 groups mentioned above and gradually eliminate inappropriate
variables. Finally, we implemented Cronbach‟s Alpha analysis for
the whole picky eating scale.
Exploratory Factor Analysis (EFA)
KMO and Bartlett‟s test of Sphericity: Exploratory Factor Analysis
is appropriate if 0.5 ≤ KMO ≤ 1. Bartlett‟s test has statistical
significance if sig ≤0.05 means that the observed variables are
correlated with each other in the whole scale.
The Principal Component with Varimax rotation was used for
extraction and would be stopped if Eigenvalue greater than or equal to
1. The scale was accepted if the total variance extracted was equal to or
greater than 50 %.
After eliminating unsuitable variables, we retested Cronbach‟s Alpha
coefficient on the revised scale to ensure the reliability of the scale.
2.3.2. Other variables
Continuous data were reported as mean ± standard deviation;
ordinal data were reported as numbers and percentages. Chi - squared
test (χ2) was used for testing the relationship between two qualitative
variables. Values of p<0.05 were considered statistically significant.
Cohen's Kappa measures the agreement between two methods of
PE assessment (by caregiver's perception and by the PE scale).
Multivariate logistic regression analysis with Forward LR method
were used to find out some factors related to PE.
8
Chapter 3
RESULTS
3.1. DEVELOPING AND TESTING SCALE FOR
ASSESSMENT OF PICKY EATING FOR CHILDREN UNDER
5 YEARS OF AGE
3.1.1. Developing picky eating scale
3.1.1.1. Observation of the child’s meal
Observation 10 meals (8 dinners and 2 lunches) of 10 children (5
boys and 5 girls), the average age was 32 months old.
Observational places were the child‟s home (4 children),
children's house of the city (2 children), the park (2 children),
porridge shop (1 child), along the road (1 child).
The duration for each meal of all the children was from 45 to 90
minutes (64 minutes on average).
The type of food observed were congee porridge, lumpy porridge
(bought from the shop), rice with pork, egg, shrimp ...
The amount of food consumed was about half a cup to a full bowl
in maximum. 8 out of 10 children ate less than recommendation.
Eating activities of the children were very diverse. Most of them kept
food in their mouths without chewing or swallowing, spited food....
Some of them cried, screamed, played or had opposing behaviors such
as not opening the mouth or using hand to cover their mouth.
Results from meal observations showed the most common signs
included prolonged mealtime (from 45 to 90 minutes); feeling
uncomfortable when eating; eating smaller amount than other
children of the same age; retaining food in mouth for a long time
without chewing or swallowing.
3.1.1.2. The initial version of picky eating scale
The initial version of picky eating scale used for validity testing
had 3 components with 14 items as followed:
Table 3.2. Components of the initial scale for assessment of picky eating
Components Items Coding
Time for Retaining food in mouth for a long time without q1811
each meal chewing or swallowing
and eating Duration time for each meal q1812
activities of Activities of the child when eating (watching q1813
the child television, play toys…)
9
Being distracted when eating q1814
Progression of the meal q1815
Number of Number of meals per day q1821
meals, Amount of food consumed per day was less than q1822
diversity his/her peers
and amount Eating snacks (cookies, candies, sweet q1823
of food that beverages…)
the child Selective eating q1824
consumed Food rejection because of specific tastes, smells, q1825
per day textures, appearances or compositions of food
The child was scared, worried or nervous at q1831
mealtimes
Having opposed behaviors such as closing his q1832
Emotional mouth, turning to another way, hitting feeding q1833
or behaviors person, spitting out the food, throw the food
of the child away… at mealtimes
Having avoided behaviors such as hiding,
at pretending to be ill/painful, being full, lying as a
mealtimes protest, asking for another food but still not eat
that food…) at mealtimes
Sweating, feeling nauseous, vomiting, having q1834
belly-ache, coughing… at mealtimes
3.1.2. Testing the picky eating scale
3.1.2.1. Characteristics of the children (n = 84)
84 children covered all age groups in which 12- <24 months and
48- <60 months accounted for 58.4%. Mean age was 33.09 ± 16.2
months. 54.8% of the children was male.
3.1.2.2. Characteristics of the caregivers
The caregivers were mainly women (81%) and 70.2% of them
were mothers. Their occupations were mostly business/retailers
(31%) and 21.4% of them was the housewives. Mean age of
caregivers was 37.17 ± 13.25 years old.
3.1.2.3. Reliability testing of the scale by Cronbach’s Alpha coefficiency
Reliability testing of the scale after eliminating variables were as
followed:
Table 3.7. Testing reability of the scale
Reliability Statistics
Cronbach's Alpha N of Items
0.878 8
10
The scale remained 8 items including q1811; q1812; q1815;
q1822; q1824; q1825; q1832; q1833 then underwent the exploratory
factor analysis for the next step.
3.1.2.4. Results from exploratory factor analysis
Table 3.8. KMO and Bartlett’s test of Sphericity
Kaiser-Meyer-Olkin Measure of Sampling Adequacy 0.756
Bartlett's Test of Approx. Chi-Square 398.530
Sphericity df 28
Sig. 0.000
Result showed that exploratory factor analysis was suitable for our data
with KMO=0.756 which satisfied the condition of 0.5 ≤ KMO ≤ 1.
Bartlett‟s test of Sphericity with sig=0.000<0.05 showed that observed
variables were linearly correlated with the representative factor (PE).
Testing the scale explained of observed items to components
showed Cumulative % of 68.57% which satisfied the condition of
Cumulative % ≥50% so exploratory factor analysis was suitable.
Rotated component matrix from EFA showed that these 8 items
were loaded by two components, so the scale was re-organized in two
components included “Characteristics of children‟s mealtimes” and
“Eating behaviors of the children”. All of the 8 scale items had factor
loadings higher than 0.4.
Table 3.10. Reability testing of the final scale
Components Items N of Cronbach's
items Alpha
1 q1811, q1815, q1812, q1822 4 0.836
2 q1832, q1833, q1824, q1825 4 0.845
Final scale 8 0.878
The final scale getting from reliability testing and exploratory
factor analysis was showed at table 3.11.
Table 3.11. The final picky eating scale
1. Characteristics of children’s mealtimes Score
The child hold foods Holding food for very long time (≥5 3
within his mouth minutes for each spoon of food)
without chewing or Holding food for quite long time (3-4 2
swallowing minutes for each spoon of food)
Holding food for a moment (1-2 minutes 1
for each spoon of food)
No holding food in mouth 0
11
Progression of the The child holds the food from beginning 3
meal to the end of mealtime
The child eats some food at first then 2
holds the food for at least 3 minutes per
spoon
The child eats half of the food then holds 1
the food for at least 3 minutes per spoon
The child eat good from beginning to the 0
end of mealtime
Duration time for each >60 minutes 3
meal 45-60 minutes 2
30-45 minutes 1
<30 minutes 0
Amount of food Very limited amount (<30% of the peers) 3
consumed per day was Limited (30-50% of the peers) 2
less than his/her peers Quite limited (>50% of the peers) 1
The amount is as the same or higher than 0
that of peers
2. Eating behaviors of the children
Having opposed All the time 3
behaviors such as closing Often 2
his mouth, turning to Sometimes 1
another way, hitting Never 0
feeding person, spitting
out the food, throw the
food away… at mealtimes
Having avoided behaviors All the time 3
such as hiding, pretending Often 2
to be ill/painful, being Sometimes 1
full, lying as a protest, Never 0
asking for another food
but still not eat that
food…) at mealtimes
Selective eating Very selective (can eats not more than 3
3 dishes)
Can eats some kinds of food (4-5 2
dishes)
Can eats 6-10 dishes 1
Can eat all food 0
12
Food rejection because of All the time 3
specific tastes, smells, Often 2
textures, appearances or Sometimes 1
compositions of food Never 0
The total score of 8 scale items ranges from 0 to 24. The cut-off
point for defining PE will be mean value of scale‟s total score. The
child will be defined as picky eater if mean value of score is greater
than 12 and the time of PE signs has been lasting for at least one
month.
3.2. DETERMINING THE PREVALENCE AND DESCRIBING
CHARACTERISTICS OF PICKY EATING
3.2.1. Characteristics of participants
3.2.1.1. Characteristics of the children (n=714)
Distribution of all age groups from 12 months to above was quite
equal except for the group of 6- <12 months accounted for the lowest
prevalence (7.8%). The mean age of children was 34.3 ± 15.3 months.
3.2.1.2. Characteristics of the caregivers (n=714)
67.1% of the caregivers was mothers. The mean age was 37.6 ±
12.3 years old. Their occupations were mostly business/retailers
(29.7%), housewives (21.8%) and civil servants (13.2%). 76.8% of
them had level of education from secondary school and above,
however, 2.1% (15/714) of them was illiteracy.
3.2.2. Prevalence of picky eaters
3.2.2.1. Prevalence of picky eaters according to caregiver’s
perception and the scale
According to According to
caregiver's perception the picky eating scale
21.6%
53.9% 46.1% Picky eating Picky eating
Non picky 78.4% Non picky
eating/not know eating
Chart 3.1: Prevalence of picky eaters according to
caregiver’s perception and the scale
13
Prevalence of picky eaters according to caregivers‟ perception
was 46.1%, twofold higher than prevalence from the scale (21.6%).
3.2.2.2.Agreement between two methods of picky eating assessment
There were a moderate agreement between the caregiver‟s perception
and the scale with Kappa = 0.5 (p<0,001).
3.2.2.3. Prevalence of picky eating by age group and gender
Prevalence of picky eaters were similar in boys and girls (21.6%
and 21.5%, respectively); age groups of 48- <60 months and 12- <24
months accounted for the highest prevalence (23.4% and 23.0%,
respectively).
3.2.3. Characteristics of picky eating
3.2.3.1. Common signs of picky eating
The most common signs of PE were keeping food in mouth
without swallowing (82.5%), eating less (81.8%), eating slowly
(72.1%) and pressure eating (45.5%). 22.7% of children cried or had
tantrums at mealtimes.
3.2.3.2. Emotional or behaviors of the child at mealtimes
53.9% of picky eaters was scared, worried or nervous at
mealtimes. 31.2% of them very often and quite often had opposed
behaviors such as closing his mouth, turning to another way, hitting
feeding person, spitting out the food, throw the food away… at
mealtimes. Avoided behaviors also exist in 83.1% of picky eaters.
3.2.3.3. Onset time of picky eating
9.1% of picky eaters had signs of PE and did not want to have
breastmilk or formula before 6 months old. Most of them started to
be picky at 6-<12 months (34.4%). The prevalence decreased when
the child getting older.
3.2.3.4. Problems happened before the onset of picky eating
57.7% of children became picky eaters after experiencing an event
or problem. The most common events were illness (18.8%), teething
(16.9%) and food change (16.2%).
3.2.3.5. Prolonged time of picky eating
Most of children had been picky from 1 to 6 months (27.9%).
There were 18.2% of them had persistent pickiness for more than 36
months and 3.9% of PE was repeated .
3.2.3.6. Eating time of picky eaters
92.2% of picky eaters had fixed eating time which happening at
the same time with the family's mealtime or the time of their own.
14
The rest had changeable eating time, depending on the work of
caregivers or the child's needs.
3.3. IDENTIFYING FACTORS RELATED TO PICKY EATING
3.3.1. Characteristics of participants
3.3.1.1. Characteristics of the children
154 picky eaters and 308 non- picky eaters with similarities in
gender, age group and living place were enrolled for this phase. The
age group of 6-<12 months accounted for the lowest prevalence
(5.2%), the remaining age groups were quite similar.
3.3.1.2. Characteristics of the caregivers
The caregivers were mostly female, accounted for 90.9% and 81.2%
respectively for both groups. Most of the caregivers were mothers (64.9%
and 66.6%, respectively). The most common careers of caregivers in both
groups were business/retailers (26.6% and 30.2% respectively), workers,
farmers, craftsmen (20.1% and 21.1% respectively); Percentage of
caregivers who were civil servants in control group was twofold higher
than in case group (15.3% versus 6.5%).
Caregivers with level of education under secondary school in case
group were higher than those in control group (58.5% compared to
46.1%). In contrast, educational level from high school and above in
control group is higher than the case group. Percentage of illiteracy
among caregivers of case group was 2.6 times higher than that of
controls (5.2% and 2.0%, respectively).
3.3.2. Factors related to picky eating
3.3.2.1. Factors from the child
3.3.2.1.1. Birth history
Low birthweight (<2500 grams), preterm pregnancy and cesarean
delivery were not related to PE.
3.3.2.1.2. The child’s meal
Not having the same food preferences as the caregiver; Being
forced to eat and children do not eat by themselves were found to be
risk factors of PE (p <0.01).
3.3.2.2. Factors from the caregivers
3.3.2.2.1. Demographic factors
We found some related factors of PE were occupation, educational
level and gender of caregivers. The child would be 2.6 times at risk of
PE if being taken cared of by caregivers who were not civil servants
(p <0.01), was 1.6 times at risk of PE (p <0.05) if the caregiver's level
15
of education was under high school and was 2.3 times at risk of PE (p
<0.01) if the caregivers were female.
3.3.2.2.2. Feeding practice
There was no statistically significant difference between 2 groups
in terms of feeding practices such as breastfeeding 1 hour after birth,
duration of exclusive breastfeeding less than 6 months, weaning
before 24 months, early or late introduction of complementary, not
eating enough 4 food groups and unproper feeding practices.
3.3.2.2.3. Behavioural factors
Having somebody dance to make funs for the child to eat; Playing
"eating game"; Watching television or playing with telephone, Ipad,
toys were found to be statistical significant related with PE (p <0.01).
Some physical or mental violence behaviours such as pinching the
child‟s mouth/nose, treading on the child‟s neck to put food into his
mouth, threatening might be risks of PE (p <0.05). The prevalence of
children who experienced violent behaviours in case group was
higher than control group.
3.3.2.3. Family and social factors
Having other picky eater(s) in the family; Staying at home instead
of parcicipating in kindergartens; Being reported to be picky by
kindergarteners, and having family conflicts or stress relating to the
child‟s eating were found to be related factors of PE. The child was
1.8 times at risk to be picky if there was other picky eater(s) in his
family (p<0.05) and 2.3 times at risk if existing family conflicts or
stress relating to his eating (p <0.01). Children who were reported to
be picky eaters at kindergarten were 5.6 times at risk to be picky at
home compared to those who were not picky eaters (p <0.001).
3.3.2.4. The multivariate logistic regression model
Table 3.31. Factors related to picky eating from multivariate
logistic regression analysis
Factors OR 95% CI p
Food preference of the child and the caregiver
Not the same food 2.013 1.291 – 3.139 0.002
preference
The same food 1
preference
Being forced to eat
16