SPATIAL DEVELOPMENT PATTERN
Bạn đang xem bản rút gọn của tài liệu. Xem và tải ngay bản đầy đủ của tài liệu tại đây (3.6 MB, 87 trang )
Hong Kong 2030+
Table of Contents 3 Economy 33
Preface Economic Growth
1 People Employment
Population Growth
Household Growth Economic Structure
Composition of Projected Population Growth
Population Structure 1 Four Key Industries
Labour Force
Population Mobility Two Emerging Industries
Non-Hong Kong Resident Population
Key Issues Pertinent to Strategic Spatial Planning Manufacturing and Construction Industries
Endnote
Key Issues Pertinent to Strategic Spatial Planning
2 Housing
Existing Stock Endnote
Dwindling New Completion
Vacancy 4 Spatial Development Pattern 63
Affordability
Flat Size Reclamation and Topography
Ageing Building Stock
Housing for Elderly Land Utilisation
Key Issues Pertinent to Strategic Planning
Endnote Spatial Changes in Population Distribution
Job Distribution
19 Spatial Distribution of Accommodation for Economic Uses
Compact, High Density and Transit-oriented City Form
Key Issues Pertinent to Strategic Spatial Planning
Endnote
5 Conclusion 82
Hong Kong 2030+
List of Figures and Tables
Figure 1-1 2014-based Population Projections Figure 2-3 Year-on-year Change of Stock of Permanent Living
Figure 1-2 Domestic Household Projections Quarters (2000-2015)
Figure 1-3 Percentages of Domestic Household by Size Figure 2-4
Figure 1-4 Actual (2014-2015) and Projected (2016-2064) Number Figure 2-5 Permanent Living Quarters in Hong Kong (2000-2014)
Figure 1-5 Figure 2-6 Vacancy Rate of Private Domestic Units (2000-2015)
Figure 1-6 of Births and Deaths Figure 2-7 Private Domestic Price Index (1994-2015)
Five Components for Movement of Hong Kong Figure 2-8 Affordability Ratio (1996-2015)
Figure 1-7 Figure 2-9 Private Domestic Rental Index (1996-2015)
Figure 1-8 Resident Population Shares of Stock of Private Domestic by Classes
Figure 1-9 Actual (2004-2014) and Projected (2019-2044) Five Figure 2-10
Figure 1-10 (1985-2015)
Figure 1-11 Components for Movement of Hong Kong Resident Figure 2-11 Shares of Newly Completed Private Domestic Flats by
Figure 1-12 Population
Figure 1-13 Actual (2004-2014) and Projected (2019-2044) Total Classes (1985-2015)
Fertility Rate for Hong Kong Private Housing Units Aged 70 or Above by 2046 (by
Figure 1-14 Hong Kong and Other Asian Economies’ Total Fertility
Rate District Councils)
Actual (2004-2014) and Projected (2019-2044)
Expectation of Life for Hong Kong Figure 3-1 Labour Force and Labour Force Participation Rate
Actual (2014) and Projected (2019-2064) Percentage of Figure 3-2 (2014-2064)
Population by Age Figure 3-3
Projected Labour Force (Excluding Foreign Domestic Figure 3-4 Projected Deceleration of Economic Growth in Long
Helpers) (2014-2044) Figure 3-5 Term
Average Daily Passenger Trips between Hong Kong Figure 3-6
and the Mainland by Passenger Type Figure 3-7 Total Employment, Unemployment and
Shares of Passenger Trips between Hong Kong and Figure 3-8 Under-employment Rates (2000-2015)
the Mainland in 2013/14 by Passenger Type and Figure 3-9
Trip Purpose Value Added in Respect of Four Key Industries in 2000,
Frequent Trip Makers between Hong Kong and the 2007 and 2014
Mainland (2013/14)
Employment in Respect of Four Key Industries in 2000,
Figure 2-1 Percentage of Population by Type of Housing in New 2007 and 2014
Figure 2-2 Towns
Value Added in Respect of Six Emerging Industries
Newly Completed Residential Flats vs. New Domestic (2008-2014)
Households Formed (2000-2015)
Employment in Respect of Six Emerging Industries
(2008-2014)
Value Added in Respect of Trading and Logistics
Sub-sectors in 2000, 2007 and 2014
Employment in Respect of Trading and Logistics
Sub-sectors in 2000, 2007 and 2014
Hong Kong 2030+
Figure 3-10 External Merchandise Trade by Mode of Transport Figure 4-9 Stock of Private Offices by Districts (2003-2015)
Figure 3-11 (2000-2015) Figure 4-10 Stock of Private Offices by Major Office Nodes
Figure 3-12
Figure 3-13 Aggregate Cargo Throughput by Mode of Transport Figure 4-11 (2003-2015)
Figure 3-14 (2000-2015) Figure 4-12 New Completions of Private Offices (2003–2015)
Figure 3-15 Figure 4-13 Stock of Private Commercial by Districts (2003-2015)
Figure 3-16 Percentage of Share of Seaborne and River Cargo in New Completions of Private Commercial by Districts
Figure 3-17 Total Port Cargo Throughput (2000-2015) Figure 4-14
Figure 3-18 Figure 4-15 (2003-2015)
Figure 3-19 Number of Visitor Arrivals in Hong Kong by Origins Distribution of Total Industrial Stock by Districts in 2015
Figure 3-20 (2000, 2003 and 2015) Figure 4-16 Stock of Private Flatted Factories by Districts
Figure 4-17
Visitor Arrivals (2000-2015) (2003-2015)
Overnight MICE Arrivals by Origins (2008-2015) Figure 4-18 Stock of Private Storage by Districts (2003-2015)
Shares of Cultural and Creative Industries in Value Stock of Private Specialised Factories by Districts
Added and Total Employment (2005-2014) (2003-2015)
Gross Domestic Expenditure on and Employment in Number of Hotel Rooms in Hong Kong in 2015
R&D (2005-2014) Table 2-1 Public Rental Housing Estates with Building Blocks over
Shares of Value Added by Manufacturing Sub-sector Table 2-2 40 Years by End 2015
Table 4-1
(2014) Dwelling Space and Average Dwelling Space Per Person
Shares of No. of Persons Engaged by Manufacturing in Hong Kong and Other Selected Cities
Sub-sector (2014) Accommodation for Economic Uses in 2015
Changes in Value Added and No. of Persons Engaged
by Manufacturing Sub-sector between 2005 and
2014
Figure 4-1 Land Utilisation in Hong Kong
Figure 4-2 Population Distribution of Hong Kong (1961–2014)
Figure 4-3 Population Distribution in New Towns (2014)
Figure 4-4 Distribution of Population and Jobs in Hong Kong in
Figure 4-5 2014
Proportion of Working Population with Place of Work in
Figure 4-6
Same District in 2011
Figure 4-7 Spatial Distribution of Accommodation for Economic
Figure 4-8 Uses by Districts in 2015
Overall Stock and Vacancy Rate of Private Offices
(2003-2015)
Stock of Private Offices by CBD and Rest of the Metro
Area (2003 and 2015)
Hong Kong 2030+
PREFACE
The purpose of this paper is to present a baseline review on
(i) the demographic changes, (ii) the housing development, (iii)
the economic development, and (iv) the spatial development
patterns in Hong Kong. Key issues in these four aspects
pertinent to strategic spatial planning will also be consolidated
and analysed.
Aspects of environment and transport are covered in the
papers “Environmental Protection and Nature Conservation
for Sustainable Growth” and Transport Infrastructure and
Traffic Review” respectively.
This topical paper constitutes part of the research series under
“Hong Kong 2030+: Towards a Planning Vision and Strategy
Transcending 2030” (Hong Kong 2030+). The findings and
proposals of the paper form the basis of the draft updated
territorial development strategy which is set out in the Public
Engagement Booklet of Hong Kong 2030+.
Hong Kong 2030+
1 Introduction
People
The population of Hong Kong is projected to grow, Population Growth
albeit at a more modest pace, in the years to come.
Hong Kong is facing the challenges of an ageing 1.1 The population of Hong Kong (i.e. Resident Population
population, a shrinking workforce and the need of including Usual Resident1 and Mobile Residents2) has grown
enhancing productivity. To tackle these demographic by about 0.53 million since 2001 and reached about 7.24
challenges, the Government released a report entitled million in 2014ii and about 7.32 million in 2015iii. According
“Population Policy – Strategies and Initiatives” in January to Census and Statistics Department (C&SD)’s latest baseline
2015i, which put forward some 50 initiatives mainly under projections, the population would grow by about 0.98 million
seven aspects: until reaching the peak of about 8.22 million in 2043 (Figure
1-1), equivalent to a growth rate of approximately 0.4% per
(a) promoting sustainable growth; annum3.
(b) unleashing the potential of local labour force;
(c) enhancing the quality of home-grown talent; 1 “Usual Residents” refer to two categories of people: (a) Hong Kong Permanent
(d) attracting talent from outside; Residents who have stayed in Hong Kong for at least 3 months during the 6 months
(e) importing labour; before or for at least 3 months during the 6 months after the reference time-point,
(f) fostering a supportive environment for forming and regardless of whether they are in Hong Kong or not at the reference time-point; and (b)
Hong Kong Non-permanent Residents who are in Hong Kong at the reference
raising families; and time-point.
(g) embracing opportunities in an ageing society.
2 “Mobile Residents” refer to the Hong Kong Permanent Residents who have stayed in
Hong Kong for at least 1 month but less than 3 months during the 6 months before or
for at least 1 month but less than 3 months during the 6 months after the reference
time-point, regardless of whether they are in Hong Kong or not at the reference
time-point.
3 C&SD also provided high and low projections in addition to baseline projections.
Population under the high projections would grow continuously within the whole
projection horizon up to about 9.12 million in 2064, while that under the low projections
would reach the peak of about 7.87 million in 2038.
Hong Kong 2030+ 1
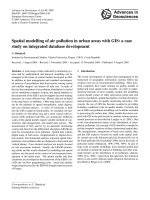
Figure 1-1 2014-based Population Projections Figure 1-2 Domestic Household Projections
Source: Data based on C&SD’s statistics Source: Data based on C&SD’s statistics
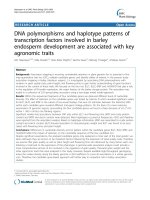
Household Growth 1.3 In tandem with the smaller household size, the proportion of
smaller households (i.e. one to three persons) is expected to
1.2 The number of domestic households4 grew from 2.05 million grow from about 68.0% in 2014 to about 69.9% in 2019 and
in 2001 to about 2.43 million in 2014iv. C&SD projected that it about 71.4% in 2024 (Figure 1-3). For large households (i.e.
would grow faster than population at a rate of about 0.6% per four persons or above), the proportion is projected to drop
annum and increase by about 0.5 million from about 2.43 from about 32.0% to about 30.1% and about 28.6% over the
million in 2014 to the peak of about 2.93 million in 2044iv same period. The increase in the number of small
(Figure 1-2). Over the same period, the average households is mainly related to the demographic trends of
household size is projected to decrease from 2.9 to 2.7 increase in never marriage rates and divorce rates, decrease
persons. in fertility rates and improvement in life expectancy of elderly
persons.
4 According to C&SD, domestic households consists of a group of persons who live
together and make common provision for essentials for living. These persons need not
be related. If a person makes provision for essentials for living without sharing with
other persons, he/she is also regarded as a household. In this case, the household is a
one-person household.
Hong Kong 2030+ 2
Figure 1-3 Percentages of Domestic Households by Size Figure 1-4 Actual (2014-2015) and Projected (2016-2064)
Number of Births and Deaths
Source: Data based on C&SD’s statistics 120
100 No. of Persons (in '000)
Composition of Projected Population Growth
80
Births and deaths 60
1.4 As shown in Figure 1-4, our birth will continue to exceed death 40
20
until 2026ii. From 2027 onwards, the number of deaths will
outgrow that of births. 0
1.5 Over the period from mid 2014 to mid 2064, the total numbers
of births and deaths are projected to be about 2.60 million and 2014
about 3.87 million persons respectively, with a net loss of 2016
about 1.27 million persons. 2018
2020
2022
2024
2026
2028
2030
2032
2034
2036
2038
2040
2042
2044
2046
2048
2050
2052
2054
2056
2058
2060
2062
2064
No. of Births No. of Deaths
Source: Data based on C&SD’s statistics
Hong Kong 2030+ 3
1.6 For the number of births, since the implementation of Figure 1-5 Five Components for Movement of Hong Kong
zero-quota policy on obstetric services for Mainland women Resident Population
whose spouses are not Hong Kong residents after 2012, the
number of Type II Babies5 during the whole projection period
is assumed to be zero. As regards Type I Babies6, the
number projected by C&SD according to past trend is 5,500
per year.
Net movement (inflow less outflow)
1.7 Based on the concept explained in Section 1.1 that Hong Kong
Resident Population includes Usual Residents and Mobile
Residents, Figure 1-5 shows the components adopted by
C&SD in determining the movement of Hong Kong Resident
Population.
1.8 The actual trends of these five components from 2004 to 2014,
and the projections made in C&SD’s latest population
projections from 2019 to 2044ii are summarised in Figure 1-6,
with explanations detailed in Sections 1.9 to 1.18 below.
5 “Type II Babies” refer to those born in Hong Kong to Mainland women whose spouses Source: C&SD (September 2015). Hong Kong Population Projections 2015-2064.
are not Hong Kong Permanent Residents.
4
6 “Type I Babies” refer to those born in Hong Kong to Mainland women whose spouses
are Hong Kong Permanent Residents.
Hong Kong 2030+
Figure 1-6 Actual (2004-2014) and Projected (2019-2044) Component 1 - Net flow of Hong Kong Permanent Residents
Five Components for Movement of Hong Kong into Usual Residents Category
80.0 Resident Population
60.0 1.9 Each year, there are a number of persons who move to reside
Actual Projected in the Mainland or in overseas countries with immigrant visas.
Some of these persons continue to stay for much of their time
No. of Persons (in '000) 40.0 in Hong Kong such that they remain as Usual Residents.
Some others spend less time in Hong Kong but still meet the
20.0 criteria of being Mobile Residents ((1)c in Figure 1-5). Yet,
others would have indeed settled outside Hong Kong and
0.0 could be considered as having left the Hong Kong Resident
Population ((1)d in Figure 1-5). Conversely, there are
-20.0 persons who re-join the Hong Kong Resident Population as
Usual Residents ((1)a in Figure 1-5). Meanwhile, there are
-40.0 Mobile Residents changing over to the Usual Residents
category ((1)b of Figure 1-5) or vice versa ((1)c of Figure 1-5).
-60.0 2004 2005 2006 2007 2008 2009 2010 2011 2012 2013 2014 2019 2024 2029 2034 2039 2044
1.10 A net outflow for the component was recorded from mid 2010
Net flow of Net flow of Net flow of to mid 2014. A sustained net outflow is thus projected in
HKPRs* into the Mobile HKPRs* the future. The net outflow will decrease in the first 20 years
Usual Residents Residents travelling on of the projection period from 19,800 in 2019 to 5,400 in 2034.
category re-entry permits It will then re-bound to 12,200 in 2044.
Net flow of
Inflow of Hong Kong Overall Component 2 - Net flow of Mobile Residents
OWPHs# Non-permanent
Residents other 1.11 From mid 2010 to mid 2014 (except mid 2013), there was
* Hong Kong Permanent Residents than OWPHs# generally a net inflow of Mobile Residents. It is projected that
# One-way Permit Holders there will be a moderate net inflow of this component with an
annual net inflow slowly decreasing from around 3,800 in 2014
Source: Data based on C&SD’s statistics to around 2,800 in 2034 and around 300 in 2044.
Hong Kong 2030+ 5
Component 3 – Net flow of Hong Kong Permanent Residents component will decrease slightly from 1,000 in mid 2014 to
travelling on re-entry permits 900 in mid 2034, and remain at this level till 2044.
1.12 Since children aged under 11 cannot travel to the Mainland or Component 4 – Inflow of OWPHs
Macao solely using Hong Kong Identity Card, most will travel
on re-entry permits. As the number of babies born in Hong 1.15 According to the Basic Law, the quota of OWPHs “shall be
Kong to Mainland women had increased significantly in a few determined by the competent authorities of the Central
years earlier, there was a large net outflow of persons aged 0 People’s Government after consulting the government of the
as many of these women take their babies back to the Region”. Since 1 July 1995, the quota has been 150 per day.
Mainland for living immediately. However, there is a net The inflow of OWPHs is projected based on recent trends of
inflow of persons aged over 0 when some of these babies the number of OWPHs coming to Hong Kong. It is projected
return to Hong Kong subsequently at older ages. As no Type that the number of OWPHs will increase from 119 per day
II Babies are assumed during the entire projection period, the in mid 2014 to 130 per day in mid 2019, and gradually
annual net outflow for most of the years in the projection decline to around 100 per day as from mid 2027. The
period will be much smaller than in the previous years. number during the early projection period is expected to be
higher due to the inflow of overage children 7 and their
1.13 The required parameters of the return rates of Type I and Type spouses and minor children.
II Babies are mainly determined based on the actual
movement record travelling on re-entry permit and Hong Kong Component 5 – Net flow of Hong Kong Non-permanent
Identity Card for Type I and Type II Babies born during 2003 to Residents other than OWPHs (including net change from
2013. Some of these babies will leave Hong Kong in visitor status to resident status)
subsequent years. It is projected that all Type I Babies and
around 30% of Type II Babies will settle in Hong Kong 1.16 This component includes Hong Kong Non-permanent
before the age of 21. Residents who have entered Hong Kong for employment,
study or family reasons as well as foreign domestic helpers
1.14 Taking into account the above assumptions on net movement and imported workers. It is expected the net inflow would
(and the numbers) of Type I and Type II Babies, as well as a be sustained, along with the continued development of Hong
small net outflow of local children based on historical trends,
the net movement travelling on re-entry permits can be 7 “Overage children” are Mainland residents who were below age of 14 when their
projected. Except for the net inflow during the initial period natural fathers or mothers, on or before 1 November 2001, obtained their Hong Kong
due to return of Type II Babies born in or before 2012, it is Identity Card and whose natural fathers or mothers still resided in Hong Kong on 1 April
projected that the annual net outflow arising from this 2011.
Hong Kong 2030+ 6
Kong as an international city. It is anticipated that the annual group. For the population aged under 25, the sex ratio will be
net inflow would range from 2,900 to 16,100. higher, i.e. more males than females in relative terms. For the
age groups from 25 to 44, the sex ratio will be lower i.e. less
1.17 It should be noted that some persons in this component may males than females. This is mainly because among
later on change their status from Hong Kong Non-permanent cross-boundary marriages in recent years, around 70% were
Residents to Hong Kong Permanent Residents during their between Hong Kong males and Mainland females, and 30%
stay in Hong Kong. If these persons subsequently cease to between Hong Kong females and Mainland males. This has
be Usual Residents of Hong Kong, such movement will be led to more females among spouses coming to Hong Kong for
treated as an outflow in the component “net flow of Hong Kong family reunion via OWP.
Permanent Residents into the Usual Residents category”.
Ageing Population
1.18 Separate projections are made on the number of foreign
domestic helpers in view of their special employment nature. 1.20 Population ageing is expected to continue in Hong Kong.
C&SD has in the latest population projectionsii enhanced the Our fertility showed a declining trend over the past three
methodology for projecting the number of foreign domestic decades. Despite a moderate re-bounce in recent years, the
helpers by taking into account the future structural changes in total fertility rate8 in Hong Kong has been consistently
the population, especially the increasing demand for foreign below the replacement level9 of 2,100v. In 2003, the total
domestic helpers for taking care of the elderly. Projection fertility rate has dropped to a record low of 901. It has
results show that the number of foreign domestic helpers will re-bounded to about 1,000 to 1,300 since 2007 (Figure 1-7).
rise from 328,300 in 2014 to 584,300 in 2044. Hong Kong’s recent total fertility rate has been similar to that of
other Asian economies (e.g. South Korea, Singapore and
Population Structure
8 “Total fertility rate” refers to the average number of children that would be born alive to
Sex ratio 1,000 women during their lifetime if they were to pass through their childbearing ages
15-49 experiencing the age specific fertility rates prevailing in a given year.
1.19 According to C&SD’s latest population projectionsii, the sex
ratio (i.e. the number of males per 1,000 females) of the 9 “Replacement level” refers to the number of children 1,000 women needs to produce
population is projected to fall noticeably, from 935 in 2014 to for a population to replace itself. Each woman would produce on average of one
862 in 2034 and 825 in 2044 (excluding foreign domestic daughter, who may be said to “replace” her mother in the population. A total fertility
helpers). There will be variations in the sex ratio by age rate of 2,100 per 1,000 women is considered to correspond to the replacement level,
allowing for such factors as sex differential at birth and infant and childhood mortality.
Hong Kong 2030+ 7
Taiwan), but much lower than that in the western countries Figure 1-8 Hong Kong and Other Asian Economies’ Total
(Figure 1-8). Fertility Rate
Figure 1-7 Actual (2004-2014) and Projected (2019-2044)
Total Fertility Rate for Hong Kong
1,400
1,200 Actual Projected
No. of Children Born Alive per 1,000 Women 1,000
800
600
400
200
Source: C&SD (December 2015). The Fertility Trend in Hong Kong, 1981 to 2014.
0
2004 2005 2006 2007 2008 2009 2010 2011 2012 2013 2014 2019 2024 2029 2034 2039 2044
Note: excluding foreign domestic helpers
Source: Data based on C&SD’s statistics
Hong Kong 2030+ 8
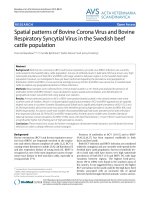
1.21 In C&SD’s latest population projectionsii, the total fertility rate Figure 1-9 Actual (2004-2014) and Projected (2019-2064)
will decrease gradually from 1,234 live births per 1,000 women Expectation of Life for Hong Kong
in 2014 to 1,181 in 2024, 1,161 in 2034 and 1,150 in 2044
(Figure 1-7). Nevertheless, because of the continual inflow 92.0
of persons from outside Hong Kong to the population, the 90.0
Hong Kong population is projected to maintain a positive 88.0
growth until 2043 under the baseline projections. 86.0
84.0
1.22 On the other hand, Hong Kong has experienced a continuous 82.0
decline in mortality from 2004 to 2014, leading to increase in 80.0
life expectancyii. Between 2004 and 2014, Hong Kong’s 78.0
expectation of life for male and female had increased from 76.0
79.0 to 81.2 and from 84.8 to 86.9 respectively. It is 74.0
projected that these figures will further increase to 83.0 72.0 2004 2005 2006 2007 2008 2009 2010 2011 2012 2013 2014 2019 2024 2029 2034 2044
(male)/88.6 (female) in 2024, 84.3 (male)/89.9 (female) in
2034, and 85.2 (male)/90.8 (female) in 2044 (Figure 1-9). Male Female
Source: Data based on C&SD’s statistics
1.23 Partly due to low total fertility rate and longer expectation of
life, the proportion of elderly aged 65 and over (excluding
foreign domestic helpers) is projected to rise markedly
from 15% in 2014 to 23% in 2024, 30% in 2034, 33% in 2044,
35% in 2054 and 36% in 2064 (Figure 1-10), while that of the
“old-old” (i.e. aged 85 and over) is projected to increase
from about 2.2% in 2014 to about 3.2%, 4.2%, 7.9%, 10.0%
and 10.1% in 2024, 2034, 2044, 2054 and 2064
respectivelyii. The median age (also excluding foreign
domestic helpers) would rise from about 43.7 in 2014 to 47.0
in 2024, 50.0 in 2034, 52.5 in 2044, 53.2 in 2054 and 53.5 in
2064. On the other hand, the proportion of the population
group aged under 15 is projected to decrease from 12% in
2014 to 10% in 2034, and then to 9% in 2064.
Hong Kong 2030+ 9
Figure 1-10 Actual (2014) and Projected (2019-2064) Labour Force
Percentage of Population by Age
1.25 Ageing population would dwindle the size of our labour
100% Aged 65 and over force10vi. Between 2014 and 2018, there will still be a minor
90% Aged 15-64 growth of our labour force (excluding foreign domestic helpers)
80% Aged 0-14 from about 3.60 million to the peak of about 3.65 million.
70% Starting from 2019, it will gradually decrease and stabilise at
60% a level of about 3.42 million in 2034 and subsequently fall
50% to about 3.39 million in 2044 (Figure 1-11).
40%
30%
20%
10%
0%
2014 2019 2024 2029 2034 2044 2054 2064
Source: Data based on C&SD’s statistics 10 Labour force refers to the land-based non-institutional population aged 15 and over
who satisfy the criteria for being classified as employed persons or unemployed
1.24 The projected changes of age structure would also lead to persons. Employed persons refer to those persons aged 15 and over who have been
variations of the overall dependency ratio, which is defined at work for pay or profit during the 7 days before enumeration or have had formal job
as the number of persons aged under 15 and those 65 and attachment. Unpaid family workers and persons who were on leave/holiday during the
over per 1,000 persons aged 15-64. The ratio (excluding seven days before enumeration are included. Unemployed persons refer to those
foreign domestic helpers) is projected to rise phenomenally persons aged 15 and over who fulfill the following conditions: (a) have not had a job
from 371 in 2014 to 546 in 2024, 680 in 2034, 738 in 2044, and have not performed any work for pay or profit during the 7 days before
806 in 2054 and 831 in 2064ii. enumeration; (b) have been available for work during the 7 days before enumeration;
and (c) have sought work during the 30 days before enumeration.
Hong Kong 2030+ 10
Figure 1-11 Projected Labour Force (Excluding Foreign (b) decline in the proportion of persons of prime working age
Domestic Helpers) (2014-2044) (aged 25 to 59) in the population aged 15 and over; and
3.70
3.65Projected labour force (in million) (c) increase in the proportion of females (whose LFPRs are
3.60 (excluding foreign domestic helpers) relatively lower than those for males) in the population
3.55 aged 15 and over.
3.50 2014
3.45 2015 1.27 The LFPRs for males in age groups 15 to 49 are projected to
3.40 2016 decline generally, while those for females aged 30 and over
3.35 2017 are projected to increase. Thus, the gap between the two
3.30 2018 sexes in some age groups would narrow down. However,
3.25 2019 due to ageing effect, the overall LFPR for females is projected
2020 to decrease from 50.7% in 2014 to 48.7% in 2024, 45.0% in
2021 2034 and 43.5% in 2044.
2022
2023 1.28 By 2044, persons in the age group of 30-34 have the highest
2024 LFPR (89.1%), followed by those in age group 35-39 (88.0%).
2025 As for those age groups of 50 to 64, their LFPRs are projected
2026 to increase as a result of the increasing educational attainment
2027 and better health.
2028
2029 Population Mobility
2030
2031 1.29 According to C&SD’s latest population projectionsii, the
2032 number of Mobile Residents is projected to increase from
2033 216,000 in 2014 (about 2.98% of the total population) to
2034 217,100 in 2024, a peak of 239,200 in 2034 (2.95% of the total
2035 population) and then gradually decrease to 226,900 in 2044
2036 (2.76% of the total population), 212,700 in 2054 (2.64% of the
2037
2038
2039
2040
2041
2042
2043
2044
Source: Data based on C&SD’s statistics
1.26 The overall labour force participation rate (LFPR)11 (excluding
foreign domestic helpers) is projected to decline steadily from
59.3% in 2014 to 56.1% in 2024, 51.1% in 2034 and 49.8% in
2044vi. This is mainly due to:
(a) ageing trend in the community, with the increase in the
proportion of older persons (aged 65 and over) in the
population aged 15 and over;
11 LFPR refers to the proportion of labour force in the total land-based
non-institutional population aged 15 and over.
Hong Kong 2030+ 11
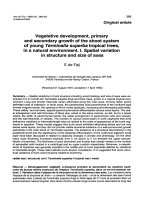
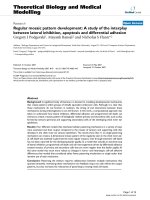
total population), and 202,300 in 2064 (2.59% of the total 1.32 For passenger trips made by people living in Hong Kong,
population). some 42% were for leisure, followed by visiting relatives and
friends (27%) and for business (19%) (Figure 1-13).
Cross-boundary passenger trips Shenzhen remained the most common trip destination (74% of
the trips). For trips made by visitors from the Mainland, about
1.30 While the number of Mobile Residents only contributed to 73% came under the Individual Visit Scheme (including the
about 3% of the total population, increasing mobility is General Individual Visit Scheme and One-year Multiple entry
reflected by the increase in cross-boundary trips. In recent Individual Visit Scheme). Regarding trip purpose, 69% of the
years, cross-boundary travel activities have increased Mainland visitors came to Hong Kong for leisure, 15% visiting
significantly due to intensifying social and economic ties relatives and friends and 9% for business. For trips made by
among Hong Kong, the Mainland and Macao, in particular the Hong Kong residents living in the Mainland, 90% started from
Pearl River Delta. According to the Cross-boundary Travel Shenzhen and mainly travelled back to Hong Kong for
Survey 2013/14 (the Survey) commissioned by the Planning schooling (35%), work (26%) and leisure (15%).
Department (PlanD) vii , the average daily number of
cross-boundary passenger trips made was about 0.66
million in 2014, representing a growth of more than
double as compared with 0.30 million in 1999 and 61% as
compared with 0.41 million in 2003. Among these trips,
about 92% were passengers trips between Hong Kong and the
Mainland and the other 8% were between Hong Kong and
Macao.
1.31 Among trips between Hong Kong and the Mainland, about
52% were made by people living in Hong Kong; about 32%
were made by visitors from the Mainland; about 14% by Hong
Kong residents living in the Mainland and about 2% by people
living in other places (Figure 1-12).
Hong Kong 2030+ 12
Figure 1-12 Average Daily Passenger Trips between Hong Figure 1-13 Shares of Passenger Trips between Hong
Kong and the Mainland by Passenger Type Kong and the Mainland in 2013/14 by
Average Daily 100% Passenger Type and Trip Purpose
Passenger Trips 80%
700,000 People living in other places 5% 6%
600,000 Hong Kong residents living in Mainland 8% 1%
500,000 7% 9%
400,000 2% Visitors from the Mainland
9% People living in Hong Kong 2``% 19% 26% 15%
300,000 10% 2% 14%
3% 3% 13% 60% 5%
27% 11%
3% 10% 11%
9%
16% 19% 24% 32% 40% 15%
69%
15%
20% 42% 35%
200,000 0%
78% 73% 71% 68% 61% 52% People living in Hong Hong Kong residents Visitors from the
Mainland
100,000 Kong living in the Mainland
0 2006 2007 2009 2011 2013/14 Schooling Leisure Visiting relatives and friends Business Work Other purposes
2003
Source: Data based on PlanD’s statistics Source: Data based on PlanD’s statistics
Hong Kong 2030+ 13
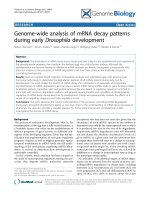
1.33 In terms of the number of frequent cross-boundary trip makers, whereas the number of cross-boundary workers dropped by
the Survey found that there were 737,700 frequent 15.8%.
cross-boundary travellers who usually travelled at least
once a week between Hong Kong and the Mainland in 2014 (a Figure 1-14 Frequent Trip Makers between Hong Kong
5% increase as compared with 2011). They included and the Mainland (2013/14)
frequent leisure trip makers12 (40.5%), frequent business trip
makers 13 (20.6%), extended home-leavers 14 (12.5%), Source: Data based on PlanD’s statistics
cross-boundary workers15 (5.6%), cross-boundary students16
(2.8%) and other frequent trip makers 17 (18.0%) (Figure 14
1-14).
1.34 There was a significant increase in the number of
cross-boundary students (by about 60% as compared with
2011), especially those aged 6-11, probably related to the
upsurge of Type II babies before adopting the zero-quota
policy on obstetric services for Mainland women whose
spouses are not Hong Kong residents after 2012. Besides,
as compared with 2011, the number of extended
home-leavers and frequent business trip makers also
increased significantly by about 32.1% and 10.5% respectively,
12 “Frequent leisure trip makers” refers to the people frequently travelled across the
boundary mainly for leisure purpose at least once a week.
13 “Frequent business trip makers” refers to the people aged 15 and over who travelled
across the boundary for business purposes at least once a week.
14 “Extended home-leavers” refers to the people travelled at least once a week to visit
their family members on either side of the boundary.
15 “Cross-boundary workers” refers to the people aged 15 and over who travelled at
least four times a week from home to the place of work on either side of the
boundary.
16 “Cross-boundary students” refers Hong Kong Residents aged 18 and below who
were living in the Mainland but travelled across the boundary at least four times a
week to go to schools in Hong Kong.
17 “Other frequent trip makers” refers to people frequently travelled across the boundary
at least once a week for a variety of purposes.
Hong Kong 2030+
Non-Hong Kong Resident Population recommended in the Population Policy - Strategies and
Initiatives to attract these people to return to Hong Kong
1.35 Other than the projected Hong Kong Resident Population, the for making contribution to our future.
following five categories of people, not necessarily mutually
exclusive, have implications on land use and infrastructure (d) Remaining proportion of Type I and Type II Babies
planning: From 2001 to 2014, some 98,877 Type I Babies and
203,927 Type II Babies were born in Hong Kong. Mainly
(a) Short-stay Hong Kong Permanent Residents based on the actual movement records travelling on
According to the 2011 Population Census, short-stay re-entry permit and Hong Kong Identity Cards for Type I
Hong Kong Permanent Residents (who have stayed in and Type II Babies born during 2003 to 2013, it was
Hong Kong for less than one month in the six months both assumed in C&SD’s latest population projections that all
before and after the Census) amounted to 10,996. Type I Babies and around 30% of Type II Babies would
settle in Hong Kong before the age of 21ii. Some of the
(b) Hong Kong people living in the Mainland remaining portion of Type II Babies (70%) may also
Based on the passenger movement records, C&SD eventually choose to return and reside in Hong Kong.
estimated that a total of 514,800 Hong Kong Permanent
Residents usually stayed in the Guangdong Province (e) Visitors
in end 2015, which was slightly more than the figure of According to the Hong Kong Tourism Board (HKTB),
509,700 in end 2013viii. About 42% (215,900) of these there was a surge in the number of visitor arrivals (both
residents were aged under 15, while 15% (74,700) were overnight and same day) over the past ten years from
aged 65 and above. Nearly 76% (389,100) of these about 15.5 million in 2003 to 59.3 million in 2015ix. Of
residents were non-Hong Kong Resident Population. these, the number of same day visitor arrivals recorded
phenomenal growth from about 5.9 million (37.7% of the
(c) Hong Kong overseas emigrants and their second total annual visitor arrivals) in 2003 to 32.6 million (55.0%
generations of the total annual visitor arrivals) in 2015. The total
It is estimated that since 1980, some 800,000 Hong Kong tourist arrival figure in 2015 stood at 59 million.
residents had emigrated, with almost 90% to the United According to an assessment of Hong Kong’s capacity to
States, Australia, New Zealand, Canada and the United receive tourists undertaken in 2013, the number of tourist
Kingdomi. Some of their second generation are already was projected to rise to above 70 million by 2017x.
in employment. Many of them are well-educated
professionals, forming a large pool of highly-skilled talents. 1.36 It is uncertain if people under categories (a) to (c) above have
Given their knowledge and ties with Hong Kong, it was a regular residence in Hong Kong, and whether these people
Hong Kong 2030+ 15