DATACENTER TRAFFIC PATTERNS IN FACEBOOK’S NETWORKS
Bạn đang xem bản rút gọn của tài liệu. Xem và tải ngay bản đầy đủ của tài liệu tại đây (5.1 MB, 15 trang )
Inside the Social Network’s (Datacenter) Network
Arjun Roy, Hongyi Zeng†, Jasmeet Bagga†, George Porter, and Alex C. Snoeren
Department of Computer Science and Engineering
University of California, San Diego
†Facebook, Inc.
ABSTRACT 1. INTRODUCTION
Large cloud service providers have invested in increasingly Datacenters are revolutionizing the way in which we de-
larger datacenters to house the computing infrastructure re- sign networks, due in large part to the vastly different engi-
quired to support their services. Accordingly, researchers neering constraints that arise when interconnecting a large
and industry practitioners alike have focused a great deal of number of highly interdependent homogeneous nodes in a
effort designing network fabrics to efficiently interconnect relatively small physical space, as opposed to loosely cou-
and manage the traffic within these datacenters in perfor- pled heterogeneous end points scattered across the globe.
mant yet efficient fashions. Unfortunately, datacenter oper- While many aspects of network and protocol design hinge
ators are generally reticent to share the actual requirements on these physical attributes, many others require a firm un-
of their applications, making it challenging to evaluate the derstanding of the demand that will be placed on the network
practicality of any particular design. by end hosts. Unfortunately, while we understand a great
deal about the former (i.e., that modern cloud datacenters
Moreover, the limited large-scale workload information connect 10s of thousands of servers using a mix of 10-Gbps
available in the literature has, for better or worse, heretofore Ethernet and increasing quantities of higher-speed fiber in-
largely been provided by a single datacenter operator whose terconnects), the latter tend to be not disclosed publicly.
use cases may not be widespread. In this work, we report
upon the network traffic observed in some of Facebook’s dat- Hence, many recent proposals are motivated by lightly
acenters. While Facebook operates a number of traditional validated assumptions regarding datacenter workloads, or, in
datacenter services like Hadoop, its core Web service and some cases, workload traces from a single, large datacenter
supporting cache infrastructure exhibit a number of behav- operator [12, 26]. These traces are dominated by traffic gen-
iors that contrast with those reported in the literature. We erated as part of a major Web search service, which, while
report on the contrasting locality, stability, and predictability certainly significant, may differ from the demands of other
of network traffic in Facebook’s datacenters, and comment major cloud services. In this paper, we study sample work-
on their implications for network architecture, traffic engi- loads from within Facebook’s datacenters. We find that traf-
neering, and switch design. fic studies in the literature are not entirely representative of
Facebook’s demands, calling into question the applicability
Keywords of some of the proposals based upon these prevalent assump-
tions on datacenter traffic behavior. This situation is partic-
Datacenter traffic patterns ularly acute when considering novel network fabrics, traffic
engineering protocols, and switch designs.
CCS Concepts
As an example, a great deal of effort has gone into iden-
•Networks → Network measurement; Data center net- tifying effective topologies for datacenter interconnects [4,
works; Network performance analysis; Network monitor- 19, 21, 36]. The best choice (in terms of cost/benefit trade-
ing; Social media networks; off) depends on the communication pattern between end
hosts [33]. Lacking concrete data, researchers often de-
Permission to make digital or hard copies of all or part of this work for personal sign for the worst case, namely an all-to-all traffic matrix
or classroom use is granted without fee provided that copies are not made or in which each host communicates with every other host with
distributed for profit or commercial advantage and that copies bear this notice equal frequency and intensity [4]. Such an assumption leads
and the full citation on the first page. Copyrights for components of this work to the goal of delivering maximum bisection bandwidth [4,
owned by others than the author(s) must be honored. Abstracting with credit is 23, 36], which may be overkill when demand exhibits sig-
permitted. To copy otherwise, or republish, to post on servers or to redistribute to nificant locality [17].
lists, requires prior specific permission and/or a fee. Request permissions from
In practice, production datacenters tend to enforce a cer-
tain degree of oversubscription [12, 21], assuming that either
SIGCOMM ’15, August 17–21, 2015, London, United Kingdom the end-host bandwidth far exceeds actual traffic demands,
c 2015 Copyright held by the owner/author(s). Publication rights licensed to
ACM. ISBN 978-1-4503-3542-3/15/08. . . $15.00
DOI: />
123
Finding Previously published data Potential impacts
Traffic is neither rack local nor all-to-all; low utilization (§4) 50–80% of traffic is rack local [12, 17] Datacenter fabrics [4, 36, 21]
Demand is wide-spread, uniform, and stable, with rapidly Demand is frequently concentrated Traffic engineering [5, 14,
changing, internally bursty heavy hitters (§5) and bursty [12, 13, 14] 25, 39]
Small packets (outside of Hadoop), continuous arrivals; many Bimodal ACK/MTU packet size, SDN controllers [1, 22,
concurrent flows (§6) on/off behavior [12]; <5 concurrent 28, 32, 34]; Circuit/hybrid
large flows [8] switching [7, 20, 30, 39]
Table 1: Each of our major findings differs from previously published characterizations of datacenter traffic. Many systems
incorporate one or more of the previously published features as design assumptions.
or that there is significant locality in demand that decreases tems and per-host packet-header traces, we examine services
the need for full connectivity between physically disparate that generate the majority of the traffic in Facebook’s net-
portions of the datacenter. The precise degree of oversub- work. While we find that the traffic patterns exhibited by
scription varies, but there is general agreement amongst op- Facebook’s Hadoop deployments comport well with those
erators that full connectivity is rarely worthwhile [11]. To reported in the literature, significant portions of Facebook’s
mitigate potential “hotspots” caused by oversubscription, re- service architecture [10, 15] vary dramatically from the
searchers have suggested designs that temporarily enhance MapReduce-style infrastructures studied previously, leading
connectivity between portions of the datacenter [5, 25, 40]. to vastly different traffic patterns. Findings of our study with
The utility of these approaches depends upon the prevalence, significant architectural implications include:
size, and dynamics of such hotspots.
• Traffic is neither rack-local nor all-to-all; locality de-
In particular, researchers have proposed inherently non- pends upon the service but is stable across time peri-
uniform fabrics which provide qualitatively different con- ods from seconds to days. Efficient fabrics may ben-
nectivity to certain portions of the datacenter through various efit from variable degrees of oversubscription and less
hybrid designs, typically including either optical [30, 39] or intra-rack bandwidth than typically deployed.
wireless links [25, 40]. If demand can be predicted and/or
remains stable over reasonable time periods, it may be feasi- • Many flows are long-lived but not very heavy. Load
ble to provide circuit-like connectivity between portions of balancing effectively distributes traffic across hosts; so
the datacenter [20]. Alternatively, network controllers could much so that traffic demands are quite stable over even
select among existing paths in an intelligent fashion [14]. sub-second intervals. As a result, heavy hitters are
Regardless of the technology involved, all of these tech- not much larger than the median flow, and the set of
niques require traffic to be predictable over non-trivial time heavy hitters changes rapidly. Instantaneously heavy
scales [14, 20, 25, 30, 39]. hitters are frequently not heavy over longer time pe-
riods, likely confounding many approaches to traffic
Finally, many have observed that the stylized nature of engineering.
datacenter traffic opens up many avenues for increasing the
efficiency of switching hardware itself. In particular, while • Packets are small (median length for non-Hadoop traf-
some have proposed straightforward modifications like de- fic is less than 200 bytes) and do not exhibit on/off
creased buffering, port count, or sophistication [4] in vari- arrival behavior. Servers communicate with 100s of
ous layers of the switching fabric, others have proposed re- hosts and racks concurrently (i.e., within the same 5-
placing conventional packet switches either with circuit or ms interval), but the majority of traffic is often destined
hybrid designs that leverage locality, persistence, and pre- to (few) 10s of racks.
dictability of traffic demands [30]. More extreme, host-
based solutions advocate connecting end-hosts directly [21, While we do not offer these workloads as any more rep-
23]. Obviously, when, where, or if any of these approaches resentative than others—indeed, they may change as Face-
makes economic sense hinges tightly on offered loads [33]. book’s services evolve—they do suggest that the space of
cloud datacenter workloads is more rich than the literature
While there have been a number of studies of univer- may imply. As one way to characterize the significance of
sity [14] and private datacenters [12], many proposals cannot our findings, Table 1 shows how our results compare to the
be fully evaluated without significant scale. Almost all of the literature, and cites exemplar systems that incorporate these
previous studies of large-scale (10K hosts or larger) datacen- assumptions in their design.
ters [5, 12, 14, 17, 21, 25, 26] consider Microsoft datacen-
ters. While Facebook’s datacenters have some commonality The rest of this paper is organized as follows. We begin
with Microsoft’s, such as eschewing virtual machines [14], in Section 2 with a survey of the major findings of previ-
they support a very different application mix. As a result, ous studies of datacenter traffic. Section 3 provides a high-
we observe a number of critical distinctions that may lead to level description of the organization of Facebook’s datacen-
qualitatively different conclusions; we describe those differ- ters, the services they support, and our collection method-
ences and explain the reasons behind them. ologies. We then analyze aspects of the traffic within a num-
ber of Facebook’s datacenters that impact provisioning (Sec-
Our study is the first to report on production traffic in tion 4), traffic engineering (Section 5), and switch design
a datacenter network connecting hundreds of thousands of (Section 6), before concluding in Section 7.
10-Gbps nodes. Using both Facebook-wide monitoring sys-
124
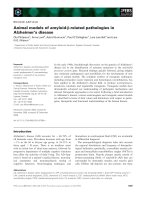
2. RELATED WORK Figure 1: Facebook’s 4-post cluster design [19]
Initial studies of datacenter workloads were conducted via book’s datacenter network topology, as well as a description
simulation [6] or on testbeds [18]. Subsequently, however, a of the application services that it supports; more detail is
number of studies of production datacenter traffic have been available elsewhere [2, 9, 10, 15, 19]. We then describe the
performed, primarily within Microsoft datacenters. two distinct collection systems used to assemble the network
traces analyzed in the remainder of the paper.
It is difficult to determine how many distinct Microsoft
datacenters are reported on in literature, or how representa- 3.1 Datacenter topology
tive that set might be. Kandula et al. observe that their results
“extend to other mining data centers that employ some fla- Facebook’s network consists of multiple datacenter sites
vor of map-reduce style workflow computation on top of a (henceforth site) and a backbone connecting these sites.
distributed block store,” but caution that “web or cloud data Each datacenter site contains one or more datacenter build-
centers that primarily deal with generating responses for web ings (henceforth datacenter) where each datacenter contains
requests (e.g., mail, messenger) are likely to have different multiple clusters. A cluster is considered a unit of deploy-
characteristics.” [26]. By that taxonomy, Facebook’s data- ment in Facebook datacenters. Each cluster employs a con-
centers clearly fall in the latter camp. Jalaparti et al. [24] ventional 3-tier topology depicted in Figure 1, reproduced
examine latency for Microsoft Bing services that are similar from a short paper [19].
in concept to Facebook’s service; we note both similarities
to our workload (relatively low utilization coupled with a Machines are organized into racks and connected to a
scatter-gather style traffic pattern) and differences (load ap- top-of-rack switch (RSW) via 10-Gbps Ethernet links. The
pears more evenly distributed within Facebook datacenters). number of machines per rack varies from cluster to cluster.
Each RSW in turn is connected by 10-Gbps links to four
Three major themes are prevalent in prior studies, and aggregation switches called cluster switches (CSWs). All
summarized in Table 1. First, traffic is found to be heavily racks served by a particular set of CSWs are said to be in
rack local, likely as a consequence of the application pat- the same cluster. Clusters may be homogeneous in terms
terns observed; Benson et al. note that for cloud datacen- of machines—e.g. Cache clusters—or heterogeneous, e.g.
ters “a majority of traffic originated by servers (80%) stays Frontend clusters which contain a mixture of Web servers,
within the rack” [12]. Studies by Kandula et al. [26], De- load balancers and cache servers. CSWs are connected to
limitrou et al. [17] and Alizadeh et al. [8] observe similarly each other via another layer of aggregation switches called
rack-heavy traffic patterns. Fat Cats (FC). As will be seen later in this paper, this design
follows directly from the need to support a high amount of
Second, traffic is frequently reported to be bursty and intra-cluster traffic. Finally, CSWs also connect to aggrega-
unstable across a variety of timescales—an important ob- tion switches for intra-site (but inter-datacenter) traffic and
servation, since traffic engineering techniques often depend datacenter routers for inter-site traffic.
on relatively long-lived, predictable flows. Kapoor et al.
observe that packets to a given destination often arrive in The majority of Facebook’s current datacenters employ
trains [27]; while Benson et al. find a strong on/off pat- this 4-post Clos design. Work is underway, however, to mi-
tern where the packet inter-arrival follows a log-normal dis- grate Facebook’s datacenters to a next-generation Fabric ar-
tribution [13]. Changing the timescale of observation can chitecture [9]. The analyses in this paper are based upon
change the ease of prediction; Delimitrou et al. [17] note data collected from machines in traditional 4-post clusters,
that while traffic locality varies on a day-to-day basis, it re- although Facebook-wide statistics (e.g., Table 3) cover hosts
mains consistent at the scale of months. Conversely, Ben- in both traditional 4-post clusters and newer Fabric pods.
son et al. [14] claim that while traffic is unpredictable at
timescales of 150 seconds and longer, it can be relatively One distinctive aspect of Facebook’s datacenters is that
stable on the timescale of a few seconds, and discuss traffic each machine typically has precisely one role: Web servers
engineering mechanisms that might work for such traffic. (Web) serve Web traffic; MySQL servers (DB) store user
data; query results are stored temporarily in cache servers
Finally, previous studies have consistently reported a bi- (Cache)—including leaders, which handle cache coherency,
modal packet size [12], with packets either approaching the and followers, which serve most read requests [15]; Hadoop
MTU or remaining quite small, such as a TCP ACK seg- servers (Hadoop) handle offline analysis and data mining;
ment. We find that Facebook’s traffic is very different, with Multifeed servers (MF) assemble news feeds [31]. While
a consistently small median packet size despite the 10-Gbps there are a number of other roles, these represent the major-
link speed. Researchers have also reported that individual ity, and will be the focus of our study. In addition, a rel-
end hosts typically communicate with only a few (e.g., less
than 5 [8]) destinations at once. For some Facebook services,
an individual host maintains orders of magnitude more con-
current connections.
3. A FACEBOOK DATACENTER
In order to establish context necessary to interpret our
findings, this section provides a brief overview of Face-
125
HTTP Request Mul1feed, Ads, Server&Info,&
SLB etc. BGP,&etc.&
HTTP Reply nflog&Samples& Tagger& Scuba&
Tagger& Hive&
WEB WEB WEB Agent& Scribe& Tagger& Scribe&
WEB WEB WEB Agent& Tagger&
WEB WEB WEB Agent&
Web Cache DB Agent&
Agent&
WEB Agent&
WEB Agent&
WEB Agent&
Hadoop Agent&
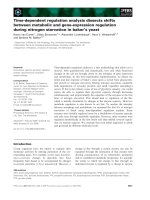
Figure 3: Fbflow architecture
Figure 2: How an HTTP request is served
Type Web Cache MF SLB Hadoop Rest we consider two distinct sources of data. The first, Fbflow,
constantly samples packet headers across Facebook’s entire
Web - 63.1 15.2 5.6 - 16.1 global network. The second, port mirroring, focuses on a
single machine (or rack) at a time, allowing us to collect
Cache-l - 86.6 5.9 - - 7.5 complete packet-header traces for a brief period of time at
particular locations within a single datacenter.
Cache-f 88.7 5.8 - - - 5.5
3.3.1 Fbflow
Hadoop - - - - 99.8 0.2
Fbflow is a production monitoring system that samples
Table 2: Breakdown of outbound traffic percentages for four packet headers from Facebook’s entire machine fleet. Its ar-
different host types chitecture, comprised of two main component types—agents
and taggers—is shown in Figure 3. Fbflow samples packets
atively small number of machines do not have a fixed role by inserting a Netfilter nflog target into every machine’s
and are dynamically repurposed. Facebook’s datacenters do iptable rules. The datasets we consider in this paper
not typically house virtual machines: each service runs on are collected with a 1:30,000 sampling rate. A user-level
a physical server. Moreover—and in contrast to previously Fbflow agent process on each machine listens to the nflog
studied datacenters [12]—to ease provisioning and manage- socket and parses the headers, extracting information such as
ment, racks typically contain only servers of the same role. source and destination IP addresses, port numbers, and pro-
tocol. These parsed headers—collected across all machines
3.2 Constituent services in Facebook’s datacenters—along with metadata such as ma-
chine name and capture time, are streamed to a small number
The organization of machines within a cluster—and even of taggers using Scribe [2], a log aggregation system.
a datacenter—is intimately related to the communication
patterns between the services they support. We introduce the Taggers, running on a subset of machines, read a portion
major services by briefly describing how an HTTP request is of the packet-header stream from Scribe, and further anno-
served by , shown in Figure 2. tate it with additional information such as the rack and clus-
ter containing the machine where the trace was collected,
When an HTTP query hits a Facebook datacenter, it ar- its autonomous system number, etc., by querying other data
rives at a layer-four software load balancer (SLB) [37]. The sources. Taggers then convert each annotated packet header
query is then redirected to one of the Web servers. Web into a JSON object and feed it into Scuba [3], a real-time
servers are largely stateless, containing no user data. They data analytics system. Samples are simultaneously stored
fetch data from the cache tier [15]. In case of a cache into Hive [38] tables for long-term analysis.
miss, a cache server will then fetch data from the database
tier. At the same time, the Web server may communi- 3.3.2 Port mirroring
cate with one or more backend machines to fetch objects
such as news stories and ads. Table 2 quantifies the rela- While Fbflow is a powerful tool for network monitor-
tive traffic intensity between different services by classify- ing and management, its sampling-based collection prohibits
ing the outbound traffic from four different servers—a Web certain types of data analysis. Specifically, in production
server, cache leader (cache-l), cache follower (cache-f), and use, it aggregates statistics at a per-minute granularity. In
Hadoop—based upon the role of the destination host. (The order to collect high-fidelity data, we deploy a number of
data is extracted from packet-header traces described in Sec- special-purpose trace collection machines within the data-
tion 3.3.2.) center that collect packet-header traces over short intervals.
In contrast to most service tiers, Hadoop nodes are not We deploy monitoring hosts in five different racks across
involved with serving end-user requests. Instead, Hadoop Facebook’s datacenter network, locating them in clusters
clusters perform offline analysis such as data mining. HDFS that host distinct services. In particular, we monitor a rack
and Hadoop MapReduce are the main applications running of Web servers, a Hadoop node, cache followers and lead-
on these servers. ers, and a Multifeed node. In all but one (Web) instance,
we collect traces by turning on port mirroring on the RSW
3.3 Data collection
Due to the scale of Facebook’s datacenters, it is imprac-
tical to collect complete network traffic dumps. Instead,
126
(ToR) and mirroring the full, bi-directional traffic for a sin- links between RSWs and CSWs, median utilization varies
gle server to our collection server. For the hosts we monitor, between 10–20% across clusters, with the busiest 5% of the
the RSW is able to mirror the selected ports without loss. In links seeing 23–46% utilization. These levels are higher
the case of Web servers, utilization is low enough that we are than most previously studied datacenters [12, Fig. 9], likely
able to mirror traffic from a rack of servers to our collection due to the disproportionate increase in edge-link technology
host. We did not measure database servers that include user (1→10 Gbps) vs. aggregation links (10→40 Gbps). The
data in this study. variance between clusters decreases, with the heaviest clus-
ters running 3× higher than lightly loaded ones. Utilization
Recording the packet traces using a commodity server is is higher still on links between CSWs and FC switches, al-
not entirely trivial, as tcpdump is unable to handle more though the differences between clusters are less apparent be-
than approximately 1.5 Gbps of traffic in our configuration. cause different clusters are provisioned with different num-
In order to support line-rate traces, we employ a custom ker- bers of uplinks depending on their demand. We examine link
nel module that effectively pins all free RAM on the server utilization at finer timescales in Section 6.
and uses it to buffer incoming packets. Our kernel mod-
ule extracts the packets immediately after the Ethernet driver 4.2 Locality and stability
hands the packets to the kernel to avoid any additional delay
or overhead. Once data collection is complete, the data is Prior studies have observed heavy rack locality in data-
spooled to remote storage for analysis. Memory restrictions center traffic. This behaviour seems in line with applications
on our collection servers limit the traces we collect in this that seek to minimize network utilization by leveraging data
fashion to a few minutes in length. locality, allowing for topologies with high levels of oversub-
scription. We examine the locality of Facebook’s traffic from
4. PROVISIONING a representative sampling of production systems across var-
ious times of the day.
The appropriate design, scale, and even technology of a
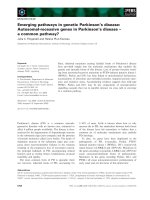
datacenter interconnect depends heavily on the traffic de- Figure 4 shows the breakdown of outbound traffic by des-
mands of the services it hosts. In this section, we quantify tination for four different classes of servers: a Hadoop server
the traffic intensity, locality, and stability across three dif- within a Hadoop cluster, a Web server in a Frontend cluster,
ferent types of clusters inside Facebook datacenters; in par- and both a cache follower and a cache leader from within the
ticular, we examine clusters supporting Hadoop, Frontend same Cache cluster. For each server, each second’s traffic
machines serving Web requests, and Cache. is represented as a stacked bar chart, with rack-local traffic
in cyan, the cluster-local traffic in blue, the intra-datacenter
Our study reveals that while Facebook’s Hadoop deploy- traffic in red, and inter-datacenter traffic in green.
ments exhibit behavior largely consistent with the literature,
the same cannot be said for clusters hosting Facebook’s other Among the four server types, Hadoop shows by far the
services. In particular, most traffic is not rack-local, yet most diversity—both across servers and time: some traces
locality patterns remain stable within and across both long show periods of significant network activity while others do
(multiple-day) and short (two-minute) time intervals. We not. While all traces show both rack- and cluster-level local-
define stable traffic as being close to constant (low devia- ity, the distribution between the two varies greatly. In one
tion from a baseline value) over a time interval, and slowly ten-minute-long trace captured during a busy period, 99.8%
changing across time intervals. Note that this definition is of all traffic sent by the server in Figure 4 is destined to other
dependent upon the length of the interval being considered; Hadoop servers: 75.7% of that traffic is destined to servers in
accordingly, we examine several different timescales. the the same rack (with a fairly even spread within the rack);
almost all of the remainder is destined to other hosts within
4.1 Utilization the cluster. Only a vanishingly small amount of traffic leaves
the cluster.
Given that Facebook has recently transitioned to 10-Gbps
Ethernet across all of their hosts, it is not surprising that In terms of dispersion, of the inter-rack (intra-cluster) traf-
overall access link (i.e., links between hosts and their RSW) fic, the Hadoop server communicates with 1.5% of the other
utilization is quite low, with the average 1-minute link uti- servers in the cluster—spread across 95% of the racks—
lization less than 1%. This comports with the utilization lev- though only 17% of the racks receive over 80% of the
els reported for other cloud-scale datacenters [12, 17]. De- server’s traffic. This pattern is consistent with that observed
mand follows typical diurnal and day-of-the-week patterns, by Kandula et al. [26], in which traffic is either rack-local or
although the magnitude of change is on the order of 2× as destined to one of roughly 1–10% of the hosts in the cluster.
opposed to the order-of-magnitude variation reported else-
where [12], Even the most loaded links are lightly loaded Hadoop’s variability is a consequence of a combina-
over 1-minute time scales: 99% of all links are typically less tion of job size and the distinct phases that a Hadoop job
than 10% loaded. Load varies considerably across clusters, undergoes—any given data capture might observe a Hadoop
where the average link utilization in the heaviest clusters node during a busy period of shuffled network traffic, or dur-
(Hadoop) is roughly 5× clusters with light load (Frontend). ing a relatively quiet period of computation.
As in other datacenters with similar structure [12, 13], uti- By way of contrast, the traffic patterns for the other server
lization rises at higher levels of aggregation. Focusing on the classes are both markedly more stable and dramatically dif-
ferent from the findings of Kandula et al. [26]. Notably,
only a minimal amount of rack-local traffic is present; even
127
4500 Inter-Datacenter 2500
4000 Intra-Datacenter 2000
3500 Intra-Cluster 1500
3000 Intra-Rack 1000
Mbps 2500 Mbps 500
0
2000
600
1500
1000 Inter-Datacenter
Intra-Datacenter
500 Intra-Cluster
Intra-Rack
0 20 40 60 80 100 20 40 60 80 100
Time (seconds) Time (seconds)
1000
800 500
Mbps 400
600
Mbps
300
400
200 Inter-Datacenter
Inter-Datacenter
200 Intra-Datacenter 100 Intra-Datacenter
Intra-Cluster Intra-Cluster
Intra-Rack Intra-Rack
0 20 40 60 80 100 0 20 40 60 80 100
Time (seconds) Time (seconds)
Figure 4: Per-second traffic locality by system type over a two-minute span: Hadoop (top left), Web server (top right), cache
follower (bottom left) and leader (bottom right) (Note the differing y axes)
inter-datacenter traffic is present in larger quantities. Fron- Locality All Hadoop FE Svc. Cache DB
tend cluster traffic, including Web servers and the atten-
dant cache followers, stays largely within the cluster: 68% Rack 12.9 13.3 2.7 12.1 0.2 0
of Web server traffic during the capture plotted here stays
within the cluster, 80% of which is destined to cache sys- Cluster 57.5 80.9 81.3 56.3 13.0 30.7
tems; the Multifeed systems and the SLB servers get 8%
each. While miscellaneous background traffic is present, the DC 11.9 3.3 7.3 15.7 40.7 34.5
volume of such traffic is relatively inconsequential.
Inter-DC 17.7 2.5 8.6 15.9 16.1 34.8
Cache systems, depending on type, see markedly different
localities, though along with Web servers the intra-rack lo- Percentage 23.7 21.5 18.0 10.2 5.2
cality is minimal. Frontend cache followers primarily send
traffic in the form of responses to Web servers (88%), and Table 3: Different clusters have different localities; last row
thus see high intra-cluster traffic—mostly servicing cache shows each cluster’s contribution to total network traffic
reads. Due to load balancing (see Section 5.2), this traffic
is spread quite widely; during this two-minute interval the 4.3 Traffic matrix
cache follower communicates with over 75% of the hosts in
the cluster, including over 90% of the Web servers. Cache In light of the surprising lack of rack locality and high
leaders maintain coherency across clusters and the backing degree of traffic stability, we examine traffic from the more
databases, engaging primarily in intra- and inter-datacenter long-term and zoomed-out perspective provided by Fbflow.
traffic—a necessary consequence of the cache being a "sin-
gle geographically distributed instance." [15] Table 3 shows the locality of traffic generated by all of
Facebook’s machines during a 24-hour period in January
The stability of these traffic patterns bears special men- 2015 as reported by Fbflow. Facebook’s traffic patterns re-
tion. While Facebook traffic is affected by the diurnal traffic main stable day-over-day—unlike the datacenter studied by
pattern noted by Benson et al. [12], the relative proportions Delimitrou et al. [17]. The clear majority of traffic is intra-
of the locality do not change—only the total amount of traf- cluster but not intra-rack (i.e., the 12.9% of traffic that stays
fic. Over short enough periods of time, the graph looks es- within a rack is not counted in the 57.5% of traffic labeled as
sentially flat and unchanging. In order to further investigate intra-cluster). Moreover, more traffic crosses between data-
the cause and particulars of this stability, we turn our atten- centers than stays within a rack.
tion to the traffic matrix itself.
Table 3 further breaks down the locality of traffic gener-
ated by the top-five cluster types which, together, account for
78.6% of the traffic in Facebook’s network. Hadoop clusters
generate the most traffic (23.7% of all traffic), and are sig-
nificantly more rack-local than others, but even its traffic is
far from the 40–80% rack-local reported in the literature [12,
128
107
106
105
104
103
102
101
1 3 1 7 6 5 100
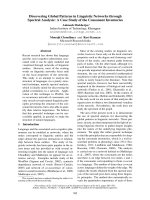
(a) Rack-to-rack, Hadoop cluster (b) Rack-to-rack, Frontend cluster (c) Cluster-to-cluster
Figure 5: Traffic demand by source (x axis) and destination (y axis). The graphs are each normalized to the lowest demand in
that graph type (i.e., the Hadoop and Frontend clusters are normalized to the same value, while the cluster-to-cluster graph is
normalized independently).
17]. Rather, Hadoop traffic is clearly cluster local. Frontend cluster (though hot objects are replicated to avoid hotspots,
(FE) traffic is cluster local by design, but not very rack-local, which we discuss in Section 5). Since each Web server needs
and the locality of a given rack’s traffic depends on its con- to be able to handle any request, they might need to access
stituent servers (e.g., Web server, Multifeed, or cache). data in a potentially random fashion due to load balancing.
This distinction is clearly visualized in Figure 5, gener- To make this argument more concrete, loading the Face-
ated in the style of Delimitrou et al. [17]. The two left por- book news feed draws from a vast array of different ob-
tions of the figure graph the relative traffic demands between jects in the social graph: different people, relationships, and
64 racks within clusters of two different types. While we events comprise a large graph interconnected in a compli-
show only a subset of the total set of racks in each cluster, cated fashion. This connectedness means that the working
the pattern is representative of the cluster as a whole. set is unlikely to reduce even if users are partitioned; the
net result is a low cache hit rate within the rack, leading
Traffic within the Hadoop cluster (left) is homogenous to high intra-cluster traffic locality. In addition, partition-
with a very strong diagonal (i.e., intra-rack locality). The ing the graph such that users and their data are co-located
cluster-wide uniformity outside the local rack accounts on racks has the potential to introduce failure modes which
for intra-cluster traffic representing over 80% of Hadoop disproportionately target subsets of the user base, leading to
traffic—even though traffic to the local rack dominates any a suboptimal experience.
given other rack in isolation. Map tasks are placed to maxi-
mize read locality, but there are a large number of concurrent The other three cluster types exhibit additional distinctive
jobs which means that it is possible that any given job will behaviors (not shown). Traffic in cache leader clusters, for
not fit entirely within a rack. Thus, some amount of traffic example, has very little intra-rack demand, instead spread-
would necessarily need to leave the rack during the shuffle ing the plurality of its traffic across the datacenter. Traffic in
and output phases of a MapReduce job. In addition, the clus- back-end database clusters is the most uniform, divided al-
ter serves data requests from other services which might not most evenly amongst nodes within the cluster, the same dat-
strive for as much read locality, which would also contribute acenter, and worldwide. Service clusters, which host racks
to reduced overall rack locality. supporting a variety of supporting services, exhibit a mixed
traffic pattern that lies between these extreme points.
The Frontend cluster (center) exhibits three different pat-
terns according to rack type, with none being particularly Inter-cluster communication varies considerably by clus-
rack-local. In particular, we see a strong bipartite traffic ter type. Figure 5c plots the traffic demand between 15
pattern between the Web servers and the cache followers in clusters within a single datacenter for the a 24-hour period.
Webserver racks that are responsible for most of the traffic, Hadoop clusters, for example, have a very small propor-
by volume, within the cluster. This pattern is a consequence tion of inter-cluster traffic, while cache leader clusters have
of placement: Web servers talk primarily to cache servers a large amount of inter-cluster traffic, split between cache
and vice versa, and servers of different types are deployed in followers in other clusters and database clusters. While each
distinct racks, leading to low intra-rack traffic. cluster may possess the same four-post structure internally, it
may make sense to consider heterogenous inter-cluster com-
This striking difference in Facebook’s locality compared munication fabrics, as demand varies over more than seven
to previously studied Internet-facing user-driven applica- orders of magnitude between cluster pairs.
tions is a consequence of the realities of serving a densely
connected social graph. Cache objects are replicated across While the 4-post cluster remains prevalent in Facebook
clusters; however, each object typically appears once in a datacenters, Facebook recently announced a new network
129
1.0 1.0 1.0
0.9 0.9 0.9
0.8 0.8 0.8
0.7 0.7 0.7
0.6 0.6 0.6
CDF 0.5 CDF 0.5 CDF 0.5
0.4 0.4 0.4
0.3 Intra-Rack Intra-Rack Intra-Rack
Intra-Cluster 0.3 Intra-Cluster 0.3 Intra-Cluster
Intra-Datacenter
0.2 Inter-Datacenter 0.2 Intra-Datacenter 0.2 Intra-Datacenter
All
0.1 0.1 Inter-Datacenter 0.1 Inter-Datacenter
All All
0.0 0.0 0.0
0.01 0.1 1 10 100 1000 10000 100000 1000000 0.01 0.1 1 10 100 1000 10000 100000 1000000 0.01 0.1 1 10 100 1000 10000 100000 1000000
Kilobytes Kilobytes Kilobytes
(a) Web servers (b) Cache follower (c) Hadoop
Figure 6: Flow size distribution, broken down by location of destination
1.0 1.0 1.0
0.9 0.9 Intra-Rack 0.9
Intra-Cluster
0.8 0.8 Intra-Datacenter 0.8
0.7 0.7 Inter-Datacenter 0.7
All
0.6 0.6 0.6
CDF 0.5 CDF 0.5 CDF 0.5
0.4 0.4 0.4
0.3 Intra-Rack 0.3 0.3 Intra-Rack
Intra-Cluster Intra-Cluster
0.2 Intra-Datacenter 0.2 0.2 Intra-Datacenter
0.1 Inter-Datacenter 0.1 0.1 Inter-Datacenter
All All
0.01 10 100 1000 10000 100000 1000000 0.01 10 100 1000 10000 100000 1000000 0.01 10 100 1000 10000 100000 1000000
Milliseconds Milliseconds Milliseconds
(a) Web servers (b) Cache follower (c) Hadoop
Figure 7: Flow duration distribution, broken down by location of destination
topology that is being implemented in datacenters going for- 5. TRAFFIC ENGINEERING
ward [9]. While servers are no longer grouped into clusters
physically (instead, they comprise pods where all pods in a Prior studies suggest that the stability of datacenter traf-
datacenter have high connectivity), the high-level logical no- fic depends on the timescale of observation. In this section,
tion of a cluster for server management purposes still exists we analyze Facebook’s traffic at fine timescales, with an eye
to ease the transition. Accordingly, the rack-to-rack traffic towards understanding how applicable various traffic engi-
matrix of a Frontend “cluster” inside one of the new Fabric neering and load balancing approaches might be under such
datacenters over a day-long period (not shown) looks similar conditions.
that shown in Figure 5.
5.1 Flow characteristics
4.4 Implications for connection fabrics
Figures 6 and 7 plot the size and duration, respectively,
The low utilization levels found at the edge of the network of flows (defined by 5-tuple) collected in 10-minute (2.5-
reinforce common practice of oversubscribing the aggrega- minute for the Web-server rack) packet traces of three differ-
tion and core of the network, although it remains to be seen ent node types: a Web-server rack, a single cache follower
whether utilization will creep up as the datacenters age. The (cache leader is similar to follower and not shown due to
highly contrasting locality properties of the different clus- space constraints), and a Hadoop node. We show the overall
ters imply a single homogenous topology will either be over- distribution (in black) as well as per-destination curves.
provisioned in some regions or congested in others—or both.
This reality argues that non-uniform fabric technologies that Consistent with the literature [26, Fig. 9], we find that
can deliver higher bandwidth to certain locations than others most flows in Facebook’s Hadoop cluster are short. As dis-
may find use. Researchers are exploring techniques to ame- cussed previously, the traffic demands of Hadoop vary sub-
liorate traffic hotspots. The stability of the traffic patterns we stantially across nodes and time. We plot the results from
observe, however, suggest that rapid reconfigurability may tracing one node over a relatively busy 10-minute interval;
not be as necessary as some have assumed. traces from other nodes or even the same node at different
times reveal somewhat different distributions, so we cau-
Somewhat surprisingly, the lack of significant levels of tion against examining the specific distribution too carefully.
intra-rack locality (except in the Hadoop cluster) hints that Even in the graphed interval, however, 70% of flows send
RSWs (i.e., top-of-rack switches) that deliver something less less than 10 KB and last less than 10 seconds; the median
than full non-blocking line-rate connectivity between all of flow sends less than 1 KB and lasts less than a second. Less
their ports may be viable. In particular, the bipartite traffic than 5% of the flows are larger than 1 MB or last longer than
pattern between end hosts and RSW uplinks may afford op- 100 seconds; almost none exceed our 10-minute trace.
timizations in switch design. We return to consider further
implications for switch design in Section 6. Conversely, traces from other service types are much
more representative due to load balancing. Moreover, many
of Facebook’s internal services use some form of connec-
130
1.0 1.0 1.0
0.9
0.9 0.8 0.9
0.7
0.8 0.6 0.8
0.5
0.7 0.4 0.7
0.3
0.6 0.2 0.6
CDF CDF 0.1
0.5 0.0 0.5
CDF
CDF0.41000.4
0.3 0.3
0.2 0.2
0.1 0.1
0.0 1000 0.0
0.01 0.1 1 10 100 1000 10000 100000 1000000 0.1 1 10
Kilobytes/second Kilobytes/second Proportion of Median
(a) Hadoop (rate, each series is 1 second) (b) Cache (rate, each series is 1 second) (c) Cache (stability, each series is a rack)
Figure 8: Per-destination-rack flow rate distribution (for both Hadoop and cache) and stability (cache).
1.0 opportunity for improvement. In the previous section, we
note that Facebook’s approach to load balancing is highly
0.9 effective on timescales lasting minutes to hours, leaving
less room for traffic engineering. We now consider traffic
0.8 characteristics over the course of a few seconds to deter-
mine whether traffic engineering might be effective on short
0.7 timescales.
0.6 We consider how the traffic from a host varies from one
second to next. We examine the distribution of flow rates,
0.5 aggregated by destination rack, per second over a two-
minute period and compare each second to the next. Intu-
0.4 itively, the better the load balancing, the closer one second
appears to the next.
Intra-Rack
We first examine the Hadoop cluster by looking at 120
0.3 Intra-Cluster consecutive 1-second intervals. Figure 8a plots a CDF of
per-destination-rack flow sizes for each interval (i.e., there
0.2 Intra-Datacenter are 120 separate curves). While we do not claim this par-
ticular server is representative, it does depict widely varying
Inter-Datacenter rates (i.e., more than three orders of magnitude) which are
0.1 common in our observations.
All In and of itself, this is unsurprising—Hadoop has peri-
ods of varying network traffic, and a production cluster is
0.0 likely to see a myriad jobs of varying sizes. It is this vari-
0.01 0.1 1 10 100 1000 10000 100000 1000000 ability of traffic that existing network traffic engineering
schemes seek to leverage. Orchestra [16] relies on tem-
Kilobytes poral and per-job variation to provide lower task comple-
tion times for high-priority tasks, while Hedera [5] pro-
Figure 9: Cache follower per-host flow size vides non-interfering route placement for high bandwidth
elephant flows that last for several seconds, which are preva-
tion pooling [29], leading to long-lived connections with lent within Hadoop workloads.
relatively low throughput. Pooling is especially prevalent
for cache follower(leader, not shown) nodes, where only A different story emerges for Frontend traffic, and the
30(40)% of flows are less than 100 seconds in length, with cache in particular. Recall from Table 2 that the largest
more than 40(25)% of flows exceeding our 10-minute cap- share of cache follower traffic are responses bound for Web
ture period. That said, most flows are active (i.e., actu- servers. Figure 8b shows the distribution of per-second flow
ally transmit packets) only during distinct millisecond-scale rates on a per-rack basis from a single cache follower node
intervals with large intervening gaps. In other words, re- to distinct Web server racks during a two minute period. The
gardless of flow size or length, flows tend to be internally distributions for each of the 120 seconds are similar, and all
bursty. In general cache flows are also significantly larger are relatively tight, i.e., the CDFs are fairly vertical about the
than Hadoop; Web servers lie somewhere in the middle. median of ≈2 Mbps. Similar patterns (albeit with different
scales) can be observed for other services as well.
If we consider higher levels of aggregation, i.e., group-
ing flows by destination host or rack, the distribution of flow From the viewpoint of a single host, each second is sim-
sizes simply shifts to the right for Web servers (retaining its ilar to the next. However, this analysis does not take per-
basic shape). The behavior is starkly different for cache fol- destination variation into consideration. It is conceivable
lowers, however: the wide flow-size distribution apparent at that there could exist consistently high- or low-rate destina-
a 5-tuple granularity (Figure 6b) disappears at host and rack
levels, replaced by a very tight distribution around 1 MB per
host (Figure 9). This arises as a consequence of the deci-
sion to load balance incoming user requests across all Web
servers, combined with the large number of user requests.
Since requests and responses are typically small (on the or-
der of a few kilobytes) we do not observe any imbalance
created by unequal response sizes.
5.2 Load balancing
Existing traffic engineering efforts seek to leverage vari-
ability of traffic; highly regular traffic does not provide much
131
1.0 Flows, 1-ms bin 1.0 Flows, 1-ms bin 1.0 Flows, 1-ms bin
0.9 Flows, 10-ms bin 0.9 Flows, 10-ms bin 0.9 Flows, 10-ms bin
0.8 Flows, 100-ms bin 0.8 Flows, 100-ms bin 0.8 Flows, 100-ms bin
0.7 Hosts, 1-ms bin 0.7 Hosts, 1-ms bin 0.7 Hosts, 1-ms bin
0.6 Hosts, 10-ms bin 0.6 Hosts, 10-ms bin 0.6 Hosts, 10-ms bin
0.5 Hosts, 100-ms bin 0.5 Hosts, 100-ms bin 0.5 Hosts, 100-ms bin
0.4 Racks, 1-ms bin 0.4 Racks, 1-ms bin 0.4 Racks, 1-ms bin
0.3 Racks, 10-ms bin 0.3 Racks, 10-ms bin 0.3 Racks, 10-ms bin
0.2 Racks, 100-ms bin 0.2 Racks, 100-ms bin 0.2 Racks, 100-ms bin
0.1 0.1 0.1
0.0 10.0 20.0 30.0 40.0 50.0 60.0 70.0 80.0 90.0 100.0 0.0 10.0 20.0 30.0 40.0 50.0 60.0 70.0 80.0 90.0 100.0 0.0 10.0 20.0 30.0 40.0 50.0 60.0 70.0 80.0 90.0 100.0
0.0 Heavy hitter stability between intervals (%) 0.0 Heavy hitter stability between intervals (%) 0.0 Heavy hitter stability between intervals (%)
CDF
CDF
CDF
(a) Cache follower (b) Cache leader (c) Web servers
Figure 10: Heavy-hitter stability as a function of aggregation for 1/10/100-ms time windows
tions that potentially could be treated differently by a traffic Type Number Size (Mbps)
engineering scheme. For each host, we consider outbound
traffic rates per destination rack (normalized to the median p10 p50 p90 p10 p50 p90
rate for that rack), and track the rate over time for each rack.
Figure 8c plots these distributions for the outbound traffic for f1 4 15 1.6 3.2 47.3
the same cache machine as Figure 8b. Each series represents Web h 1 4 14 1.6 3.3 48.1
a single destination; a near vertical series represents a desti- 3 9 1.7 4.6 48.9
nation rack where the rate does not deviate far from the me- r1 19 35 5.1 9.0 22.5
dian rate. We find that per-destination-rack flow sizes are re- f8 19 33 8.4 9.7 23.6
markably stable across not only seconds but intervals as long Cache (f) h 8 15 23 8.4 14.5 31.0
as 10 seconds (not shown) as well. All of the flows are within r7 16 48 2.6 3.3 408
a factor of two of their median size in approximately 90% f1 8 25 3.2 8.1 414
of the 1-second intervals—the median flow exhibits “signif- Cache (l) h 1 7 17 5 12.6 427
icant change” in only 45% of the 1-second intervals accord- r1 2 3 4.6 12.7 1392
ing to the 20% deviation cutoff defined by Benson et al. [14]. f1 2 3 4.6 12.7 1392
Contrast this to the traffic leaving a Hadoop node—which is Hadoop h 1 2 3 4.6 12.7 1392
not load balanced—where the middle 90% of flows can vary r1
in size by over six orders of magnitude compared to their
median size in the trace (not shown). Table 4: Number and size of heavy hitters in 1-ms intervals
for each of flow(f), host(h), and rack(r) levels of aggregation.
Such stability, both over time and by destination, is the
result of a combination of workload characteristics and en- fine a set of flows that we call heavy hitters, representing
gineering effort. To a cache system, the offered load per sec- the minimum set of flows (or hosts, or racks in the aggre-
ond is roughly held constant—large increases in load would gated case) that is responsible for 50% of the observed traf-
indicate the presence of relatively hot objects, which is ac- fic volume (in bytes) over a fixed time period. Intuitively,
tively monitored and mitigated. Bursts of requests for an ob- the presence of heavy hitters can signify an imbalance that
ject lead the cache server to instruct the Web server to tem- can be acted upon—if they are persistent for enough time,
porarily cache the hot object; sustained activity for the ob- and large enough compared other flows that treating them
ject leads to replication of the object or the enclosing shard differently makes a difference.
across multiple cache servers to help spread the load. We
note further that the request rate distribution for the top-50 Table 4 shows statistics regarding the number and size of
most requested objects on a cache server is close across all the heavy hitters that constitute 50% of the traffic in 1-ms
cache servers, and that the median lifespan for objects within intervals for each of the four server classes. Because we are
this list is on the order of a few minutes. Per-destination traf- interested in instantaneously large flows, we measure size
fic stability is again a consequence of user request multiplex- in terms of rate instead of number of bytes sent over the
ing across all available Web servers, coupled with relatively lifetime of the flow. Next, we consider the the lifespan of
small request/response pairs. heavy hitters, aggregated by 5-tuple, destination host and
rack, and measured across intervals of 1, 10 and 100 mil-
5.3 Heavy hitters liseconds. Figure 10 shows the fraction of the heavy hitters
that remain in subsequent time intervals. We do not show the
In this section, we examine the behavior of traffic at Hadoop nodes, as our heavy-hitter definition almost always
sub-second timescales to better understand its stability and results in the identification of 1–3 heavy hitters at each of
whether traffic engineering can apply. In particular, we wish flow, host, and rack aggregation levels across all three time
to see if certain flows (aggregated or not) stand out in terms intervals.
of rate, since such flows would provide the largest opportu-
nity for potential impact on network performance. We de- Heavy hitter persistence is low for individual flows (red):
in the median case, no more than roughly 15% of flows
persist regardless of the length of period, a consequence of
the internal burstiness of flows noted earlier. Host-level ag-
gregation (green) fares little better; with the exception of
132
CDF 1.0 Flows, 1-ms bin an upper bound on the effectiveness of traffic engineering—
0.9 Flows, 10-ms bin a significant amount of ephemeral heavy hitter traffic would
0.8 Flows, 100-ms bin go unseen and untreated by the TE scheme. Second, it serves
0.7 Hosts, 1-ms bin as an indicator of the difficulty of prediction in the first place;
0.6 Hosts, 10-ms bin if a one-second prediction interval is not sufficient, smaller
0.5 Hosts, 100-ms bin timescales (consuming more resources) may be needed. Fi-
0.4 Racks, 1-ms bin nally, this metric is an indicator of burstiness, as it indicates
0.3 Racks, 10-ms bin the presence of a large number of ephemeral heavy hitters.
0.2 Racks, 100-ms bin
0.1 Figure 11 plots a CDF of the fraction of a second’s
0.0 10.0 20.0 30.0 40.0 50.0 60.0 70.0 80.0 90.0 100.0 overall heavy hitters that are instantaneously heavy in each
Intersection of heavy hitters in an interval and enclosing second (%) 1/10/100-ms interval within the second. We show results for
0.0 a Web server and cache follower—cache leaders are similar.
At 5-tuple granularity, predictive power is quite poor, at less
(a) Web server than 10–15%. Rack-level predictions are much more effec-
tive, with heavy hitters remaining heavy in the majority of
1.0 100-ms intervals in the median case for both services. Host-
level predictions are more useful for Web servers than cache
0.9 nodes, but only the 100-ms case is more than 30% effective.
0.8 5.4 Implications for traffic engineering
0.7 Facebook’s extensive use of connection pooling leads to
long-lived flows that seem like potential candidates for traf-
CDF 0.6 Flows, 1-ms bin fic engineering. These same services use application-level
0.5 Flows, 10-ms bin load balancing to great effect, however, leaving limited room
0.4 Flows, 100-ms bin for in-network approaches. Many existing techniques work
0.3 Hosts, 1-ms bin by identifying heavy hitters and then treating them differ-
0.2 Hosts, 10-ms bin ently (e.g., provisioning a circuit, moving them to a lightly
0.1 Hosts, 100-ms bin loaded path, employing alternate buffering strategies, etc.).
0.0 Racks, 1-ms bin For any such scheme to work, however, it must be possible to
Racks, 10-ms bin first identify the heavy hitters, and then realize some benefit.
0.0 Racks, 100-ms bin
Unfortunately, it appears challenging to identify heavy
10.0 20.0 30.0 40.0 50.0 60.0 70.0 80.0 90.0 100.0 hitters in a number of Facebook’s clusters that persist with
Intersection of heavy hitters in an interval and enclosing second (%) any frequency. Moreover, even for the timescales and ag-
gregation levels where it is possible (e.g., rack-level flows
(b) Cache follower over intervals of 100-ms or larger), it is not clear there is
a great deal of benefit to be gained, as the heavy hitters
Figure 11: Intersection between heavy hitters in a subinter- are frequently not particularly heavy for the vast majority
val with enclosing second of the period. Previous work has suggested traffic engi-
neering schemes can be effective if 35% of traffic is pre-
destination-host-level aggregation for Web servers, no more dictable [14]; only rack-level heavy hitters reach that level
than 20% of heavy hitter hosts in a sub-second interval will of predictability for either Web or cache servers. This some-
persist as a heavy hitter in the next interval. Web servers what counter-intuitive situation results from a combination
have a higher rate over 100-millisecond periods since they of effective load balancing (which means there is little dif-
have a relatively small number of cache servers and load bal- ference in size between a heavy hitter and the median flow)
ancers with which they communicate, while cache servers and the relatively low long-term throughput of most flows,
converse with many different Web servers. meaning even heavy flows can be quite bursty internally.
It is not until considering rack-level flows (blue) that 6. SWITCHING
heavy hitters are particularly stable. In the median case,
over 40% of cache heavy hitters persist into the next 100- Finally, we study aspects of the traffic that bear directly on
ms interval, and almost 60% for Web servers. Heavy hitters top-of-rack switch design. In particular, we consider the size
from Web servers are more stable in general, with 32% of and arrival processes of packets, and the number of concur-
rack-level heavy hitters persisting in the median 1-ms inter- rent destinations for any particular end host. In addition, we
val case. Even so, heavy hitter persistence is not particularly examine the impact of burstiness over short timesales and its
favorable for traffic engineering. With a close to 50% chance impact on switch buffering.
of a given heavy hitter continuing in the next time period,
predicting a heavy hitter by observation is not much more 6.1 Per-packet features
effective than randomly guessing.
Figure 12 shows the distribution of packet sizes for each
Even if one could perfectly predict the heavy hitters on of the four host types. Overall, the median packet size is
a second-by-second timescale, it remains to consider how
useful that knowledge would be. We compare the heavy hit-
ters from enclosing one-second intervals to the instantaneous
heavy hitters from each of the subintervals within the second
to see what fraction of the heavy hitters in a subinterval are
heavy hitters across the entire enclosing second. A limited
degree of overlap implies three things: First, it establishes
133
1.0 1.0
0.9
0.9 0.8
0.7
0.8 0.6
0.5
0.7 0.4
0.3
0.6 0.2
0.1
CDF 0.5 CDF 0.0
0.4 10
0.3 Web Server Web Server
Hadoop
0.2 Hadoop Cache Leader
Cache Follower
0.1 Cache Leader
Cache Follower
0.00 200 400 600 800 1000 1200 1400 100 1000 10000 100000 1000000
Bytes SYN Interarrival (usec)
Figure 12: Packet size distribution Figure 14: Flow (SYN packet) inter-arrival
5 25 those reported in the literature [26, Fig. 11], but to vary-
ing degrees. Hadoop nodes and Web servers see an order-
Packets (x1000) 4 Packets (x1000) 20 of-magnitude increase in flow intensity relative to previous
reports—likely due at least in part to the 10× increase in
3 15 link rate—with median inter-arrival times of approximately
2 ms (i.e., more than 500 flows per second). Perhaps due
2 10 to connection pooling (which would decouple the arrival of
external user requests from the internal flow-arrival rate),
1 5 the distribution of inter-arrival times for flows at both types
of cache node are similar and longer: cache leaders see a
0 0 slightly higher arrival rate than followers, with median inter-
10 12 14 16 18 20 22 10 12 14 16 18 20 22 arrival timess of 3 and 8 ms, respectively.
Time (seconds) Time (seconds)
(a) 15 ms (b) 100 ms
Figure 13: Hadoop traffic is not on/off at 15 nor 100 ms
approximately 250 bytes, but that is significantly skewed by 6.3 Buffer utilization
Hadoop traffic. Hadoop traffic is bimodal: almost all packets
are either MTU length (1500 bytes for the servers we study) The combination of a lack of on/off traffic, higher flow
or TCP ACKs. Packets for the other services have a much intensity, and bursty individual flows suggests a potential in-
wider distribution, but the median packet size for all of them crease in buffer utilization and overruns. Despite low av-
is significantly less than 200 bytes, with only 5–10% of the erage link utilization, bursty traffic can still lead to unac-
packets fully utilizing the MTU. ceptable loss rates. Recent work at Facebook has led to the
development of in-house switching platforms [35], enabling
Thus, while link utilization is low, the packet rate is still us to gather buffer utilization statistics at fine granularity. In
high. For example, a cache server at 10% link utilization particular, we collect buffer occupancies over a 24-hour pe-
with a median packet size of roughly 175 bytes generates riod for switches connecting Web servers and cache nodes at
85% of the packet rate of a fully utilized link sending MTU- a 10-microsecond granularity. Figure 15a plots the median
sized packets. As a result, any per-packet operation (e.g., and maximum values per second for the entire period, nor-
VLAN encapsulation) may still be stressed in a way that the malized to the buffer size. In other words, a single point for
pure link utilization rate might not suggest at first glance. the median series represents the 50th-percentile buffer occu-
pancy during that second (out of 100,000 samples per sec-
6.2 Arrival patterns ond), normalized by the size of the buffer. We also plot the
normalized average link utilization (Figure 15b) and egress
Benson et al. observe that packet arrivals exhibit an on/off drop rate (Figure 15c) over the same period, sourced via
pattern at the end-host level [12, 13]. Hosts in Facebook’s fbflow and SNMP counters, respectively.
datacenter do not exhibit this behavior, even within Hadoop
clusters. Figure 13 shows a time series of traffic sent by a A few trends are apparent from our results. The first is that
Hadoop host (arriving at a RSW port) binned by 15- and standing buffer occupancies are non-trivial, and can be quite
100-ms intervals. (c.f. Benson et al.’s analogous graphs [13, high in the Web-server case. Even though link utilization
Figure 5] and [12, Figure 6]). If one considers traffic on is on the order of 1% most of the time, over two-thirds of
a per-destination host basis, on/off behavior remerges (not the available shared buffer is utilized during each 10-µs in-
shown), suggesting its disappearance may be due to a large terval. Diurnal variation exists in buffer occupancies, utiliza-
number of concurrent destinations. tion and drop rate, highlighting the correlation between these
metrics over time. Even with the diurnal trafic pattern, how-
Figure 14 plots the CDF of inter-arrival times between ever, the maximum buffer occupancy in the Web-server rack
outgoing TCP flows at each of the four types of servers we approaches the configured limit for roughly three quarters
study. While a significant amount of traffic is routed over of the 24-hour period. While link utilization is roughly cor-
long-lived pooled connections, as is the case for request-
response traffic between Web servers and cache followers,
ephemeral flows do exist. The inter-arrival periods for flows
emanating from all four classes of host are shorter than
134
100 of flows, in the size of packets, or both. Either will have
impacts on buffer utilization: larger packets with the same
Web rack maximum level of burstiness will use up more of the buffer, while a
larger number of flows leads to a greater chance of multiple
Cache rack maximum flows sending bursts of packets simultaneously. Thus, care-
ful buffer tuning is likely to be important moving forward.
Relative Buffer Occupancy Fraction 10−1 Cache rack median
6.4 Concurrent flows
Web rack median
We consider concurrent to mean existing within the same
10−2 5-ms window (c.f. the 50-ms window considered by Al-
izadeh et al. while measuring a datacenter of hosts connected
10−3 with 1-Gbps Ethernet [8]). We find that Web servers and
cache hosts have 100s to 1000s of concurrent connections (at
10−4 the 5-tuple level), while Hadoop nodes have approximately
25 concurrent connections on average—corresponding quite
10−5 0 10000 20000 30000 40000 50000 60000 70000 80000 well with the findings of Alizadeh et al. [8, Figure 5]. That
Seconds said, switches are obviously less concerned with individual
connections than destination ports. If we group connections
(a) Normalized buffer occupancy, 10-microsecond resolution destined to the same host, the numbers reduce only slightly
(by at most a factor of two)—and not at all in the case of
1.0 Hadoop.
Utilization (Normalized to highest observed) 0.9 Given the general lack of intra-rack traffic, almost all
flows will traverse an up-link port. Hence, it is perhaps more
0.8 interesting to consider flows at the rack level—i.e., consid-
ering the number of different racks with which an individ-
0.7 ual host is communicating. Figure 16 shows the number of
concurrent flows sent by a single host over a 5-ms interval
0.6 to different classes of destination hosts for three different
host types: cache follower, cache leader, Web server. Cache
Cache Rack followers communicate with 225–300 different racks, while
leaders talk to 175–350. In the median interval, both types
0.5 of cache nodes communicate with approximately 250 other
racks—the location of the racks varies dramatically as dis-
Web Server Rack cussed previously, however. Web servers communicate with
10–125 racks concurrently, 50 in the median interval.
0.4
Some proposed switch designs [25, 30] employ different
0.3 technologies for large flows. Hence, we restrict our focus to
the heavy hitter racks, namely those destination racks that
0.2 constitute the majority of the traffic. The median number of
heavy-hitter racks is 6–8 for Web servers and cache leaders
0.1 with an effective max of 20–30, while the cache follower
has 29 heavy hitter racks in the median case and up to 50
0.00 10000 20000 30000 40000 50000 60000 70000 80000 in the tail. Due to the differences in locality, Web servers
Seconds and cache followers have very few rack-level heavy hitters
of their cluster, while the cache leader displays the opposite
(b) Link utilization, 10-minute average pattern. Even considering only heavy hitter racks, the num-
ber of concurrent destinations is still significantly larger than
1.0 that reported by Alizadeh et al. [8]. In addition, the relative
impermanence of our heavy hitters suggests that, for Fron-
0.9 tend clusters at least, hybrid circuit-based approaches may
be challenging to employ.
0.8
7. CONCLUSION
Egress Drops (Normalized) 0.7
Facebook’s datacenter network supports a variety of dis-
0.6 tinct services that exhibit different traffic patterns. We find
that several deviate substantially from the services consid-
0.5 ered in the literature. The different applications, combined
0.4
0.3
0.2
0.1
0.00 10000 20000 30000 40000 50000 60000 70000 80000
Seconds
(c) Web rack egress drops, 15-minute average
Figure 15: Correlating buffer occupancy, link utilization and
packet drops in Web server and Cache racks
related with buffer occupancy within the Web-server rack,
utilization by itself is not a good prediction of buffer require-
ments across different applications. In particular, the Cache
rack has higher link utilization, but much lower buffer uti-
lization and drop rates (not shown).
These buffer utilization levels occur despite relatively
small packet sizes (Section 6.1). As utilization increases in
the future, it might be through an increase in the number
135
1.0 1.0 1.0
0.9 0.9 0.9
0.8 0.8 0.8
0.7 0.7 0.7
0.6 0.6 0.6
CDF 0.5 CDF 0.5 CDF 0.5
0.4 0.4 0.4
0.3 Intra-Cluster 0.3 Intra-Cluster 0.3 Intra-Cluster
0.2 Intra-Datacenter 0.2 Intra-Datacenter 0.2 Intra-Datacenter
0.1 Inter-Datacenter 0.1 Inter-Datacenter 0.1 Inter-Datacenter
All All All
0.00.0 50 100 150 200 250 300 350 400 0.00.0 50 100 150 200 250 300 350 400 0.00.0 50 100 150 200 250 300 350 400
Number of racks in 5 ms Number of racks in 5 ms Number of racks in 5 ms
(a) Web server (b) Cache follower (c) Cache leader
Figure 16: Concurrent (5-ms) rack-level flows
CDF 1.0 CDF 1.0 CDF 1.0
0.9 0.9 0.9
0.8 Intra-Cluster 0.8 Intra-Cluster 0.8 Intra-Cluster
0.7 Intra-Datacenter 0.7 Intra-Datacenter 0.7 Intra-Datacenter
0.6 Inter-Datacenter 0.6 Inter-Datacenter 0.6 Inter-Datacenter
0.5 All 0.5 All 0.5 All
0.4 0.4 0.4
0.3 10 20 30 40 50 0.3 10 20 30 40 50 0.3 10 20 30 40 50
0.2 Number of rack in 5 ms 0.2 Number of rack in 5 ms 0.2 Number of rack in 5 ms
0.1 0.1 0.1
0.0 0.0 0.0
0.0 0.0 0.0
(a) Web server (b) Cache follower (c) Cache leader
Figure 17: Concurrent (5-ms) heavy-hitter racks
with the scale (hundreds of thousands of nodes) and speed ious Facebook services. Finally, and most significantly,
(10-Gbps edge links) of Facebook’s datacenter network re- Omar Baldonado catalyzed and faciliated the collaboration
sult in workloads that contrast in a number of ways from that enabled this study.
most previously published datasets. Space constraints pre-
vent us from providing an exhaustive account; we describe 8. REFERENCES
features that may have implications for topology, traffic en-
gineering, and top-of-rack switch design. [1] An open network operating system. .
[2] Scribe (archived). /> Our methodology imposes a few limitations on the scope [3] L. Abraham, J. Allen, O. Barykin, V. Borkar, B. Chopra,
of this study. Using end hosts to capture and timestamp
packets introduces scheduler-based variations on timestamp C. Gerea, D. Merl, J. Metzler, D. Reiss, S. Subramanian, J. L.
accuracy. In addition, we can only capture traffic from a few Wiener, and O. Zed. Scuba: Diving into data at Facebook.
hosts at a time without risking drops in packet collection. To- Proc. VLDB Endow., 6(11):1057–1067, Aug. 2013.
gether, these constraints prevent us from evaluating effects [4] M. Al-Fares, A. Loukissas, and A. Vahdat. A scalable,
like incast or microbursts, which are noted as being contrib- commodity, data center network architecture. In Proc. ACM
utors to poor application performance [24]. Further, per-host SIGCOMM, Aug. 2008.
packet dumps are necessarily anecdotal and ad hoc, relying [5] M. Al-Fares, S. Radhakrishnan, B. Raghavan, N. Huang, and
on the presence of an unused capture host on the same rack A. Vahdat. Hedera: Dynamic flow scheduling for data center
as the target. While Fbflow is deployed datacenter-wide, networks. In Proc. USENIX NSDI, Apr. 2010.
the sheer amount of measurement data it provides presents [6] A. Alameldeen, M. Martin, C. Mauer, K. Moore, X. Min,
another challenge—specifically, one of data processing and M. Hill, D. Wood, and D. Sorin. Simulating a $2M
retention—which limits the resolution at which it can oper- commercial server on a $2K PC. IEEE Computer,
ate. We thus view effective network monitoring and analysis 36(2):50–57, Feb. 2003.
to be an ongoing and constantly evolving problem. [7] M. Alizadeh, T. Edsall, S. Dharmapurikar, R. Vaidyanathan,
K. Chu, A. Fingerhut, V. T. Lam, F. Matus, R. Pan, N. Yadav,
Acknowledgements and G. Varghese. Conga: Distributed congestion-aware load
balancing for datacenters. In Proc. ACM SIGCOMM, Aug.
This work is supported in part by the National Science Foun- 2014.
dation through grants CNS-1314921 and CSR-1018808. [8] M. Alizadeh, A. Greenberg, D. A. Maltz, J. Padhye, P. Patel,
We are indebted to Theo Benson, Nick McKeown, Remzi B. Prabhakar, S. Sengupta, and M. Sridharan. Data center
Arpaci-Dusseau, our shepherd, Srikanth Kandula, and the TCP (DCTCP). In Proc. ACM SIGCOMM, Aug. 2010.
anonymous reviewers for their comments and suggestions [9] A. Andreyev. Introducing data center fabric, the
on earlier drafts of this manuscript. Petr Lapukhov, Michal next-generation Facebook data center network.
Burger, Sathya Narayanan, Avery Ching and Vincent Liu 2014.
provided invaluable insight into the inner workings of var- [10] B. Atikoglu, Y. Xu, E. Frachtenberg, S. Jiang, and
M. Paleczny. Workload analysis of a large-scale key-value
store. In Proc. ACM SIGMETRICS/Performance, June 2012.
[11] L. A. Barroso, J. Clidaras, and U. Hölzle. The Datacenter as
a Computer:An Introduction to the Design of
136
Warehouse-Scale Machines. Morgan & Claypool, 2nd R. Chaiken. The nature of data center traffic: Measurements
edition, 2013. & analysiss. In Proc. ACM IMC, Nov. 2009.
[12] T. Benson, A. Akella, and D. A. Maltz. Network traffic [27] R. Kapoor, A. C. Snoeren, G. M. Voelker, and G. Porter.
characteristics of data centers in the wild. In Proc. ACM Bullet trains: A study of NIC burst behavior at microsecond
IMC, 2010. timescales. In Proc. ACM CoNEXT, Dec. 2013.
[13] T. Benson, A. Anand, A. Akella, and M. Zhang. [28] T. Koponen, M. Casado, N. Gude, J. Stribling, L. Poutievski,
Understanding data center traffic charachteristics. In Proc. M. Zhu, R. Ramanathan, Y. Iwata, H. Inoue, T. Hama, and
ACM SIGCOMM WREN, Aug. 2009. S. Shenker. Onix: A distributed control platform for
large-scale production networks. In Proc. USENIX OSDI,
[14] T. Benson, A. Anand, A. Akella, and M. Zhang. MicroTE: 2010.
Fine grained traffic engineering for data centers. In Proc.
ACM CoNEXT, Dec. 2011. [29] A. Likhtarov, R. Nishtala, R. McElroy, H. Fugal,
A. Grynenko, and V. Venkataramani. Introducing mcrouter:
[15] N. Bronson, Z. Amsden, G. Cabrera, P. Chakka, P. Dimov, A memcached protocol router for scaling memcached
H. Ding, J. Ferris, A. Giardullo, S. Kulkarni, H. Li, deployments.
M. Marchukov, D. Petrov, L. Puzar, Y. J. Song, and Sept.
V. Venkataramani. TAO: Facebook’s distributed data store 2014.
for the social graph. In Proc. USENIX ATC, June 2013.
[30] H. Liu, F. Lu, A. Forencich, R. Kapoor, M. Tewari, G. M.
[16] M. Chowdhury, M. Zaharia, J. Ma, M. I. Jordan, and Voelker, G. Papen, A. C. Snoeren, and G. Porter. Circuit
I. Stoica. Managing data transfers in computer clusters with switching under the radar with REACToR. In Proc. USENIX
orchestra. In Proceedings of the ACM SIGCOMM 2011 NSDI, Apr. 2014.
Conference, SIGCOMM ’11, pages 98–109, New York, NY,
USA, 2011. ACM. [31] R. Mack. Building timeline: Scaling up to hold your life
story. />[17] C. Delimitrou, S. Sankar, A. Kansal, and C. Kozyrakis. 10150468255628920, Jan. 2012.
ECHO: Recreating network traffic maps for datacenters with
tens of thousands of servers. In Proc. IEEE International [32] B. Pfaff, J. Pettit, T. Koponen, K. Amidon, M. Casado, and
Symposium on Workload Characterization, Nov. 2012. S. Shenker. Extending networking into the virtualization
layer. In Proc. ACM HotNets, 2009.
[18] D. Ersoz, M. S. Yousif, and C. R. Das. Characterizing
network traffic in a cluster-based, multi-tier data center. In [33] L. Popa, S. Ratnasamy, G. Iannaccone, A. Krishnamurthy,
Proc. IEEE International Conference on Distributed and I. Stoica. A cost comparison of datacenter network
Computing Systems, June 2007. architectures. In Proc. ACM CoNEXT, Dec. 2010.
[19] N. Farrington and A. Andreyev. Facebook’s data center [34] R. Sherwood, G. Gibb, K.-K. Yap, G. Appenzeller,
network architecture. In Proc. IEEE Optical Interconnects, M. Casado, N. McKeown, and G. Parulkar. Can the
May 2013. production network be the testbed? In Proc. USENIX OSDI,
2010.
[20] N. Farrington, G. Porter, S. Radhakrishnan, H. Bazzaz,
V. Subramanya, Y. Fainman, G. Papen, and A. Vahdat. [35] A. Simpkins. Facebook open switching system (fboss) and
Helios: A hybrid electrical/optical switch architecture for wedge in the open.
modular data centers. In Proc. ACM SIGCOMM, Aug. 2010. /> facebook-open-switching-system-fboss-and-wedge-in-the-open/,
[21] A. Greenberg, J. R. Hamilton, N. Jain, S. Kandula, C. Kim, 2015.
P. Lahiri, D. A. Maltz, P. Patel, and S. Sengupta. VL2: A
scalable and flexible data center network. In Proc. ACM [36] A. Singla, C.-Y. Hong, L. Popa, and P. B. Godfrey. Jellyfish:
SIGCOMM, Aug. 2009. Networking data centers randomly. In Proc. USENIX NSDI,
Apr. 2012.
[22] N. Gude, T. Koponen, J. Pettit, B. Pfaff, M. Casado,
N. McKeown, and S. Shenker. NOX: Towards an operating [37] D. Sommermann and A. Frindell. Introducing Proxygen,
system for networks. SIGCOMM CCR, 38(3), July 2008. Facebook’s C++ HTTP framework.
2014.
[23] C. Guo, G. Lu, D. Li, H. Wu, X. Zhang, Y. Shi, C. Tian,
Y. Zhang, and S. Lu. BCube: A high performance, [38] A. Thusoo, J. S. Sarma, N. Jain, Z. Shao, P. Chakka,
server-centric network architecture for modular data centers. N. Zhang, S. Antony, H. Liu, and R. Murthy. Hive – a
In Proc. ACM SIGCOMM, Aug. 2009. petabyte scale data warehouse using Hadoop. In Proc. IEEE
ICDE, Mar. 2010.
[24] V. Jalaparti, P. Bodik, S. Kandula, I. Menache, M. Rybalkin,
and C. Yan. Speeding up distributed request-response [39] G. Wang, D. G. Andersen, M. Kaminsky, K. Papagiannaki,
workflows. In Proceedings of the ACM SIGCOMM 2013 T. S. E. Ng, M. Kozuch, and M. Ryan. c-Through: Part-time
Conference on SIGCOMM, SIGCOMM ’13, pages 219–230, optics in data centers. In Proc. ACM SIGCOMM, Aug. 2010.
New York, NY, USA, 2013. ACM.
[40] X. Zhou, Z. Zhang, Y. Zhu, Y. Li, S. Kumar, A. Vahdat, B. Y.
[25] S. Kandula, J. Padhye, and P. Bahl. Flyways to de-congest Zhao, and H. Zheng. Mirror mirror on the ceiling: Flexible
data center networks. In Proc. ACM HotNets, Oct. 2009. wireless links for data centers. In Proc. ACM SIGCOMM,
Aug. 2012.
[26] S. Kandula, S. Sengupta, A. Greenberg, P. Patel, and
137