FINGERPRINTS IN THE OPTICAL AND TRANSPORT PROPERTIES OF QUANTUM DOTS ppt
Bạn đang xem bản rút gọn của tài liệu. Xem và tải ngay bản đầy đủ của tài liệu tại đây (19.66 MB, 478 trang )
FINGERPRINTS IN
THE OPTICAL AND
TRANSPORT PROPERTIES
OF QUANTUM DOTS
Edited by Ameenah Al-Ahmadi
Fingerprints in the Optical and Transport Properties of Quantum Dots
Edited by Ameenah Al-Ahmadi
Published by InTech
Janeza Trdine 9, 51000 Rijeka, Croatia
Copyright © 2012 InTech
All chapters are Open Access distributed under the Creative Commons Attribution 3.0
license, which allows users to download, copy and build upon published articles even for
commercial purposes, as long as the author and publisher are properly credited, which
ensures maximum dissemination and a wider impact of our publications. After this work
has been published by InTech, authors have the right to republish it, in whole or part, in
any publication of which they are the author, and to make other personal use of the
work. Any republication, referencing or personal use of the work must explicitly identify
the original source.
As for readers, this license allows users to download, copy and build upon published
chapters even for commercial purposes, as long as the author and publisher are properly
credited, which ensures maximum dissemination and a wider impact of our publications.
Notice
Statements and opinions expressed in the chapters are these of the individual contributors
and not necessarily those of the editors or publisher. No responsibility is accepted for the
accuracy of information contained in the published chapters. The publisher assumes no
responsibility for any damage or injury to persons or property arising out of the use of any
materials, instructions, methods or ideas contained in the book.
Publishing Process Manager Molly Kaliman
Technical Editor Teodora Smiljanic
Cover Designer InTech Design Team
First published June, 2012
Printed in Croatia
A free online edition of this book is available at www.intechopen.com
Additional hard copies can be obtained from
Fingerprints in the Optical and Transport Properties of Quantum Dots,
Edited by Ameenah Al-Ahmadi
p. cm.
ISBN 978-953-51-0648-7
Contents
Preface IX
Section 1 Optical Properties of Quantum Dot Systems 1
Chapter 1 InAs Quantum Dots of Engineered
Height for Fabrication of Broadband
Superluminescent Diodes 3
S. Haffouz and P.J. Barrios
Chapter 2 Influence of Optical Phonons on Optical Transitions in
Semiconductor Quantum Dots 29
Cheche Tiberius and Emil Barna
Chapter 3 Temperature-Dependent Optical Properties of
Colloidal IV-VI Quantum Dots, Composed of
Core/Shell Heterostructures with Alloy Components 63
Efrat Lifshitz, Georgy I. Maikov,
Roman Vaxenburg, Diana Yanover,
Anna Brusilovski, Jenya Tilchin and Aldona Sashchiuk
Chapter 4 Optical Properties of
Spherical Colloidal Nanocrystals 91
Giovanni Morello
Chapter 5 Molecular States of Electrons: Emission of Single
Molecules in Self-Organized InP/GaInP Quantum Dots 125
Alexander M. Mintairov,
James L. Merz and Steven A. Blundell
Chapter 6 InAs Quantum Dots in
Symmetric InGaAs/GaAs Quantum Wells 153
Tetyana V. Torchynska
Chapter 7 Photoionization Cross Sections of
Atomic Impurities in Spherical Quantum Dots 181
C.Y. Lin and Y.K. Ho
Chapter 8 Exciton States in Free-Standing and
Embedded Semiconductor Nanocrystals 199
Yuriel Núñez Fernández, Mikhail I. Vasilevskiy,
Erick M. Larramendi and Carlos Trallero-Giner
Chapter 9 In-Gap State of
Lead Chalcogenides Quantum Dots 219
Xiaomei Jiang
Chapter 10 Exciton Dynamics in
High Density Quantum Dot Ensembles 231
Osamu Kojima
Section 2 Transport and Eletronics
Properties of Quantum Dot Systems 245
Chapter 11 Electron Transport Properties of
Gate-Defined GaAs/Al
x
Ga
1-x
As Quantum Dot 247
Dong Ho Wu and Bernard R. Matis
Chapter 12 Tunneling Atomic Force Microscopy of
Self-Assembled In(Ga)As/GaAs Quantum
Dots and Rings and of GeSi/Si(001) Nanoislands 273
Dmitry Filatov, Vladimir Shengurov,
Niyaz Nurgazizov, Pavel Borodin and Anastas Bukharaev
Chapter 13 Quantum Injection Dots 299
Eliade Stefanescu
Chapter 14 Quantum Mechanics of
Semiconductor Quantum Dots and Rings 333
I. Filikhin, S.G. Matinyan and B. Vlahovic
Chapter 15 Non-Equilibrium Green Functions of Electrons in
Single-Level Quantum Dots at Finite Temperature 371
Nguyen Bich Ha
Chapter 16 Electron Scattering Through a Quantum Dot 401
Leonardo Kleber Castelano, Guo-Qiang Hai and Mu-Tao Lee
Chapter 17 Coherent Spin Dependent Transport in QD-DTJ Systems 425
Minjie Ma, Mansoor Bin Abdul Jalil and Seng Ghee Tan
Chapter 18 The Thermopower of a
Quantum Dot Coupled to Luttinger Liquid System 447
Kai-Hua Yang, Yang Chen, Huai-YuWang and Yan-JuWu
Preface
Quantum dots are one of the most promising types of nanoparticles, which are
exceptionally useful for variety of new applications because of their unique properties.
This is a collaborative book sharing and providing the academic community with a
base text that could serve as a reference in research by presenting up-to-date research
work on the field of quantum dot systems. We are most grateful to all authors of the
chapters for highlighting the important issue of the potential applications of quantum
dot system with a high quality work of their research. We are especially thankful for
the cooperation and support from InTech team who helped in publishing this book, in
particular the publishing process manager of this book, Ms. Molly Kaliman for her
hard effort and patience during the process of publishing the book.
“To my son Azuz”
Ameenah N. Al-Ahmadi, PhD
Associate Professor of Physics
Faculty of Apllied Science, Umm Al-Qura University,
KSA
Section 1
Optical Properties of Quantum Dot Systems
1
InAs Quantum Dots of Engineered
Height for Fabrication of Broadband
Superluminescent Diodes
S. Haffouz and P.J. Barrios
Institute for Microstructural Sciences, National Research Council of Canada,
Ottawa, Ontario,
Canada
1. Introduction
Superluminescent diodes (SLDs) are of great interest as optical sources for various field
applications like fibre-optic gyroscopes (Culter et al, 1980), optical time-domain
reflectometry (Takada et al, 1987), sensing systems (Burns et al, 1983) (such as Faraday-effect
electric current sensors and distributed Bragg-grating sensor systems) and short and
medium distance optical communication systems (Friebele & Kersey, 1994). One of the most
attractive applications of SLDs has emerged after the successful demonstration of the optical
coherence tomography (OCT) technique, and identification of its advantages compared to
other imaging techniques in medical research and clinical practices. OCT is a real time and
non-invasive imaging technique that uses low-coherence light to generate resolution down
to the sub-micron-level, two- or three-dimensional cross-sectional images of materials and
biological tissues. The earliest version of the OCT imaging technique was demonstrated in
1991 by Huang and co-workers (Huang et al, 1991), by probing the human retina ex vivo.
Imaging was performed with 15µm axial resolution in tissue using a light source with a
central wavelength of 830nm. Two years later, in vivo retinal images were reported
independently by Fercher et al. (Fercher et al, 1993) and Swanson et al (Swanson et al, 1993).
Although 800nm OCT systems can resolve all major microstructural layers of tissues, image
quality can be severally degraded by light scattering phenomena. In low-coherence
interferometry, the axial resolution is given by the width of the field autocorrelation
function, which is inversely proportional to the bandwidth of the light source. In other
words, light sources with broadband spectra are required to achieve high axial resolution.
Although at longer wavelengths the bandwidth requirement increases, there is a significant
advantage in using light sources of longer central wavelengths for which the light scattering
is significantly reduced.
In recent few years, broadband light sources around 1m have received considerable
attention for their use in medical imaging technologies. It is due to the optimal compromise
between water absorption and human tissue scattering that the 1000-1100 nm wavelength
range has been proposed, and demonstrated, to be more suitable for OCT applications as
compared to those that use a light source with a central wavelength of 800nm (Pavazay et al,
Fingerprints in the Optical and Transport Properties of Quantum Dots
4
2003; Pavazay et al, 2007). There are a myriad of choices in selecting such OCT light sources
i) femtosecond or fiber lasers that are dispersed to produce super-continuum light and
swept source lasers (Hartl et al, 2001; Wang et al, 2003), ii) thermal sources, and iii)
superluminescent diodes (Sun et al, 1999; Liu et al, 2005; Lv et al, 2008; Haffouz et al, 2010).
Although the reported OCT tomograms with the highest axial resolution (1.8m) were so far
achieved in research laboratories with a photonic crystal fibre based source (Wang et al,
2003), superluminescent diodes are considerably lower in cost and complexity as well as
being smaller in size, which makes them more attractive for mass production.
Superluminescent diodes utilizing quantum-dots (QDs) in the active region are considered
to be excellent candidates as light source for an OCT systems. The naturally wide
dimensional fluctuations of the self-assembled quantum dots, grown by the Stranski-
Krastanow mode, are very beneficial for broadening the gain spectra which enhances the
spectral width of the SLDs. On the other hand, the three-dimensional carrier confinement
provided by the dots’ shape results in high radiative efficiency required for the OCT
applications.
In this chapter the main governing factors to demonstrate ultrahigh-resolution OCT-based
imaging tomographs will be reviewed in the second section. Research advances in the
growth processes for engineering the gain spectrum of the quantum dots-based
superluminescent diodes will be summarized in the third section of this chapter. Our
approach for engineering the bandwidth of multiple stacks of InAs/GaAs QDs will be
presented in the fourth section and demonstration of an ultra wide broadband InAs/GaAs
quantum-dot superluminescent diodes (QD-SLDs) will be then reported in the last section of
this chapter. Our approach is based on the use of SLDs where the broad spectrum is
obtained by a combination of slightly
shifted amplified spontaneous emission (ASE) spectra
of few layers of dots of different heights. Spectral shaping and bandwidth optimization
have
been achieved and resulted in 3dB-bandwidth as high as ~190nm at central wavelength of
1020nm. An axial resolution of 2.4µm is calculated from our QD-SLDs.
2. Superluminescent diodes for ultrahigh-resolution optical coherence
tomography (UHR-OCT)
Since its invention in the early 1990s (Huang et al, 1991), OCT enables non-invasive optical
biopsy. OCT is a technique that provides in-situ imaging of biological tissue with a
resolution approaching that of histology but without the need to excise and process
specimens. OCT has had the most clinical impact in ophthalmology, where it provides
structural and quantitative information that can not be obtained by any other modality.
Cross-sectional images are generated by measuring the magnitude and echo time delay of
backscattered light using the low-coherence interferometry technique. The earliest versions
of OCT have provided images with an axial resolution of 10-15µm. OCT has then evolved
very quickly, with two-dimensional (2D) and three-dimensional (3D) microstructural
images of considerably improved axial resolution being reported (Drexler et al, 1999). These
ultrahigh-resolution OCT systems (UHR-OCT) enable superior visualization of tissue
microstructure, including all intraretinal layers in ophthalmic applications as well as cellular
resolution OCT imaging in nontransparent tissues. The performance of an OCT system is
mainly determined by its longitudinal (axial) resolution, transverse resolution, dynamic
range (sensitivity) and data acquisition speed. Other decisive factors like depth penetration
InAs Quantum Dots of Engineered Height for Fabrication of Broadband Superluminescent Diodes
5
into the investigated tissue (governed by scattering, water absorption) and image contrast
need to be carefully addressed. In addition, for field application, compactness, stability, and
overall cost of the OCT system should be considered.
2.1 Factors governing OCT imaging performance
In this section we will review the key parameters that are directly or closely related to the
light source used in the OCT technique. Other limiting factors, related to other optical,
electronic and/or mechanical components can affect the resolution in OCT system when not
properly addressed. For more details regarding OCT technology and applications, please
refer to the book edited by Drexler and Fujimoto (Drexler & Fujimoto, 2008).
2.1.1 Transverse and axial resolution
As in conventional microscopy, the transverse resolution and the depth of focus are
determined by the focused transverse sport size, defined as the
2
1/e beam waist of a
Gaussian beam. Assuming Gaussian rays and only taking into account Gaussian optics, the
transverse resolution can be defined by:
4
f
x
d
(1)
where
f
is the focal length of the lens, d is the spot size of the objective lens and
is the
central wavelength of the light source. Finer transverse resolution can be achieved by
increasing the numerical aperture that focuses the beam to a small spot size. At the same
time, the transverse resolution is also related to the depth of the field or the confocal
parameter b , which is
2
R
z , or two times the Rayleigh range:
2
2
R
x
bz
(2)
Therefore, increasing the transverse resolution produces a decrease in the depth of the field,
similar to that observed in conventional microscopy. Given the fact that the improvement of
the transverse resolution involves a trade-off in depth of field, OCT imaging is typically
performed with low numerical aperture focusing to have a large depth of field. To date, the
majority of early studies have rather focused on improving the axial resolution.
Contrary to standard microscopy, the axial image resolution in OCT is independent of
focusing conditions. In low-coherence interferometry, the axial resolution is given by the
width of the field autocorrelation function, which is inversely proportional to the bandwidth
of the light source. For a Gaussian spectrum, the axial (lateral) resolution is given by:
2
2(2)Ln
z
(3)
where z is the full-width-at-half-maximum (FWHM) of the autocorrelation function, , and
is the FWHM of the power spectrum.
Fingerprints in the Optical and Transport Properties of Quantum Dots
6
30 60 90 120 150 180 210 240 270 300
0
5
10
15
20
830nm
1064nm
1300nm
1500nm
Axial resolution (m)
Bandwidth (nm)
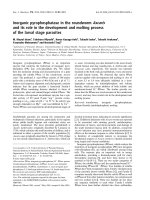
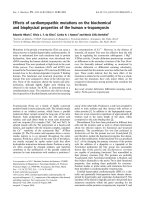
Fig. 1. Axial resolution versus bandwidth of light sources for central wavelengths of 830,
1064, 1300 and 1500nm.
Since the axial resolution is inversely proportional to the bandwidth of the light source,
broadband light sources are required to achieve high axial resolution. For a given
bandwidth, improving the axial OCT resolution can be also achieved by reducing the central
wavelength of the light source (c.f. Figure 1). It should also be noticed that to achieve a given
axial resolution the bandwidth requirement is increased at longer wavelengths. For
example, to achieve an axial resolution of 5µm, the bandwidth required is only 50nm at
central wavelength of 830nm, and three times higher when a light source of central
wavelength of 1300nm is chosen.
2.1.2 Imaging speed-sensitivity in OCT
Detection sensitivity (detectable reflectivity) has a significant impact on the imaging speed
capabilities of an OCT system. As the scan speed increases, the detection bandwidth should
be increased proportionally, and therefore the sensitivity drops. The sensitivity of state-of-
the-art time-domain OCT systems that operate at relatively low imaging speed (~2kHz A-
line rate), ranges between -105 and -110dB. Increasing the optical power of the light source
should in principle improve the sensitivity; however, the available sources and maximum
permissible exposure levels of tissue represent significant practical limitations. The potential
alternative technique for high-imaging speed is the use of Fourier/spectral domain
detection (SD-OCT) or Fourier/swept source domain detection (SS-OCT) also known as
optical frequency domain imaging (OFDI). The first approach, SD-OCT, uses an
interferometer with a low-coherence light source (superluminescent diodes) and measures
the interference spectrum using a spectrometer and a high-speed, line scan camera. The
second approach, SS-OCT, uses an interferometer with a narrow-bandwidth, frequency-
swept light source (swept laser sources) and detectors, which measure the interference
InAs Quantum Dots of Engineered Height for Fabrication of Broadband Superluminescent Diodes
7
output as a function of time. Fourier domain detection has a higher sensitivity as compared
to time domain detection, since Fourier domain detection essentially measures all of the
echoes of light simultaneously, improving sensitivity by a factor of 50-100 times (enabling a
significant increase in the imaging speeds).
2.1.3 Image contrast and penetration depth in OCT
Tissue scattering and absorption are the main limiting factors for image contrast and
penetration depth in OCT technology. Indeed, OCT penetration depth is significantly
affected by light scattering within biological tissue, which scales as
1/
k
, where the
coefficient k
is dependent on the size, shape, and relative refractive index of the scattering
particles. The difference in tissue scattering and absorption provides structural contrast for
OCT. Since scattering depends strongly on wavelength and decreases for longer
wavelengths, significantly larger image penetration depth can be achieved with light
centered at 1300nm rather than 800nm. However, above 1300nm the water absorption
becomes a problem. So far, the majority of clinical ophthalmic OCT studies have been
performed in the 800 nm wavelength region. Excellent contrast, especially when sufficient
axial resolution is accomplished, enables visualization of all major intraretinal layers, but
only limited penetration beyond the retina. This limitation is mainly due to significant
scattering and absorption phenomena.
Water is the most abundant chemical substance in the human body, accounting for up to
90% of most soft tissues. The most commonly used wavelength window of low water
absorption (µ
a
<0.1cm
-1
) for OCT imaging is lying in the 200-900 nm range. Above 900 nm
the absorption coefficient increases fairly rapidly to reach µ
a
~ 0.5cm
-1
at ~970 nm, drops
back to ~0.13cm
-1
at 1064nm, and then continues to increase at longer wavelengths into the
mid-infrared. The region of low absorption around 1060nm acts as a ‘window’ of
transparency, allowing near infrared spectroscopic measurements through several
centimeters of tissue to be made. For this reason, OCT imaging at 1060 nm can achieve
deeper tissue penetration into structures beneath the retinal pigment epithelium, as well as
better delineation of choroidal structure.
2.2 Light source for ultrahigh resolution OCT
The light source is the key technological parameter of an OCT system. The performance
characteristic of the light source, such as central wavelength, bandwidth, output power,
spectral shape, and stability will directly affect the OCT image resolution. For this reason, a
proper choice of the light source for optimized performance OCT system is imperative. In
the recent years, there has been considerable interest in the use of broadband light sources
around 1064nm for use in ophthalmic OCT applications. It is due to the optimal compromise
between water absorption and human tissue scattering that the 1064nm wavelength
‘
window’ has been proposed, and demonstrated, to be more suitable for OCT applications as
compared to those that use a light source with a central wavelength of 800nm (Povazay et al,
2007). There are a myriad of choices in selecting such OCT light sources i) femtosecond or
fiber lasers that are dispersed to produce super-continuum light and swept source lasers,
and ii) superluminescent diodes. Highly non-linear air-silica microstructure fibers and
photonic crystal fibers (PCFs) can generate an extremely broadband continuous light
Fingerprints in the Optical and Transport Properties of Quantum Dots
8
spectrum from the visible to the near infrared by use of low-energy femtosecond pulses
(Wang et al, 2003; Hartl et al, 2011). Spectral bandwidth up to 372nm was achieved at 1.1µm
central wavelength. The super-continuum light source also has the advantage of achieving
faster imaging speed with higher signal-to-noise ratio.
Although the reported OCT tomograms with the highest axial resolution (1.8
m) were so far
achieved in research laboratories with a photonic crystal fibre based source (Wang et al,
2003), superluminescent diodes are considerably lower in cost and complexity as well as
being smaller in size, which makes them more attractive for mass production.
Superluminescent diodes utilizing quantum-dots in the active region are considered to be an
excellent candidate as a light source for an OCT system. The naturally wide dimensional
fluctuations of the self-assembled quantum dots, grown by the Stranski-Krastanow mode,
are very beneficial for broadening the gain spectra which enhances the spectral width of the
SLDs. On the other hand, the three-dimensional carrier confinement provided by the dots’
shape results in high radiative efficiency required for the OCT applications.
3. Reported superluminescent diodes for bandwidth widening and their
performance parameters
Since the first report in 1993 (Leonard et al, 1993), the formation of strained self-assembled
quantum dots by heteroepitaxial growth in the Stranski–Krastanow mode has been studied
extensively for their fundamental properties and applications in optoelectronics. Significant
breakthroughs occurred over the last two decades with the fundamental understanding of
the QDs systems and the demonstration of zero-dimensional novel devices. These
achievements are directly related to the noticeable advances in the epitaxial materials
deposition. With self-assembled QDs growth process, a certain size inhomogeneity is
common and typically not less than 10%. It has been predicted (Sun & Ding, 1999) that the
full width at half maximum of the SLDs output spectrum of the In
0.7
Ga
0.3
As/GaAs quantum
dot system, with a standard deviation in the average size of the QD ensemble of 10%, can be
as high as 140nm. Increasing further the size variation of the dots to 30% should result in
bandwidth as high as 160nm. The confinement potential between the dots and the barriers is
another important factor for modifying the spectral width. With only 10% size variation
increasing the potential confinement by using higher indium composition in the dots a
spectral width of 230nm was predicted in the In
0.9
Ga
0.1
As/GaAs quantum dot system (Sun
& Ding, 1999). In general, such inhomogeneous size distribution of self-assembled QDs in
the active region is disadvantageous for achieving lasing of QD-lasers. However, for the
designed wide spectrum QD-SLDs it becomes an effective intrinsic advantage for
broadening the emission spectrum. Experimentally, using five layers of InAs/GaAs QDs
grown under identical growth conditions in a molecular beam epitaxy system (Liu et al.,
2005), SLDs with full width at half maximum of ~110nm at a central wavelength of 1.1µm
have been made. For high resolution optical coherence tomography applications around
1060nm an even wider broadband spectrum is required. Increasing further the bandwidth of
the emission spectrum of the SLDs is a complicated process and requires more than just
optimization of the growth conditions of the active region of the device. The precise control
of the average size distribution of the dots within one layer is a very challenging process
and is very difficult to reproduce. Very practical and successful ideas based on engineering
the matrix surrounding the QDs have been also proposed and applied to the fabrication of
InAs Quantum Dots of Engineered Height for Fabrication of Broadband Superluminescent Diodes
9
broadband superluminescent diodes with central wavelength around 1060nm (Li et al, 2005;
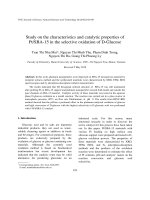
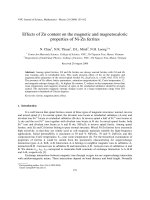
Ray et al., 2006; Yoo et al, 2007; Lv et al, 2008). Figure 2 shows examples of engineered
energy band diagrams of the active region of QD-SLDs for increasing their spectral width.
(a) (b) (c) (d)
Fig. 2. Schematic band diagrams of some proposed schemes that have been reported in the
literature: a) AlGaAs barrier instead of GaAs b) chirped QD structure with In
x
Ga
1-x
As strain-
reducing layer (SRL), c) chirped QD structure with InGaAs SRL and InAs dots of different
size by deposition of different InAs thicknesses, d) QD structure with dots in
compositionally modulated quantum wells (DCMWELL).
The use of InAs QDs in Al
0.14
Ga
0.86
As matrix instead of GaAs [fig.2 (a)] significantly affects
the dot size and distribution and results in a light emitting diode with a spectral bandwidth
of 142nm (Lv et al, 2008). The introduction of aluminum atoms reduces the migration length
of the indium atoms on the AlGaAs surface. This results in an increase of the nucleation
centers which favors the formation of smaller dots with higher density and of larger size
fluctuation. For SLDs made using such approach, output power under pulsed conditions
was 3mW at 4A driving current.
Another effective approach for changing the matrix surrounding the QDs was reported by
Li and co-authors (Li et al, 2005). They have introduced a thin capping In
x
Ga
1-x
As strain-
reducing layer (SRL) where the indium composition was increased from 9% to 15% by an
interval of 1.5% for the five layers of InAs dots of the device [fig. 2 (b)]. QD-SLDs with
121nm bandwidth were demonstrated. The use of In
x
Ga
1-x
As SLR however red-shifted the
central wavelength to 1165-1286nm range. The maximum achieved output power in these
devices was limited to only 1.5mW in pulsed mode.
Introducing an In
0.15
Ga
0.85
As SRL for all layers of dots, and changing the dots size from one
layer to another by depositing different InAs thicknesses [fig. 2 (c)], is another approach that
was proposed by Yoo
et al. for broadening the gain spectrum of the QD-SLDs (Yoo et al,
2007). The resulted power spectrum was up to 98nm wide centered at ~1150nm. Output
power of 32mW in continuous-wave operation mode was measured in these devices at
900mA injection current.
To control the bandwidth of the emission spectrum of QD-SLDs Ray and co-workers (Ray et
al., 2006; Ray et al., 2007) proposed to use a dot in compositionally modulated well
(DCMWELL) structure of different indium compositions within each well [fig. 2 (d)]. The
indium compositions in this structure were chosen such that the separation of the peak
Fingerprints in the Optical and Transport Properties of Quantum Dots
10
wavelengths resulting from a dot-in-well (DWELL) of different compositions is equal to the
linewidth of the individual DWELLs. Flat-topped spectral profile of 95nm full-width at half-
maximum centered at 1270nm was demonstrated. The corresponding achieved output
power in continuous-wave mode was 8mW at 900mA injection current.
Engineering the energy diagram of the surrounding matrix of the QDs is a precise and
reproducible technique to manipulate the ground-state (GS) and the excited-states (ESs)
peak positions for broadening the spectrum gain. Another powerful approach is to use
external means to manipulate to peak positions of the GS and ESs of the dot. This was
achieved by using multi-section ridge waveguide QD-SLDs. The multi-section SLDs consists
of single ridge waveguide divided into three electrically isolated sections: the absorber
(reverse-biased to eliminate back reflections) and the two gain sections that are
independently biased at different current to favor either GS or ES emission from each
section. In this configuration, adjusting the current densities and the lengths of the two SLD
sections allows a control of the power output and bandwidth related to the GS and ES of the
dots. Using such an approach, Xin and co-authors (Xin et al, 2007) were the first to use a
multiple section QD-SLDs as a flexible device geometry that permits independent
adjustment of the power and spectral bandwidth in the ground-state and the excited-states
of the QDs. Emission spectrum with full width at half maximum of 164nm and 220nm were
achieved with central wavelength of 1.15µm and 1.2µm, respectively. The maximum
achievable output power in continuous-wave mode, at these wavelengths, was about
0.6mW and 0.15mW, respectively.
For fabrication of broadband SLDs around 1060nm, optimized postgrowth rapid thermal
annealing at 750
C was also reported (Zhang et al, 2008). Compared to the as-grown
structure, the bandwidth of the device was increased by a factor of two (to 146nm) with the
central emission peak blueshift of 54nm (from 1038nm down to 984nm). However, this
bandwidth increase was obtained at the expense of continuous-wave output power which
decreased by a factor of six, down to 15mW.
A bipolar cascade SLD that uses tunneling junctions between distinct multiple quantum
wells was also reported by Guol and co-authors (Guol et al, 2009) for bandwidth
engineering. Emitting device with spectral bandwidth of 180nm at central wavelength of
1.04µm was demonstrated. The corresponding maximum continuous-wave output power
was 0.65mW.
4. Spectral broadening using height engineered InAs/GaAs quantum dots
Tuning the emission properties of QDs assemblies by in-situ annealing after changing the
growth kinetics during the capping (Garcia et al, 1998, Wang et al, 2006), or by post-growth
annealing under a GaAs (Leon et al, 1996; Kosogov et al, 1996; Babinski et al, 2001) or SiO
2
proximity cap (Malik et al, 1997; Xu et al, 1998; Yang et al, 2007) have been extensively
reported. At the National Research Council of Canada (NRC), we have previously reported
(Wasilewski et al, 1999; Fafard et al, 1999) a growth technique, called
indium-flush, to control
the size and exciton levels of the self-assembled QDs. The indium-flush process consists in
removing all surface resident indium at a certain position during the overgrowth of the
GaAs cap layer. Using this process an additional degree of size and shape engineering,
giving a much improved uniformity of the macroscopic ensemble of QDs with well-defined
InAs Quantum Dots of Engineered Height for Fabrication of Broadband Superluminescent Diodes
11
electron shells, was achieved. The process was also proven to be a very reproducible growth
technique for improving the uniformity of the dots size distribution of QD ensembles in
laser structures. In this chapter we will demonstrate that using the indium-flush process, to
intentionally and precisely tune the GS peak position of dots from one layer to another in a
superluminescent diode structure, is a controllable and effective approach to fabricate
broadband emission spectra for ultrahigh resolution OCT applications (Haffouz et al, 2009;
Haffouz et al, 2010; Haffouz et al, 2012).
4.1 The epitaxial growth procedure
The epitaxial growth of the InAs/GaAs QDs was carried out in a V80H VG molecular beam
epitaxy (MBE) system using an As
2
molecular flux with arsenic pressure of ~1e-7 Torr. Solid
source effusion cells were used for Ga and In elements. All the growths were done using a
substrate rotation of 3s per turn to obtain uniformity throughout the wafers. The surface
temperature was monitored by optical pyrometer. GaAs (100) substrate has been used as a
template. Before introduction in the growth chamber, the GaAs substrates were outgassed
under vacuum at 450
C for 2h. Oxide removal was carried out in-situ by either a thermal
desorption process in the presence of As flux at high temperature or by first applying Ga
pulses in the presence of As, partial removal of the oxide at lower temperatures via
conversion of the stable Ga
2
O
3
surface oxide into a volatile Ga
2
O oxide, and then the high
temperature standard oxide removal (Wasilewski et al, 2004). The later oxide removal
technique was found to reduce the substrate surface roughness. The self-assembled
InAs/GaAs QD layers were obtained using the spontaneous island formation at the initial
stages of the Stranski-Krastanow growth mode during the epitaxy of highly strained InAs
on GaAs. The growth rates of the GaAs and InAs used in these studies were 2Å/s and
0.23Å/s, respectively. The epitaxial growth procedure of the InAs QDs on GaAs buffer was
performed as following: after growing the 200nm GaAs buffer layer at 600ºC, the substrate
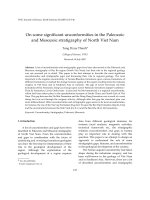
Fig. 3. Schematic drawing of the evolution of the dots during the overgrowth of the InAs
with GaAs capping layer.
(a)
(b)
(c)
(d)
Fingerprints in the Optical and Transport Properties of Quantum Dots
12
temperature was lowered to 480-505C where an InAs layer of 1.95-ML thick was grown.
Transition from streaky to spotty pattern measured by reflection high energy electron
diffraction technique, which indicates the onset of the dot formation, was observed after
approximately 26s of indium deposition [Fig. 3(a)]. A short anneal for 30 s at the same
substrate temperature followed by a partial capping of the formed dots by a GaAs layer was
applied [Fig. 3(b)]. The thickness of the GaAs layer in this case was varied in the range of
2.5- to 6.5-nm thick, thicknesses that are well below the typical average dots height (
10nm).
Right after the partial capping of the dots, the indium-flush was executed by interrupting
the growth, raising rapidly the substrate temperature to 610
C and annealing for 70 s at that
temperature. During this step, In/Ga interdiffusion was taking place and the non-protected
resident indium desorbed [Fig. 3(c)]. The substrate temperature was then reduced to 600
C
to complete the capping of the formed disk-like dots by growing a GaAs layer of total
thickness of 100nm (Fig. 3(d)). For morphological analysis of the QDs, extra layer of dots
(surface dots) was grown above the GaAs capping layer and left uncapped.
4.2 Tuning InAs quantum dots for high areal density
Epitaxial growth of InAs QD layers of high areal dot density and good optical quality is
required to fabricate high optical gain devices like lasers, SLDs, SOAs, etc. Particularly, for
broadband emission SLDs, high areal dot density should improve the optical properties of the
QD-SLDs, since, unlike QD lasers, emission from QD-SLDs is contributed by QDs of all sizes.
Size inhomogeneity in QD layers of low density is small compared to QD layers of high density.
Therefore, the use of high areal dot density should introduce a wider emission energy range.
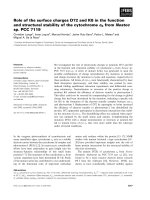
Fig.4 shows atomic force microscope (AFM) images of surface dots grown under identical
growth conditions but different substrate temperature for the deposition of the InAs layer.
In these QD layers, the indium-flush of the buried layers was executed after partial capping
of the QDs with GaAs of 4.5nm thickness. When the InAs layer was deposited at substrate
temperature of 505ºC [fig. 4(a)] an areal dots density of 1.4x10
10
cm
-2
was obtained.
Decreasing the deposition temperature of the InAs layer to 480
C [fig. 4(b)] reduces the
adatom migration length which led to the formation of new nucleation sites for the
impinging adatoms, reducing the combination/coalescence with the existing dots. This
resulted in the formation of denser dots with larger size inhomogeneity. The achieved areal
dot density was about 1x10
11
cm
-2
.
Fig. 4. Atomic Force Microscope (AFM) images of surface InAs QDs on GaAs buffer deposited
at a substrate temperature of 505ºC (a) and 480
C (b). The surface area is 500nm x 500nm.
(a)
(b)
InAs Quantum Dots of Engineered Height for Fabrication of Broadband Superluminescent Diodes
13
Fig. 5 shows the optical properties as measured by photoluminescence (PL) at 77K of a
single layer of InAs QDs grown at different substrate temperatures. The samples S
1
, S
2
, S
3
and S
4
correspond to growth temperatures of 505, 495, 485 and 480ºC, respectively. With
identical monolayer coverage (1.95ML of InAs), the areal dot density can be directly controlled
by the substrate temperature to achieve a dots density as high as ~1x10
11
cm
-2
. At high growth
temperature (S
1
), PL spectra with a ground-state (GS) peak position at 1.185eV and with well-
resolved excited states peaks (n=1, 2, 3, 4) were obtained. Increasing further the dots density
(S
2
), the GS peak position remained unchanged (at 1.187eV), however the number of the
excited-state transition peaks reduced (n=1,2,3). The measured intersublevel energy spacing
was about 57meV for both samples. No noticeable change in the PL intensity was measured
between S
1
and S
2
. However, increasing the dot density to 6x10
10
cm
-2
significantly changed the
PL spectrum which is now consisted in a single wideband centred at 1.222eV with a slightly
reduced intensity. In sample S
4
, where the dot density reached ~1x10
11
cm
-2
, the PL intensity
was significantly reduced (by a factor of 100) and the central peak was blueshifted by 31meV.
The spectra broadening in the case of S
3
and S
4
can be explained by the lateral coupling
between the dots, the GS emission from the small dots overlapping with the emission from
larger dots. However, the noticeable reduction in the PL intensity in S
4
was related to the
formation of defective dots when their density was increased. For broadband SLDs fabrication,
a compromise between high dot density and good optical properties had to be taken into
account. For SLD fabrication an areal dot density of about 4-5x10
10
cm
-2
was chosen, using a
growth temperature for the InAs layer of around 490
C.
0.9 1.0 1.1 1.2 1.3 1.4 1.5
Dots density:
S
3
: 6E10cm
-2
77K
S
4
: ~1E11cm
-2
S
1
: 1.4E10cm
-2
x100
PL Intensity (a.u.)
Energy (eV)
S
2
: 3E10cm
-2
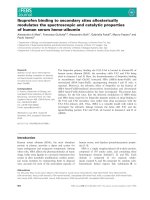
Fig. 5. Photoluminescence spectra measured at 77K of single layers of InAs QDs of different
areal densities, capped with 100nm GaAs layers.
Fingerprints in the Optical and Transport Properties of Quantum Dots
14
4.3 Height engineering of self-assembled InAs/GaAs QDs for wideband emission
The indium-flush process is a very reproducible and predictable process to engineer the QD
height and is therefore a reliable tool for tuning the QD emission energy. By varying the
thickness of the GaAs cap layer at which the indium-flush process is executed, the ground-
state transition energy of the QDs can continuously be adjusted over a wide emission
wavelength range. Combining selected layers of QDs with various dot heights offers the
possibility to reliably broaden the emission bandwidth of the QD-SLD spectrum. With this
motivation, we have carried out a study on tuning the dot height by growing a single layer of
dots where the indium flux process was executed at different GaAs partial capping thickness.
For all the samples a buffer layer of 200nm of GaAs was first deposited at 600
C on an un-
doped GaAs (100) substrate before the growth of the InAs layer at a temperature of 490
C.
850 900 950 1000 1050 1100 1150
0.00
0.05
0.10
0.15
0.20
0.25
0.30
6.0nm
4.5nm
3.6nm
2.8nm
77K
Photoluminescence Intensity
Wavelength (nm)
(a)
950 1000 1050 1100 1150 1200
0.000
0.001
0.002
0.003
0.004
0.005
0.006
0.007
2.8nm
3.6nm
4.5nm
6.0nm
Photoluminescence Intensity
Wavelength (nm)
x50
x5
x1/2
300K
(b)
Fig. 6. Photoluminescence spectra at 77K (a) and at room-temperature (b) of single layers of
InAs QDs grown with the indium-flush process that was executed at different thicknesses of
GaAs capping layer.
InAs Quantum Dots of Engineered Height for Fabrication of Broadband Superluminescent Diodes
15
Fig. 6(a) and (b) show the photoluminescence spectrum, measured respectively at 77K and
at room-temperature, of a single layer of dots where the indium flux process was executed
after the deposition of a thin GaAs cap layer between 2.8 and 6.0nm of thicknesses. The areal
dot density in these layers was in the range of 3-4 x10
10
cm
-2
. Due to the high areal dot
density, only the first intersublevel energy transition (s-shell) is observed. It should be
noticed that decreasing the average dot height within one layer reduced the
photoluminescence emission intensity very quickly at room-temperature whereas the
decrease of the photoluminescence intensity was less pronounced at 77K. The
photoluminescence intensity drop from one layer of dots to another at room-temperature
can be explained by the reduction in the carrier confinement due to the reduced potential
barrier for carriers in smaller dots. However, with suppressed non-radiative recombination
at 77K, due to the reduced mobility of carriers at lower temperatures, the
photoluminescence intensity drop from one sample to another was reduced. Nevertheless,
PL intensity reduction at 77K by ~50% can still be observed in the layer of shorter dots as
compared to longer ones.
Fig. 7 shows the variation of the GS and the first ES emission wavelength values at room-
temperature and at 77K for the grown layer of dots as a function of the average dot height.
From previous transmission electron microscopy studies (Haffouz et al, 2009), we found that
the average dot height within one layer is approximately the thickness of the GaAs layer
deposited at low temperature minus 2nm. With increasing dot height, by increasing the
thickness of the deposited GaAs cap layer at low temperature before the indium-flush
process, the GS peak wavelength of the emission spectrum shifted towards longer
wavelength by about 150nm and 169nm at 77K and 300K, respectively. Combining these
four layers of dots in the active region of a superluminescent diode could be very beneficial
in generating a broadband emission spectrum.
25 30 35 40 45 50 55 60
880
920
960
1000
1040
1080
1120
1160
dot
h
dot
h
GS_300K
GS_78K
ES_78K
Wavelength (nm)
Average dot height, h
dot
(Å)
Fig. 7. Variation of the GS and ES peak wavelengths as extracted from the
photoluminescence spectra as a function of average dot height.