Practical Python Data Wrangling and Data Quality
Bạn đang xem bản rút gọn của tài liệu. Xem và tải ngay bản đầy đủ của tài liệu tại đây (5.19 MB, 447 trang )
<span class="text_page_counter">Trang 2</span><div class="page_container" data-page="2">
<b>Practical Python Data</b>
<b>Wrangling and Data Quality</b>
Getting Started with Reading, Cleaning, and Analyzing Data
With Early Release ebooks, you get books in their earliest form—the author’s raw and unedited content as they write—so you can take
advantage of these technologies long before the official release of these titles.
<b>Susan E. McGregor</b>
</div><span class="text_page_counter">Trang 3</span><div class="page_container" data-page="3"><b>Practical Python Data Wrangling and Data Quality</b>
by Susan E. McGregor
Copyright © 2022 Susan McGregor. All rights reserved. Printed in the United States of America.
Published by O’Reilly Media, Inc., 1005 Gravenstein Highway North, Sebastopol, CA 95472.
O’Reilly books may be purchased for educational, business, or sales promotional use. Online editions are also available for most titles (). For more information, contact our
corporate/institutional sales department: 800-998-9938 or
Acquitisions Editor: Jessica Haberman
Development Editor: Jeff Bleiel
Production Editor: Daniel Elfanbaum
Interior Designer: David Futato
Cover Designer: Karen Montgomery
Illustrator: Kate Dullea
February 2022: First Edition
<b>Revision History for the Early Release</b>
2020-12-08: First Release 2021-02-01: Second Release 2021-03-02: Third Release 2021-04-05: Fourth Release
</div><span class="text_page_counter">Trang 4</span><div class="page_container" data-page="4">The O’Reilly logo is a registered trademark of O’Reilly Media, Inc.
<i>Practical Python Data Wrangling and Data Quality, the cover image, and</i>
related trade dress are trademarks of O’Reilly Media, Inc.
The views expressed in this work are those of the author, and do not represent the publisher’s views. While the publisher and the author have used good faith efforts to ensure that the information and instructions
contained in this work are accurate, the publisher and the author disclaim all responsibility for errors or omissions, including without limitation
responsibility for damages resulting from the use of or reliance on this work. Use of the information and instructions contained in this work is at your own risk. If any code samples or other technology this work contains or describes is subject to open source licenses or the intellectual property rights of others, it is your responsibility to ensure that your use thereof complies with such licenses and/or rights.
978-1-492-09143-1 [LSI]
</div><span class="text_page_counter">Trang 5</span><div class="page_container" data-page="5"><b>A NOTE FOR EARLY RELEASE READERS</b>
With Early Release ebooks, you get books in their earliest form—the author’s raw and unedited content as they write—so you can take
advantage of these technologies long before the official release of these titles.
If you have comments about how we might improve the content and/or examples in this book, or if you notice missing material within this chapter, please reach out to the author at
Welcome! If you’ve picked up this book, you’re likely one of the many millions of people who is intrigued by the processes and possibilities surrounding “data” — that incredible, elusive new “currency” that’s transforming the way we live, work, and even connect with one another. Most of us are vaguely aware of the fact that data — collected by from our electronic devices and other activities — is being used to shape what
advertisements we see, what media is recommended to us and which search results populate first when we look for something online.
But data is not just something that is available — or useful — to big companies or governmental number-crunchers. Being able to access,
understand and gather insight from data is a valuable skill whether you’re a data scientist or a daycare worker. And fortunately, the tools needed to use data effectively are more freely accessible than ever before. Not only can you do significant data work using only free software and programming languages, you don’t even need an expensive computer — all of the exercises in this book, for example, were designed and run on a Chromebook that cost less than $500.
</div><span class="text_page_counter">Trang 6</span><div class="page_container" data-page="6">The goal of this book is to provide you with the guidance and confidence
<i>you need to begin exploring the world of data, from wrangling it (in other</i>
words, getting it into a state where it can be assessed and analyzed), to evaluating its quality (which is often both more nuanced and more
difficult). With those foundations in place, we’ll move on to some of the basic methods of analyzing and presenting data to generate meaningful insight. While these latter sections will be far from comprehensive (both data analysis and visualization are robust fields unto themselves), they will give you the core skills needed to generate accurate, informative analyses and visualizations using your newly cleaned and acquired data.
<b>Who should read this book?</b>
This book is intended for true beginners; all you need are a basic
understanding of how to use computers (e.g. how to download a file, open a program, copy and paste etc.), an open mind, and a willingness to
experiment. I especially encourage you to take a chance on this book if you are someone who feels intimidated by data or programming, if you’re “bad at math”, or imagine that working with data or learning to program will be too “hard” for you. I have spent nearly a decade teaching hundreds of people who didn’t think of themselves as technical the exact skills
contained in this book, and I have never once had a student who was truly unable to complete this work. In my experience, the biggest barrier to programming and work with data is not the difficulty of the material, but the quality of the instruction. I am grateful to the many students over the years whose questions have, I think, made my ability to convey this
material immeasurably better---and that I now have the opportunity to pass that insight on to so many others through this book. And while I won’t
pretend that a book can truly replace having access to a human teacher, I am confident that it will give you enough information to master the basics, while pointing the way towards more in-depth (and interactive) resources when necessary.
</div><span class="text_page_counter">Trang 7</span><div class="page_container" data-page="7">Folks who have some experience with data wrangling but have reached the limits of spreadsheet tools or want to expand the range of data formats they can easily access and manipulate will also find this book useful, as will those with front-end programming skills (in JavaScript or PHP, for example) who are looking for a way to get started with Python.
</div><span class="text_page_counter">Trang 8</span><div class="page_container" data-page="8"><b>WHERE WOULD YOU LIKE TO GO?</b>
In the preface to media theorist Douglas Rushkkoff’s 2010 book
<i>Program or be Programmed he compares the act of programming to</i>
that of driving a car. Unless you learn to program, Rushkoff writes, you are a perpetual passenger in the digital world, one who “is getting
driven from place to place. Only the car has no windows and if the driver tells you there is only one supermarket in the county, you have to believe him.”
“You can relegate your programming to others,” Rushkoff
continues,“but then you have to trust them that their programs are really doing what you’re asking, and in a way that is in your best interests.” More and more these days, the latter assertion is being thrown into question.
Yet while most of us would agree that almost anyone can learn to drive I have met few people — apart from myself — who truly believe that anyone can program. This is despite the fact that, from a cognitive perspective, driving a motor vehicle is vastly more complex than programming a computer. Why, then, do so many of us imagine that programming will be “too hard” for us?
Here, for me, is the real strength of Rushkoff’s analogy, because the windowless car he describes doesn’t just hide the outside world from the passenger, it also hides the “driver” from passersby. Part of the reason why it is easy for so many of us to believe that anyone can drive a car is because we have evidence of it: we quite literally see all kinds of people driving cars, every day.
When it comes to programming, however, we rarely get to see who is “behind the wheel”, so our idea of who can program and who should program is too often defined by media representations that portray programmers as largely white and overwhelmingly male. As a result,
<i>those characteristics have come to dominate who does program — but</i>
there’s no reason why it should. Because if you can drive a car — or
</div><span class="text_page_counter">Trang 9</span><div class="page_container" data-page="9">even write a grammatical sentence---I promise you can program a computer, too.
<b>Who shouldn’t read this book?</b>
As noted above, this book is intended for beginners. So while you may find some sections useful if you are new to data analysis or visualization, this volume is not designed to serve those with prior experience in Python or another data-focused programming language (like R). Fortunately, O’Reilly has many specialized volumes that deal with advanced Python topics and libraries, which you can find listed here: (To Come).
<b>What to expect from this volume</b>
The content of this book is designed to be followed in the order presented, as the concepts and excercises in each chapter build on those explored previously. In addition to addressing new topics, such as data analysis or visualization, later chapters build on earlier ones to offer strategies for working with data sets that are larger, “messier”, or more frequently updated than earlier examples. Throughout, however, you will find that exercises are presented in two ways: as code “notebooks” and as
“standalone” programming files. The purpose of this is two-fold. First, it allows you, the reader, to use whichever approach you prefer or find most accessible; second, it provides a way to compare these two methods of interacting with data-driven Python code. In my experience, Python “notebooks” are extremely useful for getting up and running quickly, but can become tedious if you develop a reliable piece of code that you wish to run repeatedly. Since the code from one format often cannot simply be copied and pasted to the other, both are provided. As you follow along with the exercises, you will be able to use the format you prefer, and have the option of beginning to observe the differences in creating code for each.
</div><span class="text_page_counter">Trang 10</span><div class="page_container" data-page="10">Although Python is the primary tool used in this book, effective data wrangling and analysis is made easier through the smart use of a range of tools, from text editors (the programs in which you will actually write your code) to spreadsheet programs. Because of this, there are occasional
exercises in this book that rely on other free and/or open source tools (we’ll address what “open source” means in Chapter 1) besides Python. Wherever these are introduced, I will offer some context as to why that tool has been chosen, along with sufficient instructions to complete the example task. In many cases, these other tools, like Python, have active user communities and published resources available, and links will be provided to those as well.
<b>Conventions Used in This Book</b>
The following typographical conventions are used in this book:
Indicates new terms, URLs, email addresses, filenames, and file extensions.
Used for program listings, as well as within paragraphs to refer to program elements such as variable or function names, databases, data types, environment variables, statements, and keywords.
<i><b>Monospaced bold</b></i>
Shows commands or other text that should be typed literally by the user.
<i>Monospaced italic</i>
Shows text that should be replaced with user-supplied values or by values determined by context.
</div><span class="text_page_counter">Trang 11</span><div class="page_container" data-page="11"><small>This element indicates a warning or caution.</small>
<b>Using Code Examples</b>
Supplemental material (code examples, exercises, etc.) is available for download at (to come).
If you have a technical question or a problem using the code examples, please send email to
This book is here to help you get your job done. In general, if example code is offered with this book, you may use it in your programs and
documentation. You do not need to contact us for permission unless you’re reproducing a significant portion of the code. For example, writing a
program that uses several chunks of code from this book does not require permission. Selling or distributing examples from O’Reilly books does require permission. Answering a question by citing this book and quoting example code does not require permission. Incorporating a significant amount of example code from this book into your product’s documentation does require permission.
We appreciate, but generally do not require, attribution. An attribution usually includes the title, author, publisher, and ISBN. For example:
</div><span class="text_page_counter">Trang 12</span><div class="page_container" data-page="12"><i>“Practical Python Data Wrangling and Data Quality by Susan McGregor</i>
(O’Reilly). Copyright 2021 Susan McGregor, 978-1-492-09150-9.” If you feel your use of code examples falls outside fair use or the
permission given above, feel free to contact us at
<b>O’Reilly Online Learning</b>
<small>For more than 40 years, </small><i><small>O’Reilly Media</small></i><small> has provided technology and business training,knowledge, and insight to help companies succeed.</small>
Our unique network of experts and innovators share their knowledge and expertise through books, articles, and our online learning platform.
O’Reilly’s online learning platform gives you on-demand access to live training courses, in-depth learning paths, interactive coding environments, and a vast collection of text and video from O’Reilly and 200+ other
publishers. For more information, visit .
<b>How to Contact Us</b>
Please address comments and questions concerning this book to the publisher:
O’Reilly Media, Inc.
1005 Gravenstein Highway North
Sebastopol, CA 95472
800-998-9938 (in the United States or Canada)
707-829-0515 (international or local)
</div><span class="text_page_counter">Trang 13</span><div class="page_container" data-page="13">707-829-0104 (fax)
We have a web page for this book, where we list errata, examples, and any additional information. You can access this page at (to come).
Email to comment or ask technical questions about this book.
For news and information about our books and courses, visit
Find us on Facebook: Follow us on Twitter: us on YouTube: class="text_page_counter">Trang 14</span><div class="page_container" data-page="14">
<b>Chapter 1. Introduction to DataWrangling and Data Quality</b>
<b>A NOTE FOR EARLY RELEASE READERS</b>
With Early Release ebooks, you get books in their earliest form—the author’s raw and unedited content as they write—so you can take
advantage of these technologies long before the official release of these titles.
This will be the 1st chapter of the final book. Please note that the GitHub repo will be made active later on.
If you have comments about how we might improve the content and/or examples in this book, or if you notice missing material within this chapter, please reach out to the author at
These days it seems like data is the answer to everything: we use the data in product and restaurant reviews to decide what to buy and where to eat; companies use the data about what we read, click and watch to decide what content to produce and which advertisements to show; recruiters use data to decide which applicants get job interviews; the government uses data to decide everything from how to allocate highway funding to where your child goes to school. Data—whether it’s a basic table of numbers or the foundation of an “artificial intelligence” system—permeates our lives. The pervasive impact that data has on our experiences and opportunities every day is precisely why data wrangling is — and will continue to be — an essential skill for anyone interested in understanding and influencing how data-driven systems operate. Likewise, the ability to assess — and even improve — data quality is indispensible for anyone interested in making these sometimes (deeply) flawed systems work better.
</div><span class="text_page_counter">Trang 15</span><div class="page_container" data-page="15"><i>Yet because both the terms data wrangling and data quality will mean</i>
different things to different people, we’ll begin this chapter with a brief overview the three main topics addressed in this book: data wrangling, data quality, and the Python programming language. The goal of this overview is to give you a sense of my approach to these topics, partly so you can
determine if this book is right for you. After that, we’ll spend some time some time on the necessary logistics of how to access and configure the software tools and other resources you’ll need to follow along with and complete the exercises in this book. Though all of the resources that this book will reference are free to use, many programming books and tutorials take for granted that readers will be coding on (often quite expensive)
<i>computers that they own. Since I really believe that anyone who wants to</i>
can learn to wrangle data with Python, however, I wanted to make sure that the material in this book can work for you even if you don’t have access to a full-featured computer of your own. To help ensure this, all of the
solutions you’ll find here and in the following chapters were written and tested on a Chromebook, as well as on using free, online-only tools that a shared computer (for example, at a library), using free, online-only tools and accounts. I hope that by illustrating how accessible not just the
knowledge, but the tools, of data wrangling can be will encourage you to explore this exciting and empowering practice.
<b>What is Data Wrangling?</b>
Data wrangling is the process of taking “raw” or “found” data, and transforming it into something that can be used to generate insight and
<i>meaning. Driving every substantive data wrangling effort is a question:</i>
something about the world you want to investigate or learn more about. Of course, if you came to this book because you’re really excited about
learning to program, then data wrangling can be a great way to get started, but let me urge you now not to try to skip straight to the programming without engaging the data quality processes in the chapters ahead. Because as much as data wrangling may benefit from programming skills, it is about much more than simply learning how to access and manipulate data; it’s
</div><span class="text_page_counter">Trang 16</span><div class="page_container" data-page="16">about making judgements, inferences and selections. As this book will
<i>illustrate, most data that is readily available is not especially good quality,</i>
so there’s no way to do data wrangling without making choices that will influence the substance of the resulting data. To attempt data wrangling without considering data quality is like trying drive a car without steering:
<i>you may get somewhere — and fast! — but it’s probably nowhere you want</i>
to be. If you’re going to spend time wrangling and analyzing data, you want
<i>to try to make sure it’s at least likely to be worth the effort.</i>
Just as importantly, though, there’s no better way to learn a new skill than to
<i>connect it to something you genuinely want to get “right”, because that</i>
personal interest is what will carry you through the inevitable moments of frustration. This doesn’t mean that question you choose has to be something of global importance. It can be a question about your favorite video games, bands or types of tea. It can be a question about your school, your
neighborhood or your social media life. It can be a question about
<i>economics, politics, faith or money. It just has to be something that you</i>
genuinely care about.
Once you have your question in hand, you’re ready to begin the data wrangling process. While the specific steps may need adjusting (or
repeating) depending on your particular project, in principle data wrangling involves some or all of the following steps:
1. Locating or collecting data 2. Reviewing the data
3. “Cleaning”, standardizing, transforming, and/or augmenting the data
4. Analyzing the data 5. Visualizing the data 6. Communicating the data
</div><span class="text_page_counter">Trang 17</span><div class="page_container" data-page="17">The time and effort required for each of these steps, of course, can vary considerably: if you’re looking to speed up a data wrangling task you already do for work, you may already have a data set in hand and know basically what it contains. Then again, if you’re trying to answer a question about city spending in your community, collecting the data may be the most challenging part of your project.
Also know that, despite my having numbered the list above, the data wrangling process is really more of a cycle than it is a linear set of steps. More often than not, you’ll need to revisit earlier steps as you learn more about the meaning and context of the data you’re working with. For example, as you analyze a large data set, you may come across suprising patterns or values that cause you to question assumptions you may have made about it during the “review” step. This will almost always mean seeking out more information — either from the original data source or completely new ones — in order to understand what is really happening before you can move on with your analysis or visualization. Finally, while I haven’t explicitly included it above, it would be a little more accurate to
<i>start each of the above steps with Research and. While the “wrangling”</i>
parts of our work will focus largely on the data set(s) we have in front of us, the “quality” part is almost all about research and context, and both of these are integral to every stage of the data wrangling process.
If this all seems a little overwhelming right now—don’t worry! The examples in this book are built around real data sets, and as you follow along with coding and quality-assessment processes, this will all begin to feel much more organic. And if you’re working through your own data wrangling project and start to feel a little lost, just keep remindnig yourself of the question you are trying to answer. Not only will that remind you why you’re bothering to learn about all the minutaie of data formats and API access keysfoonote:[We’ll cover these in detail in Chapter 4 and Chapter 5, respectively], it will also almost always lead you intuitively to the next “step” in the wrangling process — whether that means visualizing your
<i>data, or doing just a little more research in order to improve its context and</i>
quality.
</div><span class="text_page_counter">Trang 18</span><div class="page_container" data-page="18"><b>What is data “quality”?</b>
There is plenty of data out in the world, and plenty of ways to access and collect it. But all data is not created equal. Understanding data quality is an essential part of data wrangling because any data-driven insight can only be as good as the data it was built upon . So if you’re trying to use data to understand something meaningful about the world, you have to first make sure that the data you have accurately reflects that world. As we’ll see in later chapters (Chapter 3 and Chapter 6, in particular), the work of
improving data quality is almost never as clear-cut as the often tidy-looking, neatly-labeled rows and columns of data you’ll be working with.
That’s because — despite the use of terms like “machine learning” and “artificial intelligence" — the only thing that computational tools can do is follow the directions that have been given to them, using the data they have been provided. And even the most complex, sophisticated, and abstract data is irrevocably human in its substance, because it is the result of human decisions about what to measure and how. Moreover, even today’s most advanced computer technologies make “predictions” and “decisions” via what amounts to large-scale pattern-matching — patterns that exist in the
<i>particular selections of data that the humans “training” them provide.</i>
<i>Computers do not have original ideas or make creative leaps; they are</i>
fundamentally bad at many tasks (like explaining the “gist” of an argument, or the plot of a story) that humans find intuitive. On the other hand,
computers excel at performing repetitive calculations, very very fast, without getting bored, tired or distracted. In other words, while computers are a fantastic complement to human judgment and intelligence, they can only amplify it — not substitute for it.
What this means is that it is up to the humans involved in data collection, acquisition and analysis to ensure its quality, so that the outputs of our data
<i>work actually means something. While we will go into significant detail</i>
around data quality in Chapter 3, I do want to introduce two distinct
(though equally important) axes for evaluating data quality: (1) the integrity of the data itself and (2) the “fit” or appropriateness of the data with respect to a particular question or problem:
<small>1</small>
</div><span class="text_page_counter">Trang 19</span><div class="page_container" data-page="19"><b>Data integrity</b>
<i>For our purposes, the integrity of a data set is evaluated using the data</i>
values and descriptors that make it up. If it our data set includes measurements over time, for example, have they been recorded at consistent intervals, or sporadically? Do the values represent direct
<i>individual readings, or are only averages available? Is there a data</i>
<i>dictionary that provides details about how the data was collected, recorded,</i>
or should be interpreted — for example, by providing relevant units? In
<i>general, data that is complete, atomic, and well-annotated — among other</i>
things — we would consider higher integrity because these characteristics make it possible to do a wider range of more conclusive analyses. In most cases, however, you’ll find that a given data set is lacking on any number of data integrity dimensions, meaning that it’s up to you to try to understand its limitations and improve it where you can. While this often means augmenting a given data set by finding others that can complement,
<i>contextualize or extend it, it almost always means looking beyond “data” of</i>
any kind and reaching out to experts: the people who designed the data, collected it, have worked with it previously, or know a lot about the subject area your data is supposed to address.
<b>Data “fit”</b>
Even a dataset that has excellent integrity, however, cannot be considered
<i>high-quality unless it is also appropriate for your particular purpose. Let’s</i>
say, for example, that you were interested in knowing which Citibike station has had the most bikes rented and returned in a given 24-hour period.
Although the real-time Citibike API contains high-integrity data, it’s poorly suited to answering the particular question of which Citibike station has seen the greatest turnover on a given date. In this case, you would be much better off trying to answer this question using the CitiBike “trip history” data .
Of course, it’s rare that a data fit problem can be solved so simply; often we have to do a significant amount of integrity work before we can know with
<i>confidence that our data set is actually fit for our selected question or</i>
<small>3</small>
</div><span class="text_page_counter">Trang 20</span><div class="page_container" data-page="20">project. There’s no way to bypass this time investment, however: short cuts when it comes to either data integrity or data fit will inevitably compromise the quality and relevance of your data wrangling work overall. In fact, many of the harms caused by today’s computational systems are related to problems of data fit. For example, using data that describes one
phenomenon (such as income) to try to answer questions about a potentially related — but fundamentally different — phenomenon (like educational attainment), can lead to distorted conclusions about what is happening in the world, with sometimes devastating consequences. In some instances, of course, using such proxy measures is unavoidable. An initial medical
diagnosis based on a patient’s observable symptoms may be required to provide emergency treatment until the results of a more definitive test are available. While such substitions are sometimes acceptable at the individual level, however, the gap between any proxy measure and the real
phenomenon multiplies with the scale of the data and the system it is used to power. When this happens, we end up with a massively distorted view of the very reality our data wrangling and analysis hoped to illuminate.
Fortunately, there are a number of ways to protect against these types of errors, as we’ll explore further in Chapter 3.
</div><span class="text_page_counter">Trang 21</span><div class="page_container" data-page="21"><b>UNPACKING COMPAS</b>
One high-profile example of the harms that can be caused by using bad proxy data in a large scale computational system was demonstrated a
<i>number of years ago by a group of journalists at ProPublica, a </i>
non-profit investigative news organization. In the series “Machine Bias”, reporters examined discrepancies in the way that an algorithmic tooled called the Correctional Offender Management Profiling for Alternative Sanctions, or COMPAS, made re-offense predictions for Black and white defendants who were up for parole. In general, Black defendants with a similar criminal history to white defendants were given higher risk scores—in large part because the data used to predict — or
“model" — their risk of reoffense treated arrest rates as a proxy for
<i>crime rates. But because patterns of arrest were already biased against</i>
Black Americans (i.e. Black people were being arrested for “crimes" — like walking to work — that white people were not being arrested for), the risk assessments the tool generated were biased, too.
Unfortunately, similar examples of how poor data “fit” can create
massive harms are not hard to come by. That’s why assessing your data
<i>for both integrity and fit is such an essential part of the data wrangling</i>
process: if the data you use is inappropriate, your work may not be just wrong, but actively harmful.
<b>Why Python?</b>
If you’re reading this book, chances are you’ve already heard of the Python programming language, and may even pretty be certain that it’s the right tool for starting — or expanding — your work on data wrangling. Even if that’s the case, I think it’s worth briefly reviewing what makes Python especially suited to the type of data wrangling and quality work that we’ll
<i>do in this book. Of course if you haven’t heard of Python before, consider</i>
this an introduction to what makes it one of the most popular and powerful programming languages in use today.
<small>5</small>
</div><span class="text_page_counter">Trang 22</span><div class="page_container" data-page="22">Perhaps one of the greatest strengths of Python as a general progamming language is its versatility: it can be easily used to access APIs, scrape data from the web, perform statistical analyses and generate meaningful
visualizations. While many other programming languages do some of these things, few do all of them as well as Python.
One of Python creator Guido van Rossum’s goal in designing the language was to make “code that is as understandable as plain English” ; Python uses English keywords where many other scripting languages (like R and JavaScript) use punctuation. For English-language readers, then, Python may be both easier and more intuitive to learn than other scripting
One of the core tenets of the Python programming language is that
“readability counts” . In most programming languages, the visual layout of the code is irrelevant to how it functions — as long as the “punctuation” is correct, the computer will understand it. Python, by contrast, is what’s known as “whitespace-dependent”: without proper tab and/or space
characters indenting the code, it actually won’t do anything except produce a bunch of erros. While this can take some getting used to, it enforces a level of readability in Python programs that can make reading other
people’s code (or, more likely, your own code after a little time has passed),
<i>much less difficult. Another aspect of readability is commenting and</i>
otherwise documenting your work, which I’ll address in more detail in “Documenting, saving and versioning your work”.
Python has a very large and active community of users, many of whom help create and maintain “libraries” of code that enormously expand what you
<small>7</small>
</div><span class="text_page_counter">Trang 23</span><div class="page_container" data-page="23">can quickly accomplish with your own Python code. For example, Python has popular and well-developed code libraries like NumPy and Pandas that can help you clean and analyze data, as well as others like
Matplotlib and Seaborn to create visualizations. There are even powerful libraries like Scikit-Learn and NLTK that can do the heavy lifting of machine learning and natural language processing. Once you have a handle on the essentials of data wrangling with Python that we’ll cover in this book (in which will use many of the libraries just mentioned), you’ll probably find yourself eager to explore what’s possible with many of these libraries and just a few lines of code. Fortunately, the same folks who write the code for these libraries often write blog posts, make video tutorials and share code samples that you can use to expand your Python work.
Similarly, the size and enthusiasm of the Python community means that finding answers to both common (and even not-so-common) problems and errors that you may encounter often have detailed solutions posted online. As a result, troubleshooting Python code can be easier than for more specialized languages with a smaller community of users.
<b>Python Alternatives</b>
The R programming language is probably Python’s nearest competitor for data work, and many teams and organizations rely on R for its combination of data wrangling, advanced statistical modeling, and visualization capabilities. At the same time, R lacks some of the accessibility and readability of Python.
<b>Simple Query Language is just that: a language designed to “slice and</b>
dice” database data. While SQL can be powerful and useful, it requires data to exist in a particular format to be useful, and is therefore of limited use for “wrangling” data in the first place.
</div><span class="text_page_counter">Trang 24</span><div class="page_container" data-page="24">Although Scala is well-suited to dealing with large data sets, it has a much steeper learning curve than Python, and a much smaller user
<b>community. The same is true of Julia.</b>
<i>Java, C/C++</i>
While these have large user communities and are very versatile, they lack the natural-language and readability bent of Python, and are
oriented more towards building software than doing data wrangling and analysis.
In a web-based environment JavaScript is invaluable, and many popular visualization tools (e.g. D3) are built using variations of JavaScript. At the same time, JavaScript does not have the same breadth of data
analysis features as Python, and is generally slower.
<b>Getting started with Python</b>
In order to follow along with the exercises in this book, you’ll need to get familiar with the tools that will help you write and run your Python code; you’ll also want a system for backing up and documenting your code so that
<i>don’t lose valuable work to an errant keystroke , and so that you can easily</i>
remind yourself what all that great code can do, even when you haven’t looked at it for a while. Because there are multiple toolsets for solving these problems, I recommend that you start by reading through the following sections, and then choosing the approach (or combination of approaches) that works best for your preferences and resources. At a high level, the key decisions will be whether you want to work “online only" — that is, with tools and services you access via the internet — or whether you can and
<i>want to be able to do Python work without an internet connection, which</i>
requires installing these tools on a device that you control. <small>8</small>
</div><span class="text_page_counter">Trang 25</span><div class="page_container" data-page="25"><b>Writing and “Running” Python</b>
We all write differently depending on context: you probably use a different style and structure when writing an email than when sending a text
message; for a job application cover letter you may use a whole different tone entirely. I know I also use different tools to write depending on on what I need to accomplish: I use online documents when I need to write and edit collaboratively with co-workers and colleagues, but I prefer to write books and essays in super-plain text editor that lives on my device. More particular document formats, like PDFs, are typically used for contracts and other important documents that we don’t want others to be able to easily change.
Just like natural human languages, Python can be written in different types of documents, each of which supports slightly different styles of writing, testing and running your code. The primary types of Python documents are
<i>notebooks and standalone files. While either type of document can be used</i>
for data wrangling, analysis and visualization, they have slightly different strengths and requirements. Since it takes some tweaking to convert one format to the other, I’ve made the exercises in this book available in both formats. I did this not only to give you the flexibility of choosing the
document type that you find easiest or most useful, but also so that you can compare them and see for yourself how the translation process affects the code. Here’s a brief overview of these document types to help you make an initial choice:
<i>A Python notebook is an interactive document used to run chunks of</i>
code, using a web browser window as an interface. In this book, we’ll be using a tool called “Jupyter” to create, edit and execute our Python notebooks . A key advantage of using notebooks for Python
programming is that they offer a simple way to write, run and document your Python code all in one place. You may prefer notebooks if you’re looking for a more “point and click” programming experience, or if working entirely online is important to you. In fact, the same Python
<small>9</small>
</div><span class="text_page_counter">Trang 26</span><div class="page_container" data-page="26">notebooks can be used on your local device or in an online coding environment with minimal changes — meaning that this option may be right for you if you a) don’t have access to a device where you’re able
<i>to install software or b) you can install software, but you also want to be</i>
able to work on your code when you don’t have your machine with you.
<i>Standalone files</i>
<i>A standalone Python file is really any plain-text file that contains</i>
Python code. You can create such standalone Python files using any basic text editor, though I strongly recommend that you use one specifically designed for working with code, like Atom (I’ll walk through setting this up in “Installing Python, Jupyter Notebook and a Code Editor”). While the software you choose for writing and editing
<i>your code is up to you, in general the only place you’ll be able to run</i>
these standalone Python files is on a physical device (like a computer or phone) that has the Python programming language installed. You (and your computer) will be able to recognize standalone Python files by their .py file extension. Although they might seem more restrictive at first, standalone Python files can have some advantages. You don’t need an internet connection to run standalone files, and they don’t require you to upload your data to the cloud. While both of those things are also
<i>true of locally-run notebooks, you also don’t have to wait for any</i>
software to start up when running standalone files: once you have
Python installed, you can run standalone Python files instantly from the
<i>command line (more on this shortly) — this is especially useful if you</i>
have a Python script that you need to run on a regular basis. And while notebooks’ ability to run bits of code independently of one another can make them feel a bit more approachable, the fact that standalone Python files also always run your code “from scratch” can help you avoid the errors or unpredictable results that can occur if you run bits of notebook code out of order.
Of course, you don’t have to choose just one or the other; many people find
<i>that notebooks are especially useful for exploring or explaining data (thanks</i>
</div><span class="text_page_counter">Trang 27</span><div class="page_container" data-page="27">to their interactive and reader-friendly format), while standalone files are
<i>better-suited for accessing, transforming and cleaning data (since</i>
standalone files can more quickly and easily run the same code on different data sets, for example). Perhaps the bigger question is whether you want to
<i>work online or locally: If you don’t have a device where you can install</i>
Python, you’ll need to work in cloud-based notebooks; otherwise you can use choose to use either (or both!) notebooks or standalone files on your device. As noted previously, notebooks that can be used either online or locally, as well as standalone Python files, are available for all the exercises in this book, in order to give you as much flexibility as possible, and also so you can compare how the same tasks get done in each case!
<b>Working with Python on your own device</b>
In order to understand and run Python code, you’ll need to install it on your device. Depending on your device, you there may be a downloadable
installation file available, or you may need to use a text-based interface (which you’ll need to use at some point if you’re using Python on your
<i>device) called the command line. Either way, the goal is to get you up and</i>
running with at least Python 3.9 . Once you’ve got Python up and running, you can move on to installing Jupyter notebook and/or a code editor
(instructions included here are for Atom). If you’re planning to work only in the cloud, you can skip right to “Working with Python online” for information on how to get started.
<b>Getting started with the command line</b>
If you plan to use Python locally on your device, you’ll need to learn to use
<i>the command line (also sometimes referred to as the terminal or command</i>
<i>prompt), which is a text-based way of providing instruction to your</i>
computer. While in principle you can do anything in the command line that you can do with a mouse, it’s particularly efficient for installing code and software (especially the Python libraries that we’ll be using throughout the book), and backing up and running code. While it may take a little getting
<small>10</small>
</div><span class="text_page_counter">Trang 28</span><div class="page_container" data-page="28">used to, the command line is often faster and more straightforward for many programming-related tasks than using a mouse. That said, I’ll provide
instructions for using both the command line and your mouse where both are possible, and you should feel free to whichever you find more
convenient for a particular task.
To get started, let’s open up a command line (sometimes also called the
<i>terminal) interface and use it to create a folder for our data wrangling work.</i>
If you’re on a Chromebook, Mac, or Linux machine, search for “terminal” and select the application called “Terminal”; on a PC, search for “cmd” and choose the program called “Command Prompt.”
<small>To enable Linux on your Chromebook, just go to your ChromeOS settings (click thegear icon in the start menu, or search “settings” in the Launcher). Towards the bottom ofthe left-hand menu you’ll see a small penguin icon labeled Linux (Beta). Click thisand then follow the directions to enable Linux on your machine. You may need to restartbefore you can continue.</small>
</div><span class="text_page_counter">Trang 29</span><div class="page_container" data-page="29">Once you have a terminal open, it’s time to make a new folder! To help you get started, here is a quick glossary of useful command-line terms:
The “list” command shows files and folder in current location. This is a text-based version of what you would see in a finder window.
<i>cd foldername</i>
The “change directory” command moves you from the current location
<i>into foldername, as long as foldername is shown when you use</i>
the ls command. This is equivalent to “double-clicking” on a folder within a finder window using your mouse.
<i>cd ../</i>
“Change directory” once again, but the ../ moves your current position to the containing folder or location.
<i>cd ~/</i>
“Change directory”, but the ~/ returns you to your “home” folder.
<i>mkdir foldername</i>
<i>“Make directory” with name foldername. This is equivalent to</i>
choosing New > Folder in the context menu with your mouse, and then naming the folder once its icon appears.
</div><span class="text_page_counter">Trang 30</span><div class="page_container" data-page="30"><small>When using the command line, you never actually have to type out the full name of afile or folder; think of it more like search, and just start by typing the first few charactersof the (admittedy case-sensitive) name. Once you’ve done that, hit the tab key, and thename will autocomplete as much as possible.</small>
<small>For example, if you have two files in a folder, one called xls_parsing.py and onecalled xlsx_parsing.py (as you will when you’re finished with Chapter 4), andyou wanted to run the latter, you can type:</small>
<small>python xl</small>
<small>And then hit tab, which will cause the command line to autocomplete topython xls</small>
<small>At this point, since the two possible file names diverge, you’ll need to supply either an xor an _, after which hitting tab one more time will complete the rest of the filename,and you’re good to go!</small>
Any time you open a new terminal window on your device, you’ll be in what’s known as your “home” folder. On Macs, PCs and Linux machines
<i>this is often the “User” folder, which is not the same as the the “desktop”</i>
area you’re shown when you first log in. This can be a little disorienting a first, since the files and folders you’ll see when you first run ls in a
terminal window will probably be unfamiliar. Don’t worry; just point your terminal at your regular desktop by typing:
<small>cd ~/Desktop</small>
Into the terminal, and hitting enter or return (for efficiency’s sake, I’ll just refer to this as the enter key from here on out).
On Chromebooks, Python (and the other programs we’ll need) can only be
<i>run from inside the Linux files folder, so you can’t actually navigate to</i>
the “desktop” area, so all you have to do is open a terminal window.
</div><span class="text_page_counter">Trang 31</span><div class="page_container" data-page="31">Next, type the following command into your terminal window and hit enter:
<small>mkdir data_wrangling</small>
Did you see the folder appear? If so, congratulations on making your first folder in the command line! If not, double-check the text at the left of the command line prompt ($ on Chromebook, % on Mac, > on Windows). If you don’t see the word Desktop in there, run cd ~/Desktop and then try again.
<small>Although most operating systems will let you do it, I strongly recommend that againstusing either spaces or any punctuation marks apart from the underscore character (_) inyour folder and file names. As you’ll see firsthand in Chapter 2, both the command lineand Python (along with most programming languages) rely on whitespace and</small>
<small>punctuation as shorthand for specific functionality, which means these characters haveto be “escaped" — usually by preceding them with some additional character, like abackslash (\) — if they are part of a file or folder name you want to access. In fact, you</small>
<i><small>can’t even do this from the command line; if you were to type:</small></i>
<small>mkdir data wrangling</small>
<small>You’d just end up with two new folders: one called data and another calledwrangling. If you really wanted to force it and you used your mouse to create afolder called data wrangling, moreover, to access it from from the command line,you’d need to type:</small>
<small>cd data\ wrangling/</small>
<small>Not impossible, of course, but more trouble than it’s worth. To avoid this hassle, it’seasier to just get in the habit of not using spaces or non-underscore punctuation whennaming files, folders, and, soon, Python variables!</small>
Now that you’ve gotten a little bit of practice with the command line, let’s see how it can help when installing and testing Python on your machine.
</div><span class="text_page_counter">Trang 32</span><div class="page_container" data-page="32"><b>Installing Python, Jupyter Notebook and a Code Editor</b>
<i>To keep things simple, we’re going to use a software distribution manager</i>
called “Miniconda”, which will automatically install both Python and Jupyter Notebook; even if you don’t plan to use notebooks for your own
<i>coding, they’re popular enough that being able to view and run other</i>
people’s is useful, and it doesn’t take up that much additional space on your device. In addition to getting your Python and Jupyter Notebook tools up and running, nstalling Miniconda will also create a new command-line function called conda, which will give you a quick and easy way to keep both your Python and Jupyter Notebook installations up-to-date . You can find more information about how to do these updates in [Link to Come]. If you’re planning to do most of your Python programming in a notebook, I also still recommend installing a code editor. Even if you never use them to write a single line of Python, code editors are indispensible for viewing, editing and even creating your own data files more effectively and
efficiently than most devices’ built-in text-editing software. Most
<i>importantly, code editors do something called syntax highlighting, which is</i>
basically built-in grammar-checking for code and data. While that may not sound like much, the reality is that it will make your coding and debugging
<i>processes much faster and more reliable, because you’ll know (literally)</i>
where to look when there’s a problem. This combination of features makes a solid code editor one of the most important tools for both Python
<i>programming and general data wrangling.</i>
In this book I’ll be using and referencing the Atom (<i> code</i>
editor, which is free, multi-platform, and open-source. If you play around with the settings, you’ll find many ways to customize your coding
environment to suit your needs. Where I reference the color of certain characters or bits of code in this book, they reflect the default “One Dark” theme in Atom, but use whatever settings work best for you.
<small>11</small>
</div><span class="text_page_counter">Trang 33</span><div class="page_container" data-page="33"><small>You’ll need a strong, stable internet connection and about 30-60 minutes in order tocomplete the setup and installation processes below. I also strongly recommend that youhave your device plugged into a power source.</small>
To install your suite of data wrangling tools on a Chromebook, the first thing you’ll need to know is whether your version of the ChromeOS operating system is 32-bit or 64-bit.
To find this information, open up your Chrome settings (click the gear icon in the start menu, or search “settings” in the Launcher), and then click on About Chrome OS at the lower left. Towards the top of the window, you’ll see the version number followed by either (32-bit) or (64-bit), as shown below:
Make a note of this information before continuing with your setup.
<i>Installing Python and Jupyter Notebook</i>
To get started, go to:
<i> and download the Linux installer that matches the</i>
bit format of your ChromeOS version. Then, open your Downloads folder and drag the installer file (it will end in .sh) into your Linux files folder.
Next, open up a terminal window, run the ls command, and make sure that you see the Miniconda .sh file. If you do, run the following command
</div><span class="text_page_counter">Trang 34</span><div class="page_container" data-page="34">(remember, you can just type the beginning of the file name and then hit the tab key, and it will autocomplete!):
<small>bash _Miniconda_installation_filename_.sh</small>
Follow the directions that appear in your Terminal window (accept the license and the conda init prompt) then close and reopen your terminal window. Next, you’ll need to run:
<small>conda init</small>
Then close and reopen your terminal window again so that you can install Jupyter Notebook with the following command:
<small>conda install jupyter</small>
Answer yes to the subsequent prompts, close your terminal one last time, and you’re all set!
<i>Installing Atom</i>
To install Atom on your Chromebook, you’ll need to download the .deb package from and save it in (or move it to) your “Linux files” folder.
To install the software using the terminal, open a terminal window and type:
<small>sudo dpkg -i atom-amd64.deb</small>
And hit `enter` . Once the text has finished scrolling past and the
<i>command prompt (which ends with a $) is back, the installation is complete.</i>
Alternatively, you can context-click on the .deb file in your Linux files folder and choose the “Install with Linux” option from the top of the context menu, then choose “Install” and “OK”. You should see a progress bar on the bottom right of your screen and get a notification when the installation is complete.
<small>12</small>
</div><span class="text_page_counter">Trang 35</span><div class="page_container" data-page="35">Whichever method you use, once the installation is finished, you should see the green Atom icon appear in your “Linux apps” bubble in the Launcher.
You have two options when installing Miniconda on a Mac: you can use the terminal to install it using a .sh file, or you can install it by downloading and double-clicking the .pkg installer.
To get started, go to:
<i> If you want to do your installation with the</i>
terminal, download the Python 3.9 “bash” file that ends in .sh; if you prefer to use your mouse, download the .pkg file (You may see a notification from the operating system during the download process warning you that “This type of file can harm your computer”; choose “Keep”).
Whichever you method you select, open your Downloads folder and drag the file onto your Desktop.
If you want to try installing Miniconda using the terminal, start by opening a terminal window and using the cd command to point it to your Desktop:
<small>cd ~/Desktop</small>
Next, run the ls command, and make sure that you see the Miniconda .sh file in the resulting list. If you do, run the following command (remember, you can just type the beginning of the file name and then hit the tab key, and it will autocomplete!):
<small>bash _Miniconda_installation_filename_.sh</small>
Follow the directions that appear in your terminal window:
Use the spacebar to move through the license aggrement a full page at a time, and when you see (END) hit return
Type yes followed by return to accept the license agreement
</div><span class="text_page_counter">Trang 36</span><div class="page_container" data-page="36">Hit return to confirm the installation location, and type yes followed by return to accept the “conda init” prompt
Finally, close your terminal window.
If you would prefer to do the installation using your mouse, just double-click the .pkg file and follow the installation instructions.
Now that you have Miniconda installed, you need to open a new terminal window and type:
<small>conda init</small>
Then hit return'. Next, close and reopen your
terminal window, and use the following command (followed by `return) to install Jupyter Notebook:
<small>conda install jupyter</small>
Answer yes to the subsequent prompts.
<i>Installing Atom</i>
To install Atom on a Mac, visit and click the large yellow “Download” button in order to download the installer.
Click on the atom-mac.zip file in your Downloads folder, and then drag the Atom application (which will have a green icon next to it) into your Applications folder (this may prompt you for your password).
</div><span class="text_page_counter">Trang 37</span><div class="page_container" data-page="37">To make sure that both Python and Jupyter Notebook are working as expected, start by opening a terminal window and pointing it to the data_wrangling folder you created in “Getting started with the command line” by running the following command :
That means that Python was installed successfully. Next, test out Jupyter Notebook by running:
<small>jupyter notebook</small>
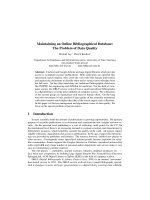
If a browser window opens that looks something like the image in Figure 1-1, you’re all set and ready to go!
<small>13</small>
</div><span class="text_page_counter">Trang 38</span><div class="page_container" data-page="38"><i><small>Figure 1-1. Jupyter Notebook running in an empty folder</small></i>
<b>Working with Python online</b>
If you want to skip the hassle of installing Python and code editor on your machine—and you plan to only use Python when you have a strong,
consistent internet connection—working with Jupyter notebooks online through Google Colab is a great option. All you’ll need to get started is an unrestricted Google account (you can create a new one if you prefer — make sure you know your password!). If you have those elements in place, you’re ready to get wrangling with our “Hello World!” exercise!
<b>Hello World!</b>
Now that you’ve got your data wrangling tools in place, you’re ready to get started writing and running your first Python program. For this, we’ll bow to programming tradition and create a simple “Hello World” program; all it’s designed to do is print out the words “Hello World!” To get started, you’ll need a new file where you can write and save your code.
<b>Using Atom to Create a Standalone Python File</b>
</div><span class="text_page_counter">Trang 39</span><div class="page_container" data-page="39">Atom works just like any other text-editing program; you can launch it using your mouse or even using your terminal.
To launch it with your mouse, locate the program icon on your device.
In the “start” menu or via search on Windows. If Atom doesn’t appear in your start menu or in search after installing it for the first time on Windows 10, this troubleshooting video may help:
Alternatively, you can open Atom from the terminal by simply running:
The first time you open Atom, on a Chromebook, you’ll see a prompt that says “Choose password for new keyring.” Since we’ll just be using Atom for code and data editing, you can choose hit “Cancel” to close this prompt. On a Mac, you’ll see a warning that Atom was downloaded from the
internet — you can also click past this prompt.
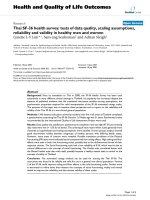
You should now see a screen similar to the one shown in Figure 1-2.
</div><span class="text_page_counter">Trang 40</span><div class="page_container" data-page="40"><i><small>Figure 1-2. Atom welcome screen</small></i>
</div>