báo cáo hóa học: " Thai SF-36 health survey: tests of data quality, scaling assumptions, reliability and validity in healthy men and women" pdf
Bạn đang xem bản rút gọn của tài liệu. Xem và tải ngay bản đầy đủ của tài liệu tại đây (248.9 KB, 9 trang )
BioMed Central
Page 1 of 9
(page number not for citation purposes)
Health and Quality of Life Outcomes
Open Access
Research
Thai SF-36 health survey: tests of data quality, scaling assumptions,
reliability and validity in healthy men and women
Lynette L-Y Lim*
1
, Sam-ang Seubsman
2
and Adrian Sleigh
1
Address:
1
National Centre for Epidemiology and Public Health, Mills Road, Australian National University, Acton, ACT, 0200, Australia and
2
School of Human Ecology, Sukhothai Thammathirat Open University, Pakkret, Nonthaburi, 11120, Thailand
Email: Lynette L-Y Lim* - ; Sam-ang Seubsman - ; Adrian Sleigh -
* Corresponding author
Abstract
Background: Since its translation to Thai in 2000, the SF-36 Health Survey has been used
extensively in many different clinical settings in Thailand. Its popularity has increased despite the
absence of published evidence that the translated instrument satisfies scoring assumptions, the
psychometric properties required for valid interpretation of the SF-36 summated ratings scales.
The purpose of this paper was to examine these properties and to report on the reliability and
validity of the Thai SF-36 in a non-clinical general population.
Methods: 1345 distance-education university students who live in all areas of Thailand completed
a questionnaire comprising the Thai SF-36 (Version 1). Median age was 31 years. Psychometric tests
recommended by the International Quality of Life Assessment Project were used.
Results: Data quality was satisfactory: questionnaire completion rate was high (97.5%) and missing
data rates were low (< 1.5% for all items). The ordering of item means within scales generally were
clustered as hypothesized and scaling assumptions were satisfied. Known groups analysis showed
good discriminant validity between subgroups of healthy persons with differing health states.
However, some areas of concern were revealed. Possible translation problems of the Physical
Functioning (PF) items were indicated by the comparatively low ceiling effects. High ceiling and floor
effects were seen in both role functioning scales, possibly due to the dichotomous format of their
response choices. The Social Functioning scale had a low reliability of 0.55, which may be due to
cultural differences in the concept of social functioning. The Vitality scale correlated better with
the Mental Health scale than with itself, possibly because a healthy mental state is central to the
concept of vitality in Thailand.
Conclusion: The summated ratings method can be used for scoring the Thai SF-36. The
instrument was found to be reliable and valid for use in a general non-clinical population. Version
2 of the SF-36 could improve ceiling and floor effects in the role functioning scales. Further work
is warranted to refine items that measure the concepts of social functioning, vitality and mental
health to improve the reliability and discriminant validity of these scales.
Published: 18 July 2008
Health and Quality of Life Outcomes 2008, 6:52 doi:10.1186/1477-7525-6-52
Received: 14 June 2007
Accepted: 18 July 2008
This article is available from: />© 2008 Lim et al; licensee BioMed Central Ltd.
This is an Open Access article distributed under the terms of the Creative Commons Attribution License ( />),
which permits unrestricted use, distribution, and reproduction in any medium, provided the original work is properly cited.
Health and Quality of Life Outcomes 2008, 6:52 />Page 2 of 9
(page number not for citation purposes)
Background
Since its translation to Thai in 2000[1], the SF-36 Health
Survey had been used extensively for assessing health-
related quality of life (QOL) in Thai patients with a range
of health conditions. It was used to evaluate functional
status in depressive patients [2], mental health problems
following the 2004 tsunami[3], QOL in postmenopausal
women with bladder problems[4] as well as in patients
with allergic rhinoconjunctivitis [5], severe cardiac fail-
ure[6] and sleep apnea[7]. Given the increasing popular-
ity of the Thai SF-36, it is important to be assured that the
psychometric properties required for valid interpretation
of the SF-36 scores have been retained in the translation
process.
Reliability and construct validity of the Thai SF-36 had
been tested in several studies. Internal consistency relia-
bility was assessed in cardiac patients[1] and in patients
with low back pain[8]. Recent studies of patients with
knee osteoarthritis [9,10] and of patients with allergic rhi-
noconjunctivitis reported on reliability and concurrent
validity of the instrument. The Thai SF-36 was also used as
the concurrent measure to determine the construct valid-
ity of other disease-specific QOL instruments (endstage
renal failure[11]; chronic liver failure[12]). These studies
concluded that the Thai SF-36 was reliable and valid for
assessing QOL in Thailand.
Although all of these studies used the summated ratings
method[13] to score the Thai SF-36 scales, none had veri-
fied that the Thai translation satisfied the scaling assump-
tions required to validate use of summated ratings
scores[13]. Other Asian translations of the SF-36,
although generally successful, had reported problems
which were revealed through psychometric tests. Discri-
minant validity, particularly between the concepts of
mental health and vitality, was of some concern in a Chi-
nese and a Japanese translation[14,15]. Watkins [16]
noted minor problems with internal consistency in sev-
eral of the scales in a Vietnamese translation. These prob-
lems were attributed to cultural differences in the
definition or structure of health and refinement of the
translations recommended.
The primary purpose of this paper was to perform, on the
Thai SF-36, tests of data quality, scaling assumptions, reli-
ability and validity according to the methods outlined by
the IQOLA Project [13]. A secondary purpose was to
examine the reliability and validity of the instrument
when applied to a large non-clinical general population
sample of men and women enrolled with the Sukhothai
Thammathirat Open University (STOU).
Methods
Data collection
The study took place in July 2005 and involved distance-
education students of the STOU from all areas in Thailand
who were in Bangkok for pre-graduation orientation. The
students were invited to complete a 4-page questionnaire
comprising the Krittaphong translation of the Thai SF-36
(Version 1)[1] and a few questions on socio-demographic
characteristics. The questionnaires were self-administered
and students returned completed questionnaires to
administrative personnel. This study was approved by the
Ethics Committee of the Australian National University
(protocol 2004344) and the Research and Development
Institute of STOU (no 0522/10).
Of the 1388 students who returned the survey, 97.5%
completed the questionnaire. The 43 incomplete ques-
tionnaires with entire pages left unanswered were not
included in the following analyses.
About half of the respondents (744) had participated also
in the baseline survey of an STOU-wide cohort study
begun earlier in 2005. This survey had sought wide-rang-
ing information on social demography, work, health serv-
ice use, disease and injury, social factors, environment,
food, physical activity, smoking and alcohol[17]. Selected
health-related information from this survey was used to
perform known-groups validity tests.
Coding of items and scales
The SF-36 Health Survey is a generic questionnaire con-
sisting of 36 items clustered to measure eight health con-
cepts: Physical Functioning (PF), Role Limitations due to
Physical Health (Role-Physical, RP), Bodily Pain (BP),
General Health Perceptions (GH), Vitality (VT), Social
Functioning (SF), Role Limitations due to Emotional
Problems (Role-Emotional, RE) and Mental Health (MH).
There is in addition a single-item measure of Health Tran-
sition (HT).
Item (raw) scores
Response choices for the items were on 2-, 3-, 5- or 6-
point scales. Item scores ranged from 1 to 2, 3, 5 or 6 and
were recoded so that all items scored in the same direc-
tion, with higher values indicating fewer limitations or
better health states.
Scale scores
The SF-36 scales were scored using the method of sum-
mated ratings which assumes that items within a hypoth-
esized scale can be summed without score
standardization or item weighting [13]. Each scale was
scored from 0 (worst possible health state) to 100 (best
possible health state) by transforming and averaging the
transformed scores[13]. The transformed score equaled
Health and Quality of Life Outcomes 2008, 6:52 />Page 3 of 9
(page number not for citation purposes)
100× (observed item score – lowest possible item score)/
(highest possible item score – lowest possible item score).
A missing value was assigned to a scale when more than
half of the items were missing. Where fewer items were
missing, they were replaced by the respondent's own
mean score for the remaining items on the scale.
Analytic methods
Data quality
The number of completed items, the percent of missing
data in every item and the frequency distribution of indi-
vidual items were determined.
Ordering of levels of health
The ordering of item means within its scale was examined
and compared with hypothesized orderings. Ware et a
l[18] hypothesized that it was less likely for people to
achieve higher than lower levels of a function or to
endorse positive than negative health states. An item that
measures a higher level of function should have a lower
mean than one that measures a lower level of function.
Items within a scale were put into clusters. Each cluster
comprised items measuring similar levels of function.
Items within the same cluster should have similar means
and no ordering was hypothesized. If each translated item
of the Thai SF-36 defined the same level of health as the
original SF-36, the item means should cluster in the same
order as hypothesized for the original SF-36.
Tests of scaling assumptions
Tests of scaling assumptions determine the appropriate-
ness of including an item in a particular scale and the
validity of using the summated ratings algorithm to con-
struct scale scores. Four tests were conducted:
1. Equal item variance: Items measuring the same concept
should have roughly equal standard deviations and
should be around 1.0 (for 5-choice response scales) [13].
2. Equality of item-scale correlations: Items in each scale
should contain approximately the same proportion of
information about the concept being measured. This
property was assessed by examining the correlation of an
item with its hypothesized scale after correcting for over-
lap. Correction for overlap is necessary because ordinary
correlations between an item and the scale of which it is a
part are spuriously inflated. The method of Cureton [19]
was used, wherein the item in question was replaced by a
rationally equivalent item [19].
3. Item internal consistency: An item should measure what
its scale is intended to measure (internal consistency).
This property would be demonstrated by a scale if the
item-scale correlations, corrected for overlap, of all items
in the scale were 0.4 or greater.
4. Item discriminant validity: The correlation of each item
with its hypothesized scale should be significantly higher
than correlations of the same item with other scales. Item
discriminant validity was supported, and the test consid-
ered a "definite success"[20], if item-scale correlations,
corrected for overlap, were at least two standard errors
above the correlations between that item and all the other
scales. The standard error (SE) used was the SE for a corre-
lation coefficient, which is approximately one divided by
the square-root of the sample size. Seven item discrimi-
nant validity tests were conducted for each item.
After performing the item-level analyses above, sum-
mated rating scales were constructed and scale-level anal-
yses were carried out. These included examination of
scale-level properties, reliability and construct validity.
Statistical properties
The five scales which primarily measure disability (PF, RP,
BP, SF, RE) should have the highest mean scale scores,
while lower mean scores should be found for the three
scales which extend measurement to the well-being range
(GH, VT, MH). In order for a scale to include all important
levels of the concept it measures, scale scores should have
substantial variability and the full range of the measure
should be used. The percentage of respondents with
scores at the ceiling (score of 100) and floor (score of 0)
were calculated for each scale. Ceiling and floor effects
should be less than 20% to ensure that the scale is captur-
ing the full range of potential responses in the population
and that changes over time can be detected.
Reliability
Internal consistency reliability was estimated with the
Cronbach α coefficient. It is a measure of the extent to
which items within the same scale correlate with each
other. It can be thought of as a correlation between a scale
and itself. The α coefficient ranges from 0 to 1: values
greater than 0.70 are generally considered acceptable for
group comparisons, and 0.90 for person-level compari-
sons [13].
Construct validity
Construct validity was assessed by examining the correla-
tions between the scales and by checking "known groups"
validity[21]. Substantial correlation (Pearson's r > 0.40)
was hypothesized between scales that were conceptually
related (convergent validity). To evaluate how distinct
each scale was from other scales (divergent validity), inter-
scale correlations were compared with internal consist-
ency reliability coefficients. Known groups validity was
tested by comparing scale scores, adjusted for age and sex,
across groups known to differ. SF-36 scores were hypoth-
esized to be lower in persons with disabling health-related
conditions; specifically depression/anxiety, arthritis,
Health and Quality of Life Outcomes 2008, 6:52 />Page 4 of 9
(page number not for citation purposes)
impaired vision not correctable by refraction and prob-
lems with eating, chewing or swallowing caused by teeth
or dentures. These tests were performed on the sample of
744 participants using data from the cohort baseline sur-
vey.
Results
Median age of the analysis sample was 31 years. The range
spanned 21 to 78 years, with more than 85% under 40
years. Almost two-thirds (61.4%) were females.
Data quality
The percent of missing item-level data was low – 32 of the
36 items showed less than 1% missing (Table 1). All of the
response choices were used. The percent of respondents
with computable scale scores was high: over 99% of
respondents for seven scales, and 98.9% for the SF scale.
Ordering of item means
The ordering of item means within each scale was consist-
ent with hypothesized expectations along the health con-
Table 1: Item percent missing, item means and standard deviations (SD)
a
Scale SF-36 Item % Missing Mean SD
Physical Functioning (PF)
Vigorous activities PF1 1.1 1.99 0.64
Walking more than a kilometer PF7 1.0 2.22 0.73
Climbing several flights of stairs PF4 1.0 2.51 0.63
Bending, kneeling, stooping PF6 1.0 2.56 0.59
Lifting or carrying groceries PF3 1.2 2.56 0.61
Moderate activities PF2 0.5 2.58 0.57
Walking more than 100 m PF8 0.7 2.65 0.58
Climbing one flight of stairs PF5 1.3 2.74 0.50
Walking 100 m PF9 1.3 2.76 0.50
Bathing or dressing PF10 0.5 2.90 0.33
Role-Physical (RP)
Accomplished less than would like RP2 0.1 1.82 0.38
Difficulty performing work/activities RP4 0.2 1.76 0.43
Cut down time spent on work RP1 0.2 1.83 0.38
Limited in kind of work/activities RP3 0.2 1.88 0.33
Bodily Pain (BP)
Intensity of bodily pain BP1 0.3 4.51 1.11
Extent pain interfered with work BP2 0.7 4.24 0.76
General Health (GH)
Rating of general health GH1 0.0 3.07 0.78
My health is excellent GH5 0.7 3.58 1.09
I seem as healthy as anyone I know GH3 0.3 3.96 0.98
I seem to get sick easier than others GH2 0.7 3.76 1.12
I expect my health to get worse GH4 0.7 3.80 1.12
Vitality (VT)
Have a lot of energy VT2 0.5 3.62 0.98
Full of life VT1 0.5 3.75 0.93
Feel worn out VT3 0.6 4.52 0.88
Feel tired VT4 0.2 4.55 0.91
Social Functioning (SF)
Extent health problems interfered SF1 0.5 4.31 0.75
Frequency health problems interfered SF2 0.7 3.94 0.98
Role-Emotional (RE)
Accomplished less than would like RE2 0.5 1.77 0.42
Cut down time spent on work RE1 0.4 1.78 0.42
Work not done as carefully as usual RE3 0.5 1.87 0.34
Mental Health (MH)
Felt calm and peaceful MH3 0.5 3.30 0.93
Been a happy person MH5 0.6 4.11 0.98
Been a very nervous person MH1 0.2 4.35 0.85
Felt down hearted and blue MH4 0.5 4.85 0.92
Felt down in the dumps MH2 0.5 4.92 0.92
Health Transition (HT)
Change in health from one year ago HT 0.2 2.88 0.84
a
Items within a scale are ordered according to their relative expected means[20], with items having the highest expected mean at the top.
Health and Quality of Life Outcomes 2008, 6:52 />Page 5 of 9
(page number not for citation purposes)
tinuum (Table 1). Within the PF scale, the most difficult
item (PF1: vigorous exercise) had the lowest mean and the
easiest item (PF10: bathing and dressing) had the highest
mean. Item means decreased across clusters of PF items as
hypothesized; for example respondents reported more
limitations (lower mean score) in climbing several stairs
(PF4) than one flight of stairs (PF5).
Within the VT scale, items that measured energy or well-
being (VT1 and VT2) had lower means than items meas-
uring fatigue or disability (VT3 and VT4) as hypothesized.
Within the MH scale, items measuring positive affect
(MH3 and MH5) had lower means than items measuring
negative affect (MH1, MH2 and MH4).
The two role functioning items that asked if the respond-
ent "accomplished less" (RP2 and RE2) were hypothe-
sized to have the lowest mean within its scale. This was
observed for RE2 within the RE scale, but RP2 did not
have the lowest mean in the RP scale. The only other item
whose order was not as hypothesized was GH3 ("healthy
as anyone I know").
The mean score for the Health Transition item was 2.88,
indicating that respondents on average rated their health
marginally worse than a year ago.
Tests of scaling assumptions
Standard deviations of items within a scale were similar
and close to 1.0 for BP, GH, VT, SF and MH (scales with 5-
and 6-choice responses).
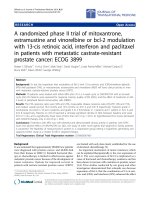
Figure 1 summarises the results visually for the other three
scaling assumption tests. For all but two scales, correla-
tions of items with their hypothesized scales were roughly
equal. The item-scale correlations of all items were 0.08
units or less from at least one other item-scale correlation
within its scale, except the item-scale correlations of RE3
Thai SF-36 item-scale correlationsFigure 1
Thai SF-36 item-scale correlations. The horizontal axis shows the individual items; the vertical axis shows item-scale cor-
relations. Correlations are labelled with letters to indicate the scale (P = PF, R = RE, B = BP, G = GH, V = VT, S = SF, E = RE,
M = MH). Correlations are displayed in large font for hypothesized scales and in smaller font for non-hypothesized scales.
R
B
G
V
S
E
M
R
B
G
V
S
E
M
R
B
G
V
S
EM
R
BG
V
SE
M
R
BG
VS
E
M
RBG
V
S
EM
R
B
G
V
S
E
M
R
B
G
V
S
E
M
R
B
G
V
S
E
M
R
B
G
V
S
E
M
P
B
G
V
S
E
M
P
B
GV
S
E
M
P
B
G
V
S
E
M
P
B
GV
S
E
M
P
R
GV
S
E
M
P
R
G
V
S
E
M
P
R
B
V
S
E
M
P
R
B
V
S
E
M
PR
B
V
S
E
M
P
R
B
V
S
E
M
P
R
B
V
S
E
M
P
R
B
G
S
E
M
P
R
B
G
S
E
M
P
R
B
G
S
E
M
P
R
B
G
S
E
M
P
R
B
G
VE
M
P
R
B
G
V
E
M
P
R
B
G
V
S
M
P
R
B
G
V
S
M
P
R
B
G
V
S
M
P
R
B
G
V
S
E
P
R
B
G
V
S
E
PR
B
G
V
S
E
P
R
B
G
V
S
E
P
R
B
G
V
S
E
P
P
P
P
P
P
P
P
P
P
R
R
R
R
BB
G
G
G
G
G
V
V
V
V
SS
EE
E
M
M
M
M
M
0
.2
.4
.6
.8
Pearson item-scale correlations
PF1
PF2
PF3
PF4
PF5
PF6
PF7
PF8
PF9
PF10
RP1
RP2
RP3
RP4
BP1
BP2
GH1
GH2
GH3
GH4
GH5
VT1
VT2
VT3
VT4
SF1
SF2
RE1
RE2
RE3
MH1
MH2
MH3
MH4
MH5
Health and Quality of Life Outcomes 2008, 6:52 />Page 6 of 9
(page number not for citation purposes)
and MH3 which were 0.17 and 0.19 units respectively
from the next closest item-correlations in their scales. All
item-scale correlations were greater than 0.40. The success
rate for the item internal consistency test was 100% for all
scales (Table 2). Looking at the distances between item
correlations with their hypothesized scales and correla-
tions of the same item with the non-hypothesized scales,
the smallest distance was 0.11, between the MH5-MH cor-
relation and the MH5-VT correlation (Figure 1), which
was greater than two standard errors apart. This implied
that all items achieved "definite scaling success" (Table 2).
Scale properties
As hypothesized, the scales measuring both positive and
negative aspects of well-being (GH, VT and MH) pro-
duced lower mean scores than the scales measuring disa-
bility (PF, RP, BP, SF and RE) (Table 3).
The distributions of scores showed good spread, with the
full 0–100 range observed in six of the eight scales (Table
3). As expected for a sample primarily composed of
healthy respondents, response distributions tended to be
skewed in the direction of positive health (relatively high
median and negative skewness). The relatively low mean
of 77.3 for PF was surprising, given the relative youth and
health of the sample, as was its low ceiling effect of 8.7%.
The percentage of respondents scoring the lowest scale
level (floor effect) was minimal. Floor effects were
observed in less than 1% of the sample for all but the two
role functioning scales (RP and RE). The dichotmous
response format of the RP and RE scales also resulted in
these scales exhibiting substantial ceiling effects (> 60%).
The scales which measure both disability and well-being
(GH, VT, MH) showed minimal floor and ceiling effects.
Reliability
Internal consistency reliability estimates of six of the eight
scales exceeded the 0.70 level recommended for group
comparisons, though none met the criterion for person-
level comparisons (Table 4). The reliability estimate for
the SF scale was low (0.55); that for the VT scale (0.68)
was only marginally below the 0.70 criterion.
Validity
Higher coefficients were found between scales which rep-
resent similar constructs (eg MH and VT) than those with
competing constructs (eg PF and RE). Comparisons of
inter-scale correlations revealed that the scale constructs
were generally distinct: most of the inter-scale correlation
coefficients were low to medium (0.21 to 0.51). The
exception was an inter-scale correlation of 0.71 between
the VT and the MH scales.
All SF-36 scores were higher in persons without the disa-
bling health condition than in persons with the condition
(Table 5). In the comparison of depression or anxiety,
scales which showed statistical significance tended to be
those relating to mental health, while in the comparison
of arthritis, scales relating to physical health showed sta-
tistically significance.
Discussion
This paper demonstrated that psychometric properties of
the Thai SF-36 were satisfactory according to the criteria
set by the IQOLA project protocol. In particular, the Thai
SF-36 can be scored using the summated ratings method.
The results have added to existing evidence that the con-
cepts embodied in the SF-36 are applicable to the Thai
population.
Table 2: Tests of scaling assumptions
Scale # items per
scale, k
(a) Item internal consistency (b) Item discriminant validity
Range
a
Comparison
b
Success rate (%) Range
c
Comparison
d
Success rate (%)
PF 10 0.48 – 0.68 10/10 100 0.10 – 0.31 70/70 100
RP 4 0.65 – 0.77 4/4 100 0.18 – 0.44 28/28 100
BP 2 0.83 2/2 100 0.22 – 0.46 14/14 100
GH 5 0.60 – 0.79 5/5 100 0.14 – 0.45 35/35 100
VT 4 0.64 – 0.75 4/4 100 0.16 – 0.59 28/28 100
SF 2 0.77 2/2 100 0.20 – 0.40 14/14 100
RE 3 0.67 – 0.84 3/3 100 0.18 – 0.44 21/21 100
MH 5 0.50 – 0.75 5/5 100 0.12 – 0.66 35/35 100
a
Correlations between items and hypothesized scale, corrected for overlap
b
Number of items out of k with correlation ≥ 0.40
c
Correlations between items and other scales
d
Number of items out of 7 × k where difference between the correlation of the item with its own scale and correlation with the other scales ≥ 2SE
(= 0.0576)
Health and Quality of Life Outcomes 2008, 6:52 />Page 7 of 9
(page number not for citation purposes)
Overall data quality was satisfactory. Questionnaire com-
pletion rate (97.5%) was high and compared favourably
with rates ranging from 88% to 99% reported for self-
administered surveys of the SF-36 in other countries [21].
Of the 43 respondents who missed pages, most had omit-
ted questions on the reverse side of the page and the
remainder answered only the first few pages. Missing data
rates (< 1.5% for all items) were low. Use of all of the
response choices for all 36 items suggested that transla-
tions of all response choices and the associated items were
understood.
The ordering of item means within scales generally were
clustered as hypothesized, with two exceptions involving
the "role-physical accomplished less" (RP2) and "healthy
as anyone I know" (GH3) items. The deviation of RP2 was
small, only 0.06, so not surprising given the coarse struc-
ture of the dichotomous response choices. Similar devia-
tions of GH3 observed in other studies[20,22] were
attributed to the difference in construction of GH3, which
measures health relative to other people, and the con-
struction of GH1 and GH5, which measure absolute
health.
Results of the scaling assumption tests basically supported
the hypothesized scale structure of the SF-36 in Thailand
and use of the summated ratings algorithm. The only scal-
ing assumption not fully satisfied was the lack of equality
in the item-scale correlations of RE3 and the other RE
items and of MH3 and the other MH items. Other studies
had found similar discrepancies; e.g. [16,22]. These dis-
crepancies were not considered significant problems as
Ware & Gandek[13]'s view was that: "when all items con-
tribute fully to the total score, this standard [equality of
item-scale correlations] can be considered fully satisfied
even if item-scale correlations vary".
A few areas warrant further examination. Unlike most
other general population samples (for example, [15,22-
24]) the mean PF scale score in this study was higher than
the mean scale scores of RP and BP. The ceiling effect of
the PF scale (8.7%) was also lower than in other general
population samples which were typically greater than
20%[20]. These differences suggested the possibility of
translation problems in the PF scale.
The high ceiling effects in the two role functioning scales
(RP 79%; RE 77.3%) could be explained, at least partly, by
the dichotomous format of the items comprising these
scales. Similar results had been observed in many other
studies; for example in Gandek's comparison of 11 coun-
tries [21], ceiling effects ranged from 63.3% to 82.9% for
RP and from 69.0% to 82.8% for RE. The limitations of
these dichotomous items could be minimized by extend-
ing the response choices, such as the 5-point Likert
response in Version 2 of the SF-36.
Except for the SF scale, internal consistency reliability was
generally acceptable for group-level comparisons. Low
reliability of the SF scale had been observed in elsewhere
including several Asian studies. Chinese translations
reported reliabilities of 0.39, 0.54, 0.57 and
0.65[15,22,23,25]; 0.67 was found in a Vietnamese trans-
lation [16] and 0.68 in a Japanese translation[20]. In
Asian cultures translation of these items had been
reported to be difficult because of cultural differences in
the concept of social functioning. Wagner [26] reported
on the high difficulty ratings in translation of the SF items
in a cross-cultural comparison of 10 countries.
The correlations between scales generally were less than
the within-scale correlations (reliability coefficient). This
was indication that the Thai SF-36 scales generally could
Table 3: Descriptive statistics for the eight scales
Scale Range Median Mean SD Skewness %Floor %Ceiling
PF 0 – 100 80 77.3 17.4 -1.04 0.3 8.7
RP 0 – 100 100 82.2 28.6 -1.54 4.5 64.9
BP 10 – 100 77.5 75.6 18.4 -0.46 0 20.6
GH 0 – 100 65 65.1 18.1 -0.56 0.2 0.6
VT 0 – 100 60 62.2 13.3 -0.30 0.1 0.3
SF 0 – 100 75 78.2 18.2 -0.58 0.1 26.0
RE 0 – 100 100 80.4 31.9 -1.41 7.4 67.4
MH 8 – 100 68 66.1 12.9 -0.48 0 0.4
Table 4: Inter-scale correlations and internal consistency
reliability (Cronbach α coefficients, on the diagonal)
PF RP BP GH VT SF RE MH
PF 0.80
RP 0.29 0.75
BP 0.23 0.38 0.74
GH 0.29 0.32 0.41 0.75
VT 0.21 0.30 0.39 0.51 0.68
SF 0.24 0.34 0.45 0.39 0.44 0.55
RE 0.21 0.51 0.35 0.28 0.37 0.39 0.73
MH 0.21 0.29 0.33 0.47 0.71 0.47 0.39 0.74
Health and Quality of Life Outcomes 2008, 6:52 />Page 8 of 9
(page number not for citation purposes)
discriminate between the different concepts being meas-
ured, excepting the concepts of vitality and mental health.
Although both the VT and MH items individually had
higher correlations with their hypothesized scales than
with other scales, the VT scale was found to correlate
higher with the MH scale than with itself. Several other
studies had also reported moderately high correlations
(over 0.60) between these scales [15,24,25]. In a cross-
country comparison of primarily Western countries, Gan-
dek et al[20] attributed the substantial correlations
observed to a "method effect" due to the different con-
structions of some of the items in the two scales. In the
Asian studies[15,25], however, the high correlations
between the VT and MH scales were attributed to cultural
differences where happiness and a healthy mental state
were central to the concept of vitality. When evaluating a
Chinese translation, Chang et al[27] suggested that the
vitality and mental health items could be more meaning-
fully reorganized along the dimensions of well-being and
distress. Watkins et al [16], in developing a Vietnamese
translation, had modified the conceptual definition of the
MH and VT scales to produce culturally more appropriate
scales with clearer delineation between these concepts.
For Thai people, who like Vietnamese and mainland Chi-
nese are predominantly Buddhists, a healthy mental state
is fundamental to vitality. Further work to refine the items
measuring these concepts is warranted.
Previous studies had reported that the Thai SF-36 could
discriminate between different levels of ill health in clini-
cally ill subjects[1,2,4,5,9]. Known groups analysis in this
study indicated that the Thai SF-36 also discriminated
well between generally healthy persons who differed in
health states. Persons who had depression, arthritis,
impaired vision or difficulty eating scored significantly
lower on several of the SF-36 scales.
This study had two main limitations. First, generalisability
of the results to all of Thailand is limited as this study was
conducted on a convenience sample of STOU students
and would not be representative of the general population
in Thailand. Second, data quality and acceptability of the
instrument could have been over-estimated as assess-
ments could be performed only on the questionnaires
which were returned.
Conclusion
The present study has provided valuable additional evi-
dence that supports use of the Thai SF-36. The results have
filled a gap by confirming that the summated ratings
method can be used to score the Thai SF-36. Reliability
and validity were established for use of the instrument in
the general population. Problems revealed through the
psychometric tests indicated that there may be some
translation problems with the Physical Functioning scale,
that ceiling and floor effects could be reduced with use of
Version 2 of the SF-36, and that refinement of items in the
Social Functioning, Vitality and Mental Health scales
could improve reliability and discriminant validity of
these scales.
Abbreviations
BP: Bodily Pain; GH: General Health; IQOLA: Interna-
tional Quality of Life Assessment; MH: Mental Health; PF:
Physical Functioning; QOL: Quality of Life; RE: Role-
Emotional; RP: Role-Physical; SF-36: Short Form 36; SF:
Social Functioning; STOU: Sukhothai Thammathirat
Open University; VT: Vitality.
Table 5: Comparison of scale scores between persons with and without selected health conditions
a
%PF RP BP GH VT SF RE MH
Depression
1
No 96 77.5 (17.4) 82.2 (28.5) # 74.9 (18.2) 65.2 (17.4) $ 61.8 (13.5) # 78.3 (18.5) # 80.2 (31.8) $ 65.5 (13.0) $
Yes 4 71.7 (14.8) 65.1 (37.5) 70.0 (19.1) 48.6 (22.0) 53.7 (13.2) 66.7 (17.8) 52.6 (41.6) 56.4 (12.7)
Arthritis
1
No 95 77.7 (16.9) * 82.9 (28.4) $ 75.3 (18.1) # 65.0 (17.8) 61.6 (13.6) 77.9 (18.6) 79.3 (32.5) 65.3 (12.9)
Yes 5 71.1 (22.8) 61.5 (31.9) 65.8 (18.1) 58.6 (17.4) 59.1 (12.7) 77.3 (18.8) 78.7 (33.0) 61.9 (15.9)
Impaired vision not correctable by glasses/contact lens
2
No 90 78.0 (16.9) 84.1 (27.5) * 76.0 (18.3) 66.8 (17.4) # 62.7 (13.4) # 79.4 (18.2) * 81.8 (31.0) 66.5 (13.1) #
Yes 10 75.1 (18.2) 76.5 (33.3) 74.0 (16.9) 60.4 (17.2) 58.0 (14.4) 74.7 (19.9) 74.3 (35.9) 62.0 (13.2)
Problems caused by teeth or dentures
3
No 71 79.0 (16.8) # 84.2 (27.4) 77.3 (18.1) $ 67.8 (17.7) $ 62.9 (13.6) * 79.5 (18.7) 82.6 (31.1) * 66.9 (13.2) #
Yes 29 75.4 (16.6) 81.0 (30.3) 71.6 (18.2) 62.3 (17.6) 60.4 (13.6) 77.1 (18.4) 77.0 (31.6) 63.7 (13.2)
a
Cells show mean (standard deviation). Symbols beside figures indicate statistical significance of the comparison: * = p < 0.01; # = p < 0.001; $ = p
< 0.0001
1
Based on self-report to the question "Ever been told by a doctor that you have this condition"
2
Answer to the question "Do you currently have any sight problems not correctable by glasses/contact lenses (eg cataract)"
3
In response to the question "Do your teeth currently cause you ", ticking "yes" to any of the conditions "discomfort speaking", "discomfort
swallowing", "discomfort chewing" or "pain".
Publish with BioMed Central and every
scientist can read your work free of charge
"BioMed Central will be the most significant development for
disseminating the results of biomedical research in our lifetime."
Sir Paul Nurse, Cancer Research UK
Your research papers will be:
available free of charge to the entire biomedical community
peer reviewed and published immediately upon acceptance
cited in PubMed and archived on PubMed Central
yours — you keep the copyright
Submit your manuscript here:
/>BioMedcentral
Health and Quality of Life Outcomes 2008, 6:52 />Page 9 of 9
(page number not for citation purposes)
Competing interests
The authors declare they have no competing interests.
Authors' contributions
LL, SS and AS jointly conceived the study. LL performed
the statistical analysis and drafted the manuscript. SS
designed, managed and coordinated the study. AS partici-
pated in the study conduct and manuscript preparation.
All authors read and approved the final manuscript.
Acknowledgements
This study was supported by the International Collaborative Grants
Scheme with joint grants from the Wellcome Trust UK (GR0587MA) and
the Australian NHMRC (268055). We thank Suttinan Pangsap, Pathumva-
dee Somsamai and Tarie Dellora for their assistance. We are indebted to
the reviewers for their incisive comments which have greatly improved this
paper.
References
1. Krittayaphong R, Bhuripanyo K, Raungratanaamporn O, Chotinaiwa-
tarakul C, Chaowalit N, Punlee K, Kangkagate C, Chaithiraphan S:
Reliability of Thai version of SF-36 questionnaire for the eval-
uation of quality of life in cardiac patients. Journal of the Medical
Association of Thailand 2000, 83:S130-136.
2. Kongsakon R: The functioning and quality of life of depressive
patients with 12 weeks of psychiatric care. Journal of the Medical
Association of Thailand 2005, 88:1261-1266.
3. van Griensven F, Chakkraband M, Thienkrua W, Pengjuntr W, Car-
dozo BL, Tantipiwatanaskul P, Mock P, Ekassawin S, Varangrat A, Got-
way C, Sabin M, Tappero JW, Thailand Post-Tsunami Mental Health
Study Group: Mental health problems among adults in tsu-
nami-affected areas in southern Thailand. Journal of the Ameri-
can Medical Association 2006, 296:537-548.
4. Bunyavejchevin S: The impact of overactive bladder, stress and
mixed urinary incontinence on quality of life in Thai post-
menopausal women. Journal of the Medical Association of Thailand
2006, 89:294-298.
5. Bunnag C, Leurmarnkul W, Jareoncharsri P, Tunsuriyawong P, Assa-
nasen P, Pawankar R: Quality of life assessment in Thai patients
with allergic rhinoconjunctivitis using the SF-36 question-
naire (Thai version). Rhinology 2005, 43:99-103.
6. Sunsaneewitayakul B, Sitthisook S, Sangwatanaroj S, Prechawat S,
Boonyaratavej S: Feasibility, safety, and mid-term efficacy of
cardiac resynchronization therapy in patients with severe
heart failure and ventricular conduction delay: Chulalong-
korn experience. Journal of the Medical Association of Thailand 2007,
90:1458-1466.
7. Sungkanakara C, Assanasen P, Banhiran W, Metheetrairut C:
Abstracts 2nd world congress of the world association of
sleep medicine (WASM). assessment of quality of life in Thai
population with snoring and/or obstructive sleep apnea.
Sleep Medicine 2007, 8:S97.
8. Jirarattanaphochai K, Jung S, Sumananont C, Saengnipanthkul S: Reli-
ability of the medical outcomes study short-form survey ver-
sion 2.0 (Thai version) for the evaluation of low back pain
patients. Journal of the Medical Association of Thailand 2005,
88:1355-1361.
9. Charoencholvanich K, Pongcharoen B: Oxford knee score and SF-
36: translation & reliability for use with total knee arthros-
copy patients in Thailand. Journal of the Medical Association of Thai-
land 2005, 88:1194-1202.
10. Tangtrakulwanich B, Wiwatwongwana S, Chongsuvivatwong V,
Geater A:
Comparison of validity, and responsiveness
between general and disease-specific quality of life instru-
ments (Thai version) in knee osteoarthritis. Journal of the Med-
ical Association of Thailand 2006, 89:1454-1459.
11. Cheawchanwattana A, Limwattananon C, Gross C, Limwattananon S,
Tangcharoensathien V, Pongskul C, Sirivongs D: The validity of a
new practical quality of life measure in patients on renal
replacement therapy. Journal of the Medical Association of Thailand
2006, 89(Suppl 2):S207-217.
12. Sobhonslidsuk A, Silpakit C, Kongsakon R, Satitpornkul P, Sripetch C:
Chronic liver disease questionnaire: translation and valida-
tion in Thais. World Journal of Gastroenterology 2004, 10:1954-1957.
13. Ware J, Gandek B: Methods for testing data quality, scaling
assumptions, and reliability: the IQOLA Project approach.
Journal of Clinical Epidemiology 1998, 51:945-952.
14. Fukuhara S, Ware JJ, Kosinski M, Wada S, Gandek B: Psychometric
and clinical tests of validity of the Japanese SF-36 Health Sur-
vey. Journal of Clinical Epidemiology 1998, 51:1045-1053.
15. Tseng H, Lu J, Gandek B: Cultural issues in using the SF-36
health survey in Asia: Results from Taiwan. Health and Quality
of Life Outcomes 2003, 1:72.
16. Watkins R, Plant A, Sang D, O'Rourke T, Gushulak B: Development
of a Vietnamese version of the short form-36 health survey.
Asia Pacific Journal of Public Health 2000, 12:118-123.
17. Sleigh A, Seubsman S, Bain C, Thai Cohort Study Team: Cohort pro-
file: The Thai cohort of 87 134 open university students. Inter-
national Journal of Epidemiology 2007.
18. Ware J, Keller S, Gandek B, Brazier J, Sullivan M: Evaluating trans-
lations of health status questionnaires. Methods from the
IQOLA project. International quality of life assessment. Int J
Technol Assess Health Care 1995, 11:525-551.
19. Cureton E: Corrected item-test correlations. Psychometrika
1966, 31:93-96.
20. Gandek B, Ware JJ, Aaronson N, Alonso J, Apolone G, Bjorner J, Bra-
zier J, Bullinger M, Fukuhara S, Kaasa S, Leplege A, Sullivan M: Tests
of data quality, scaling assumptions, and reliability of the SF-
36 in eleven countries: Results from the IQOLA Project.
International Quality of Life Assessment. Journal of Clinical Epi-
demiology 1998, 51:1149-1158.
21. Gandek B, Ware JJ: Methods for validating and norming trans-
lations of health status questionnaires: the IQOLA Project
approach. International Quality of Life Assessment. Journal of
Clinical Epidemiology 1998, 51:953-959.
22. Lam CL, Gandek B, Ren XS, Chan MS: Tests of scaling assump-
tions and construct validity of the Chinese (HK) version of
the SF-36 Health Survey. J Clin Epidemiol 1998, 51:1139-1147.
23. Li L, Wang HM, Shen Y: Chinese SF-36 health survey: transla-
tion, cultural adaptation, validation, and normalisation. J Epi-
demiol Community Health 2003, 57:259-263.
24. Sabbah I, Drouby N, Sabbah S, Retel-Rude N, Mercier M: Quality of
life in rural and urban populations in Lebanon using SF-36
health survey. Health Qual Life Outcomes 2003, 1:30.
25. Ren XS, Amick B 3rd, Zhou L, Gandek B: Translation and psycho-
metric evaluation of a Chinese version of the SF-36 health
survey in the United States. J Clin Epidemiol 1998, 51:1129-1138.
26. Wagner AK, Gandek B, Aaronson NK, Acquadro C, Alonso J,
Apolone G, Bullinger M, Bjorner J, Fukuhara S, Kaasa S, Leplege A, Sul-
livan M, Wood Dauphinee S, Ware JE Jr: Cross-cultural compari-
sons of the content of SF-36 translations across 10 countries:
results from the IQOLA Project. International Quality of
Life Assessment. J Clin Epidemiol 1998, 51:925-932.
27. Chang DF, Chun CA, Takeuchi DT, Shen H: SF-36 health survey:
tests of data quality, scaling assumptions, and reliability in a
community sample of Chinese Americans. Med Care 2000,
38:542-548.