Microeconomics, 7/E - Robert Pindyck, Daniel Rubinfeld pptx
Bạn đang xem bản rút gọn của tài liệu. Xem và tải ngay bản đầy đủ của tài liệu tại đây (2.24 MB, 270 trang )
Chapter 1: Preliminaries
1
PART I
INTRODUCTION:
MARKETS AND PRICES
CHAPTER 1
PRELIMINARIES
Chapter 1: Preliminaries
2
EXERCISES
1. Decide whether each of the following statements is true or false and explain why:
a. Fast food chains like McDonald’s, Burger King, and Wendy’s operate all over the
United States. Therefore the market for fast food is a national market.
This statement is false. People generally buy fast food within their current
location and do not travel large distances across the United States just to buy
a cheaper fast food meal. Given there is little potential for arbitrage
between fast food restaurants that are located some distance from each other,
there are likely to be multiple fast food markets across the country.
b. People generally buy clothing in the city in which they live. Therefore there is a
clothing market in, say, Atlanta that is distinct from the clothing market in Los
Angeles.
This statement is false. Although consumers are unlikely to travel across the
country to buy clothing, suppliers can easily move clothing from one part of
the country to another. Thus, if clothing is more expensive in Atlanta than
Los Angeles, clothing companies could shift supplies to Atlanta, which
would reduce the price in Atlanta. Occasionally, there may be a market for
a specific clothing item in a faraway market that results in a great opportunity
for arbitrage, such as the market for blue jeans in the old Soviet Union.
Chapter 1: Preliminaries
3
c. Some consumers strongly prefer Pepsi and some strongly prefer Coke.
Therefore there is no single market for colas.
This statement is false. Although some people have strong preferences for a
particular brand of cola, the different brands are similar enough that they
constitute one market. There are consumers who do not have strong
preferences for one type of cola, and there are consumers who may have a
preference, but who will also be influenced by price. Given these
possibilities, the price of cola drinks will not tend to differ by very much,
particularly for Coke and Pepsi.
2. The following table shows the average retail price of butter and the Consumer
Price Index from 1980 to 2001.
ˇ
1980 1985 1990 1995 2000 2001
CPI 100 130.58 158.62 184.95 208.98 214.93
Retail Price of butter $1.88 $2.12 $1.99 $1.61 $2.52 $3.30
(salted, grade AA, per
lb.)
Chapter 1: Preliminaries
a. Calculate the real price of butter in 1980 dollars. Has the real price
increased/decreased/stayed the same since 1980?
Real price of butter in year X =
CP
I
1980
CPI
year X
*nominal price in year X
.
1980 1985 1990 1995 2000 2001
$1.88 $1.62 $1.25 $0.87 $1.21 $1.54
Since 1980 the real price of butter has decreased.
b. What is the percentage change in the real price (1980 dollars) from 1980 to 2001?
Percentage change in real price from 1980 to 2001 =
1.54 − 1.88
1.88
=−0.18 =−18%
.
c. Convert the CPI into 1990 = 100 and determine the real price of butter in 1990
dollars.
To convert the CPI into 1990=100, divide the CPI for each year by the CPI
for 1990. Use the formula from part (a) and the new CPI numbers below to
find the real price of milk.
4
Chapter 1: Preliminaries
New CPI 1980 63.1 Real price of milk 1980 $2.98
1985 82.3 1985 $2.58
1990 100 1990 $1.99
1995 116.6 1995 $1.38
2000 131.8 2000 $1.91
2001 135.6 2001 $2.43
d. What is the percentage change in the real price (1990 dollars) from 1980 to 2001?
Compare this with your answer in (b). What do you notice? Explain.
Percentage change in real price from 1980 to 2001 =
−2.43 2.98
=− =−0.18 18%
2.98
. This answer is almost identical (except for
rounding error) to the answer received for part b. It does not matter which
year is chosen as the base year.
3. At the time this book went to print, the minimum wage was $5.15. To find the
current minimum wage, go to
/> Click on: Consumer Price Index- All Urban Consumers (Current Series)
Select: U.S. All items
5
Chapter 1: Preliminaries
This will give you the CPI from 1913 to the present.
a. With these values, calculate the current real minimum wage in 1990 dollars.
real minimum wage 2003 =
CP
I
1990
CPI
1998
*5.15=
130.7
163
*5.15= $4.13
.
b. What is the percentage change in the real minimum wage from 1985 to the
present, stated in real 1990 dollars?
Assume the minimum wage in 1985 was $3.35. Then,
real minimum wage 1985 =
CP
I
1990
CPI
1985
*3.35=
130.7
107.6
*3.35= $4.07
.
The percentage change in the real minimum wage is therefore
4.13 − 4.07
4.07
= 0.0147, or about 1.5%.
6
Chapter 2: The Basics of Supply and Demand
5
CHAPTER 2
THE BASICS OF SUPPLY AND DEMAND
EXERCISES
1. Suppose the demand curve for a product is given by Q=300-2P+4I, where I is average
income measured in thousands of dollars. The supply curve is Q=3P-50.
a. If I=25, find the market clearing price and quantity for the product.
Given I=25, the demand curve becomes Q=300-2P+4*25, or Q=400-2P. Setting
demand equal to supply we can solve for P and then Q:
400-2P=3P-50
P=90
Q=220.
b. If I=50, find the market clearing price and quantity for the product.
Given I=50, the demand curve becomes Q=300-2P+4*50, or Q=500-2P. Setting
demand equal to supply we can solve for P and then Q:
500-2P=3P-50
P=110
Q=280.
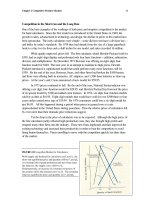
c. Draw a graph to illustrate your answers.
Equilibrium price and quantity are found at the intersection of the demand and
supply curves. When the income level increases in part b, the demand curve will
shift up and to the right. The intersection of the new demand curve and the supply
curve is the new equilibrium point.
2. Consider a competitive market for which the quantities demanded and supplied (per
year) at various prices are given as follows:
Price
($)
Demand
(millions)
Supply
(millions)
60 22 14
80 20 16
100 18 18
120 16 20
a. Calculate the price elasticity of demand when the price is $80 and when the price is
$100.
We know that the price elasticity of demand may be calculated using equation 2.1
from the text:
Chapter 2: The Basics of Supply and Demand
E
Q
Q
P
P
P
Q
Q
P
D
D
D
D
D
==
Δ
Δ
Δ
Δ
.
With each price increase of $20, the quantity demanded decreases by 2.
Therefore,
Δ
Q
D
ΔP
⎛
⎝
⎞
⎠
=
−
2
20
=−0.1.
At P = 80, quantity demanded equals 20 and
E
D
=
80
20
⎛
⎝
⎞
⎠
−0.1
()=−0.40.
Similarly, at P = 100, quantity demanded equals 18 and
E
D
=
100
18
⎛
⎝
⎞
⎠
−0.1
()=−0.56.
b. Calculate the price elasticity of supply when the price is $80 and when the price is
$100.
The elasticity of supply is given by:
E
Q
Q
P
P
P
Q
Q
P
S
S
S
S
S
==
Δ
Δ
Δ
Δ
.
With each price increase of $20, quantity supplied increases by 2. Therefore,
Δ
Q
S
ΔP
⎛
⎝
⎞
⎠
=
2
20
= 0.1.
At P = 80, quantity supplied equals 16 and
E
S
=
80
16
⎛
⎝
⎞
⎠
0.1
()= 0.5.
Similarly, at P = 100, quantity supplied equals 18 and
E
S
=
100
18
⎛
⎝
⎞
⎠
0.1
()= 0.56.
c. What are the equilibrium price and quantity?
The equilibrium price and quantity are found where the quantity supplied equals the
quantity demanded at the same price. As we see from the table, the equilibrium
price is $100 and the equilibrium quantity is 18 million.
d. Suppose the government sets a price ceiling of $80. Will there be a shortage, and if
so, how large will it be?
With a price ceiling of $80, consumers would like to buy 20 million, but producers
will supply only 16 million. This will result in a shortage of 4 million.
6
Chapter 2: The Basics of Supply and Demand
3. Refer to Example 2.5 on the market for wheat. At the end of 1998, both Brazil and
Indonesia opened their wheat markets to U.S. farmers. Suppose that these new markets add
200 million bushels to U.S. wheat demand. What will be the free market price of wheat and
what quantity will be produced and sold by U.S. farmers in this case?
The following equations describe the market for wheat in 1998:
Q
S
= 1944 + 207P
and
Q
D
= 3244 - 283P.
If Brazil and Indonesia add an additional 200 million bushels of wheat to U.S.
wheat demand, the new demand curve would be equal to Q
D
+ 200, or
Q
D
= (3244 - 283P) + 200 = 3444 - 283P.
Equating supply and the new demand, we may determine the new equilibrium price,
1944 + 207P = 3444 - 283P, or
490P = 1500, or P* = $3.06122 per bushel.
To find the equilibrium quantity, substitute the price into either the supply or
demand equation, e.g.,
Q
S
= 1944 + (207)(3.06122) = 2,577.67
and
Q
D
= 3444 - (283)(3.06122) = 2,577.67
4. A vegetable fiber is traded in a competitive world market, and the world price is $9 per
pound. Unlimited quantities are available for import into the United States at this price.
The U.S. domestic supply and demand for various price levels are shown below.
Price U.S. Supply U.S. Demand
(million lbs.) (million lbs.)
3 2 34
6 4 28
9 6 22
12 8 16
15 10 10
18 12 4
a. What is the equation for demand? What is the equation for supply?
The equation for demand is of the form Q=a-bP. First find the slope, which is
ΔQ
Δ
P
=
−6
3
=−2 =−b.
You can figure this out by noticing that every time price
increases by 3, quantity demanded falls by 6 million pounds. Demand is now
Q=a-2P. To find a, plug in any of the price quantity demanded points from the table:
Q=34=a-2*3 so that a=40 and demand is Q=40-2P.
7
Chapter 2: The Basics of Supply and Demand
The equation for supply is of the form Q = c + dP. First find the slope, which is
ΔQ
Δ
P
=
2
3
= d.
You can figure this out by noticing that every time price increases
by 3, quantity supplied increases by 2 million pounds. Supply is now
Q = c +
2
3
P.
To find c plug in any of the price quantity supplied points from the
table:
Q = 2 = c +
2
3
(3)
so that c=0 and supply is
Q =
2
3
P.
b. At a price of $9, what is the price elasticity of demand? What is it at price of $12?
Elasticity of demand at P=9 is
P
Q
Δ
Q
ΔP
=
9
22
(−2) =
−
18
22
=−0.82.
Elasticity of demand at P=12 is
P
Q
Δ
Q
ΔP
=
12
16
(−2) =
−
24
16
=−1.5.
c. What is the price elasticity of supply at $9? At $12?
Elasticity of supply at P=9 is
P
Q
Δ
Q
ΔP
=
9
6
2
3
⎛
⎝
⎞
⎠
=
18
18
=1.0.
Elasticity of supply at P=12 is
P
Q
Δ
Q
ΔP
=
12
8
2
3
⎛
⎝
⎞
⎠
=
24
24
= 1.0.
d. In a free market, what will be the U.S. price and level of fiber imports?
With no restrictions on trade, world price will be the price in the United States, so
that P=$9. At this price, the domestic supply is 6 million lbs., while the domestic
demand is 22 million lbs. Imports make up the difference and are 16 million lbs.
5. Much of the demand for U.S. agricultural output has come from other countries. In
1998, the total demand for wheat was Q = 3244 - 283P. Of this, domestic demand was Q
D
=
1700 - 107P. Domestic supply was Q
S
= 1944 + 207P. Suppose the export demand for
wheat falls by 40 percent.
a. U.S. farmers are concerned about this drop in export demand. What happens to the
free market price of wheat in the United States? Do the farmers have much reason
to worry?
Given total demand, Q = 3244 - 283P, and domestic demand, Q
d
= 1700 - 107P, we
may subtract and determine export demand, Q
e
= 1544 - 176P.
The initial market equilibrium price is found by setting total demand equal to
supply:
3244 - 283P = 1944 + 207P, or
P = $2.65.
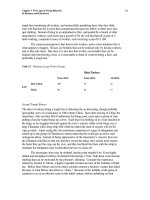
The best way to handle the 40 percent drop in export demand is to assume that the
export demand curve pivots down and to the left around the vertical intercept so that
at all prices demand decreases by 40 percent, and the reservation price (the
maximum price that the foreign country is willing to pay) does not change. If you
8
Chapter 2: The Basics of Supply and Demand
instead shifted the demand curve down to the left in a parallel fashion the effect on
price and quantity will be qualitatively the same, but will differ quantitatively.
The new export demand is 0.6Q
e
=0.6(1544-176P)=926.4-105.6P. Graphically,
export demand has pivoted inwards as illustrated in figure 2.5a below.
Total demand becomes
Q
D
= Q
d
+ 0.6Q
e
= 1700 - 107P + 926.4-105.6P = 2626.4 - 212.6P.
Q
e
1544
926.4
8.77
P
Figure 2.5a
Equating total supply and total demand,
1944 + 207
P = 2626.4 - 212.6P, or
P = $1.63,
which is a significant drop from the market-clearing price of $2.65 per bushel. At
this price, the market-clearing quantity is 2280.65 million bushels. Total revenue
has decreased from $6614.6 million to $3709.0 million. Most farmers would
worry.
b. Now suppose the U.S. government wants to buy enough wheat each year to raise the
price to $3.50 per bushel. With this drop in export demand, how much wheat would
the government have to buy? How much would this cost the government?
With a price of $3.50, the market is not in equilibrium. Quantity demanded and
supplied are
Q
D
= 2626.4-212.6(3.5)=1882.3, and
Q
S
= 1944 + 207(3.5) = 2668.5.
Excess supply is therefore 2668.5-1882.3=786.2 million bushels. The government
must purchase this amount to support a price of $3.5, and will spend
$3.5(786.2 million) = $2751.7 million per year.
6. The rent control agency of New York City has found that aggregate demand is
9
Chapter 2: The Basics of Supply and Demand
10
Q
D
= 160 - 8P. Quantity is measured in tens of thousands of apartments. Price, the
average monthly rental rate, is measured in hundreds of dollars. The agency also noted that
the increase in Q at lower P results from more three-person families coming into the city
from Long Island and demanding apartments. The city’s board of realtors acknowledges
that this is a good demand estimate and has shown that supply is Q
S
= 70 + 7P.
a. If both the agency and the board are right about demand and supply, what is the free
market price? What is the change in city population if the agency sets a maximum
average monthly rental of $300, and all those who cannot find an apartment leave the
city?
To find the free market price for apartments, set supply equal to demand:
160 - 8
P = 70 + 7P, or P = $600,
since price is measured in hundreds of dollars. Substituting the equilibrium price
into either the demand or supply equation to determine the equilibrium quantity:
Q
D
= 160 - (8)(6) = 112
and
Q
S
= 70 + (7)(6) = 112.
We find that at the rental rate of $600, the quantity of apartments rented is
1,120,000. If the rent control agency sets the rental rate at $300, the quantity
supplied would then be 910,000 (
Q
S
= 70 + (7)(3) = 91), a decrease of 210,000
apartments from the free market equilibrium. (Assuming three people per family
per apartment, this would imply a loss of 630,000 people.) At the $300 rental rate,
the demand for apartments is 1,360,000 units, and the resulting shortage is 450,000
units (1,360,000-910,000). However, excess demand (supply shortages) and lower
quantity demanded are not the same concepts. The supply shortage means that the
market cannot accommodate the new people who would have been willing to move
into the city at the new lower price. Therefore, the city population will only fall by
630,000, which is represented by the drop in the number of actual apartments from
1,120,000 (the old equilibrium value) to 910,000, or 210,000 apartments with 3
people each.
b. Suppose the agency bows to the wishes of the board and sets a rental of $900 per
month on all apartments to allow landlords a “fair” rate of return. If 50 percent of
any long-run increases in apartment offerings come from new construction, how
many apartments are constructed?
At a rental rate of $900, the supply of apartments would be 70 + 7(9) = 133, or
1,330,000 units, which is an increase of 210,000 units over the free market
equilibrium. Therefore, (0.5)(210,000) = 105,000 units would be constructed.
Note, however, that since demand is only 880,000 units, 450,000 units would go
unrented.
7. In 1998, Americans smoked 470 billion cigarettes, or 23.5 billion packs of cigarettes.
The average retail price was $2 per pack. Statistical studies have shown that the price
elasticity of demand is -0.4, and the price elasticity of supply is 0.5. Using this information,
derive linear demand and supply curves for the cigarette market.
Chapter 2: The Basics of Supply and Demand
Let the demand curve be of the general form Q=a-bP and the supply curve be of the
general form Q=c + dP, where a, b, c, and d are the constants that you have to find
from the information given above. To begin, recall the formula for the price
elasticity of demand
E
P
D
=
P
Q
Δ
Q
ΔP
.
You are given information about the value of the elasticity, P, and Q, which means
that you can solve for the slope, which is b in the above formula for the demand
curve.
−0.4 =
2
23.5
Δ
Q
ΔP
ΔQ
ΔP
=−0.4
23.5
2
⎛
⎝
⎞
⎠
=−4.7 =−b.
To find the constant a, substitute for Q, P, and b into the above formula so that
23.5=a-4.7*2 and a=32.9. The equation for demand is therefore Q=32.9-4.7P.
To find the supply curve, recall the formula for the elasticity of supply and follow
the same method as above:
E
P
S
=
P
Q
Δ
Q
ΔP
0.5 =
2
23.5
ΔQ
ΔP
ΔQ
ΔP
= 0.5
23.5
2
⎛
⎝
⎞
⎠
= 5.875 = d.
To find the constant c, substitute for Q, P, and d into the above formula so that
23.5=c+5.875*2 and c=11.75. The equation for supply is therefore
Q=11.75+5.875P.
8. In Example 2.8 we examined the effect of a 20 percent decline in copper demand on the
price of copper, using the linear supply and demand curves developed in Section 2.4. Suppose
the long-run price elasticity of copper demand were -0.4 instead of -0.8.
a. Assuming, as before, that the equilibrium price and quantity are P* = 75 cents per
pound and Q* = 7.5 million metric tons per year, derive the linear demand curve
consistent with the smaller elasticity.
Following the method outlined in Section 2.6, we solve for
a and b in the demand
equation
Q
D
= a - bP. First, we know that for a linear demand function
E
D
=−b
P*
Q*
⎛
⎝
⎜
⎞
⎠
⎟
. Here E
D
= -0.4 (the long-run price elasticity), P* = 0.75 (the
equilibrium price), and Q* = 7.5 (the equilibrium quantity). Solving for b,
−0.4 =−b
0.75
7.5
⎛
⎝
⎞
⎠
, or b = 4.
To find the intercept, we substitute for b, Q
D
(= Q*), and P (= P*) in the demand
equation:
11
Chapter 2: The Basics of Supply and Demand
7.5 = a - (4)(0.75), or a = 10.5.
The linear demand equation consistent with a long-run price elasticity of -0.4 is
therefore
Q
D
= 10.5 - 4P.
b. Using this demand curve, recalculate the effect of a 20 percent decline in copper
demand on the price of copper.
The new demand is 20 percent below the original (using our convention that
quantity demanded is reduced by 20% at every price):
′
Q
D
=
0.8
(
)
10.5
−
4P
(
)
=
8.4
−
3.2P
.
Equating this to supply,
8.4 - 3.2P = -4.5 + 16P, or
P = 0.672.
With the 20 percent decline in the demand, the price of copper falls to 67.2 cents per
pound.
9. Example 2.9 analyzes the world oil market. Using the data given in that example:
a. Show that the short-run demand and competitive supply curves are indeed given by
D = 24.08 - 0.06P
S
C
= 11.74 + 0.07P.
First, considering non-OPEC supply:
S
c
= Q* = 13.
With E
S
= 0.10 and P* = $18, E
S
= d(P*/Q*) implies d = 0.07.
Substituting for d, S
c
, and P in the supply equation, c = 11.74 and S
c
= 11.74 + 0.07P.
Similarly, since Q
D
= 23, E
D
= -b(P*/Q*) = -0.05, and b = 0.06. Substituting for b, Q
D
=
23, and P = 18 in the demand equation gives 23 = a - 0.06(18), so that a = 24.08.
Hence Q
D
= 24.08 - 0.06P.
b. Show that the long-run demand and competitive supply curves are indeed given by
D = 32.18 - 0.51P
S
C
= 7.78 + 0.29P.
As above, E
S
= 0.4 and E
D
= -0.4: E
S
= d(P*/Q*) and E
D
= -b(P*/Q*), implying 0.4 =
d(18/13) and -0.4 = -b(18/23). So d = 0.29 and b = 0.51.
Next solve for c and a:
S
c
= c + dP and Q
D
= a - bP, implying 13 = c + (0.29)(18) and 23 = a - (0.51)(18).
So c = 7.78 and a = 32.18.
c. In 2002, Saudi Arabia accounted for 3 billion barrels per year of OPEC’s production.
Suppose that war or revolution caused Saudi Arabia to stop producing oil. Use the
12
Chapter 2: The Basics of Supply and Demand
model above to calculate what would happen to the price of oil in the short run and
the long run if OPEC’s production were to drop by 3 billion barrels per year.
With OPEC’s supply reduced from 10 bb/yr to 7 bb/yr, add this lower supply of 7 bb/yr to
the short-run and long-run supply equations:
S
c
′
= 7 + S
c
= 11.74 + 7 + 0.07P = 18.74 + 0.07P and S
″
= 7 + S
c
= 14.78 + 0.29P.
These are equated with short-run and long-run demand, so that:
18.74 + 0.07P = 24.08 - 0.06P,
implying that P = $41.08 in the short run; and
14.78 + 0.29P = 32.18 - 0.51P,
implying that P = $21.75 in the long run.
10. Refer to Example 2.10, which analyzes the effects of price controls on natural gas.
a. Using the data in the example, show that the following supply and demand curves did
indeed describe the market in 1975:
Supply: Q = 14 + 2P
G
+ 0.25P
O
Demand: Q = -5P
G
+ 3.75P
O
where P
G
and P
O
are the prices of natural gas and oil, respectively. Also, verify that
if the price of oil is $8.00, these curves imply a free market price of $2.00 for natural
gas.
To solve this problem, we apply the analysis of Section 2.6 to the definition of
cross-price elasticity of demand given in Section 2.4. For example, the cross-
price-elasticity of demand for natural gas with respect to the price of oil is:
E
GO
=
ΔQ
G
ΔP
O
⎛
⎝
⎜
⎞
⎠
⎟
P
O
Q
G
⎛
⎝
⎜
⎞
⎠
⎟
.
ΔQ
G
ΔP
O
⎛
⎝
⎜
⎞
⎠
⎟
is the change in the quantity of natural gas demanded, because of a small
change in the price of oil. For linear demand equations,
ΔQ
G
ΔP
O
⎛
⎝
⎜
⎞
⎠
⎟
is constant. If
we represent demand as:
Q
G
= a - bP
G
+ eP
O
(notice that income is held constant), then
ΔQ
G
ΔP
O
⎛
⎝
⎜
⎞
⎠
⎟
= e. Substituting this into the
cross-price elasticity,
E
PO
= e
P
O
*
Q
G
*
⎛
⎝
⎜
⎞
⎠
⎟
, where and
Q
are the equilibrium price
and quantity. We know that = $8 and
Q
= 20 trillion cubic feet (Tcf).
Solving for e,
P
O
*
G
*
P
O
*
G
*
13
Chapter 2: The Basics of Supply and Demand
1.5 = e
8
20
⎛
⎝
⎞
⎠
, or e = 3.75.
Similarly, if the general form of the supply equation is represented as:
Q
G
= c + dP
G
+ gP
O
,
the cross-price elasticity of supply is
g
P
O
*
Q
G
*
⎛
⎝
⎜
⎞
⎠
⎟
, which we know to be 0.1. Solving
for g,
0.1 = g
8
20
⎛
⎝
⎞
⎠
, or g = 0.25.
The values for d and b may be found with equations 2.5a and 2.5b in Section 2.6.
We know that E
S
= 0.2, P* = 2, and Q* = 20. Therefore,
0.2 = d
2
20
⎛
⎝
⎞
⎠
, or d = 2.
Also, E
D
= -0.5, so
−0.5 = b
2
20
⎛
⎝
⎞
⎠
, or b = -5.
By substituting these values for d, g, b, and e into our linear supply and demand
equations, we may solve for c and a:
20 = c + (2)(2) + (0.25)(8), or c = 14,
and
20 = a - (5)(2) + (3.75)(8), or a = 0.
If the price of oil is $8.00, these curves imply a free market price of $2.00 for
natural gas. Substitute the price of oil in the supply and demand curves to verify
these equations. Then set the curves equal to each other and solve for the price of
gas.
14 + 2P
G
+ (0.25)(8) = -5P
G
+ (3.75)(8)
7P
G
= 14
P
G
= $2.00.
b. Suppose the regulated price of gas in 1975 had been $1.50 per thousand cubic feet,
instead of $1.00. How much excess demand would there have been?
With a regulated price of $1.50 for natural gas and a price of oil equal to $8.00 per
barrel,
Demand: Q
D
= (-5)(1.50) + (3.75)(8) = 22.5, and
Supply: Q
S
= 14 + (2)(1.5) + (0.25)(8) = 19.
With a supply of 19 Tcf and a demand of 22.5 Tcf, there would be an excess
demand of 3.5 Tcf.
c. Suppose that the market for natural gas had not been regulated. If the price of oil
had increased from $8 to $16, what would have happened to the free market price of
natural gas?
14
Chapter 2: The Basics of Supply and Demand
If the price of natural gas had not been regulated and the price of oil had increased
from $8 to $16, then
Demand: Q
D
= -5P
G
+ (3.75)(16) = 60 - 5P
G
, and
Supply: Q
S
= 14 + 2P
G
+ (0.25)(16) = 18 + 2P
G
.
Equating supply and demand and solving for the equilibrium price,
18 + 2P
G
= 60 - 5P
G
, or P
G
= $6.
The price of natural gas would have tripled from $2 to $6.
11. The table below shows the retail price and sales for instant coffee and roasted coffee for
1997 and 1998.
Retail Price of Sales of Retail Price of Sales of
Instant Coffee Instant Coffee Roasted Coffee Roasted Coffee
Year ($/lb) (million lbs) ($/lb) (million lbs)
1997 10.35 75 4.11 820
1998 10.48 70 3.76 850
a. Using this data alone, estimate the short-run price elasticity of demand for roasted
coffee. Derive a linear demand curve for roasted coffee.
To find elasticity, you must first estimate the slope of the demand curve:
ΔQ
Δ
P
=
820
−
850
4.11
−
3.76
=−
30
0.35
=−85.7.
Given the slope, we can now estimate elasticity using the price and quantity data
from the above table. Since the demand curve is assumed to be linear, the
elasticity will differ in 1997 and 1998 because price and quantity are different.
You can calculate the elasticity at both points and at the average point between the
two years:
E
p
97
=
P
Q
ΔQ
ΔP
=
4.11
820
(−85.7) =−0.43
E
p
98
=
P
Q
ΔQ
ΔP
=
3.76
850
(−85.7) =−0.38
E
p
AVE
=
P
97
+ P
98
2
Q
97
+ Q
98
2
ΔQ
ΔP
=
3.935
835
(−85.7) =−0.40.
To derive the demand curve for roasted coffee Q=a-bP, note that the slope of the
demand curve is -85.7=-b. To find the coefficient a, use either of the data points
from the table above so that a=830+85.7*4.11=1172.3 or a=850+85.7*3.76=1172.3.
The equation for the demand curve is therefore
Q=1172.3-85.7P.
15
Chapter 2: The Basics of Supply and Demand
b. Now estimate the short-run price elasticity of demand for instant coffee. Derive a
linear demand curve for instant coffee.
To find elasticity, you must first estimate the slope of the demand curve:
ΔQ
Δ
P
=
75
−
70
10.35
−
10.48
=−
5
0.13
=−38.5.
Given the slope, we can now estimate elasticity using the price and quantity data
from the above table. Since the demand curve Q=a-bP is assumed to be linear, the
elasticity will differ in 1997 and 1998 because price and quantity are different.
You can calculate the elasticity at both points and at the average point between the
two years:
E
p
97
=
P
Q
Δ
Q
ΔP
=
10.35
75
(−38.5) =−5.31
E
p
98
=
P
Q
Δ
Q
ΔP
=
10.48
70
(−38.5) =−5.76
E
p
AVE
=
P
97
+
P
98
2
Q
97
+ Q
98
2
ΔQ
ΔP
=
10.415
72.5
(−38.5) =−5.53.
To derive the demand curve for instant coffee, note that the slope of the demand
curve is -38.5=-b. To find the coefficient a, use either of the data points from the
table above so that a=75+38.5*10.35=473.5 or a=70+38.5*10.48=473.5. The
equation for the demand curve is therefore
Q=473.5-38.5P.
c. Which coffee has the higher short-run price elasticity of demand? Why do you
think this is the case?
Instant coffee is significantly more elastic than roasted coffee. In fact, the demand
for roasted coffee is inelastic and the demand for instant coffee is elastic. Roasted
coffee may have an inelastic demand in the short-run as many people think of
coffee as a necessary good. Changes in the price of roasted coffee will not
drastically affect demand because people must have this good. Many people, on
the other hand, may view instant coffee, as a convenient, though imperfect,
substitute for roasted coffee. For example, if the price rises a little, the quantity
demanded will fall by a large percentage because people would rather drink roasted
coffee instead of paying more for a low quality substitute.
16
Chapter 3: Consumer Behavior
PART II
PRODUCERS, CONSUMERS, AND COMPETITIVE MARKETS
CHAPTER 3
CONSUMER BEHAVIOR
EXERCISES
1. In this chapter, consumer preferences for various commodities did not change during the
analysis. Yet in some situations, preferences do change as consumption occurs. Discuss
why and how preferences might change over time with consumption of these two
commodities:
a. cigarettes
The assumption that preferences do not change is a reasonable one if choices are
independent across time. It does not hold, however, when “habit-forming” or
addictive behavior is involved, as in the case of cigarettes: the consumption of
cigarettes in one period influences their consumption in the next period.
b. dinner for the first time at a restaurant with a special cuisine
This example is parallel to examples of adventure seeking. For some, a new
dining experience creates enthusiasm to seek out more exciting and different
cuisines and dishes. For others, they develop a fondness for regularity and
consistency or fear of the new and unknown. In either of these cases, choices
change as consumption occurs.
2. Draw indifference curves that represent the following individuals’ preferences for
hamburgers and soft drinks. Indicate the direction in which the individuals’ satisfaction
(or utility) is increasing.
a. Joe has convex preferences and dislikes both hamburgers and soft drinks.
Since Joe dislikes both goods, his set of indifference curves will be bowed
inwards towards the origin instead of outwards, as in the normal case where more
is preferred to less. Given he dislikes both goods, his satisfaction is increasing
in the direction of the origin. Convexity of preferences implies his indifference
curves will have the normal shape in that they are bowed towards the direction of
increasing satisfaction. Convexity also implies that given any two bundles
between which the consumer is indifferent, the “average” of the two bundles will
be in the preferred set, or will leave him at least as well off.
hamb urg er
soft dr ink
23
Chapter 3: Consumer Behavior
b. Jane loves hamburgers and dislikes soft drinks. If she is served a soft drink, she
will pour it down the drain rather than drink it.
Since Jane can freely dispose of the soft drink if it is given to her, she considers it
to be a neutral good. This means she does not care about soft drinks one way or
the other. With hamburgers on the vertical axis, her indifference curves are
horizontal lines. Her satisfaction increases in the upward direction.
hamb urg er
soft dr ink
c. Bob loves hamburgers and dislikes soft drinks. If he is served a soft drink, he will
drink it to be polite.
Since Bob will drink the soft drink in order to be polite, it can be thought of as a
“bad”. When served another soft drink, he will require more hamburgers at the
same time in order to keep his satisfaction constant. More soft drinks without
more hamburgers will worsen his utility. More hamburgers and fewer soft
drinks will increase his utility.
hamb urg er
soft dr ink
d. Molly loves hamburgers and soft drinks, but insists on consuming exactly one soft
drink for every two hamburgers that she eats.
Molly wants to consume the two goods in a fixed proportion so her indifference
curves are L-shaped. For any given amount of one good, she gets no extra
satisfaction from having more of the other good. She will only increase her
satisfaction if she has more of both goods.
24
Chapter 3: Consumer Behavior
hamb urg er
soft dr ink
e. Bill likes hamburgers, but neither likes nor dislikes soft drinks.
Like Jane, Bill considers soft drinks to be a neutral good. Since he does not care
about soft drinks one way or the other we can assume that no matter how many he
has, his utility will be the same. His level of satisfaction depends entirely on
how many hamburgers he has.
hamb urg er
soft dr ink
f. Mary always gets twice as much satisfaction from an extra hamburger as she does
from an extra soft drink.
How much extra satisfaction Mary gains from an extra hamburger or soft drink
tells us something about the marginal utilities of the two goods, or about her
MRS. If she always receives twice the satisfaction from an extra hamburger then
her marginal utility from consuming an extra hamburger is twice her marginal
utility from consuming an extra soft drink. Her MRS, with hamburgers on the
vertical axis, is 1/2. Her indifference curves are straight lines with a slope of
1/2.
hamb urg er
soft dr ink
25
Chapter 3: Consumer Behavior
3. If Jane is currently willing to trade 4 movie tickets for 1 basketball ticket then she must
like basketball better than movies. True or false? Explain.
This statement is not necessarily true. If she is always willing to trade 4 movie
tickets for 1 basketball ticket then yes she likes basketball better because she will
always gain the same satisfaction from 4 movie tickets as she does from 1
basketball ticket. However, it could be that she has convex preferences
(diminishing marginal rate of substitution) and is at a bundle where she has a lot
of movie tickets relative to basketball tickets. This would make her willing to
give up more movie tickets to get another basketball ticket. It would not mean
though that she liked basketball better. Her willingness to give up a good would
in this case depend on the quantity of each good in her current basket.
4. Janelle and Brian each plan to spend $20,000 on the styling and gas mileage features of
a new car. They can each choose all styling, all gas mileage, or some combination of the
two. Janelle does not care at all about styling and wants the best gas mileage possible.
Brian likes both equally and wants to spend an equal amount on the two features. Using
indifference curves and budget lines, illustrate the choice that each person will make.
Assume styling is on the vertical axis and gas mileage is on the horizontal axis.
Janelle has indifference curves that are vertical. If the styling is there she will
take it, but she otherwise does not care about it. As her indifference curves
move over to the right, she gains more gas mileage and more satisfaction. She
will spend all $20,000 on gas mileage. Brian has indifference curves that are L-
shaped. He will not spend more on one feature than on the other feature. He
will spend $10,000 on styling and $10,000 on gas mileage.
5. Suppose that Bridget and Erin spend their income on two goods, food (F) and clothing
(C). Bridget’s preferences are represented by the utility function
U
(
F
,C)=10
FC
, while
Erin’s preferences are represented by the utility function
U(F,C)
=
.20F
2
C
2
.
a. On a graph, with food on the horizontal axis and clothing on the vertical axis,
identify the set of points that give Bridget the same level of utility as the bundle
(10,5). Do the same for Erin on a separate graph.
Bridget receives a utility of 10*10*5=500 from this bundle. The indifference
curve is represented by the equation 10FC=500 or FC=50. Some bundles on this
indifference curve are (5,10), (10,5), (25,2), and (2,25). Erin receives a utility of
.2*10*10*5*5=500 from the bundle (10,5). Her indifference curve is
represented by the equation
500
=
.2
F
2
C
2
, or 50=FC. This is the same
indifference curve as Bridget. Both indifference curves have the normal, convex
shape.
b. On the same two graphs, identify the set of bundles that give Bridget and Erin the
same level of utility as the bundle (15,8).
For each person, plug in F=15 and C=8 into their respective utility functions.
For Bridget, this gives her a utility of 1200, so her indifference curve is given by
26
Chapter 3: Consumer Behavior
27
2880=.2
the equation 10FC=1200, or FC=120. Some bundles on this indifference curve
are (12,10), (10,12), (3,40), and (40,3). For Erin, this bundle gives her a utility
of 2880, so her indifference curve is given by the equation
F
2
C
2
P
D
, or
FC=120. This is the same indifference curve as Bridget.
c. Do you think Bridget and Erin have the same preferences or different preferences?
Explain.
They have the same preferences because for any given bundle they have the same
level of utility. This means that they will rank all bundles in the same order.
Note however, that it is not necessary that they receive the same level of utility to
have the same set of preferences. All that is necessary is that they rank the
bundles in the same order.
6. Suppose that Jones and Smith have each decided to allocate $1,000 per year to an
entertainment budget in the form of hockey games or rock concerts. They both like hockey
games and rock concerts and will choose to consume positive quantities of both goods.
However, they differ substantially in their preferences for these two forms of entertainment.
Jones prefers hockey games to rock concerts, while Smith prefers rock concerts to hockey
games.
a. Draw a set of indifference curves for Jones and a second set for Smith.
Given they each like both goods and they will each choose to consume positive
quantities of both goods, we can assume their indifference curves have the normal
convex shape. However since Jones has an overall preference for hockey and
Smith has an overall preference for rock concerts, their two sets of indifference
curves will have different slopes. Suppose that we place rock concerts on the
vertical axis and hockey games on the horizontal axis, Jones will have a larger
MRS than Smith. Jones is willing to give up more rock concerts in exchange for
a hockey game since he prefers hockey games. The indifference curves for
Jones will be steeper.
b. Using the concept of marginal rate of substitution, explain why the two sets of curves
are different from each other.
At any combination of hockey games and rock concerts, Jones is willing to give up
more rock concerts for an additional hockey game, whereas, Smith is willing to give
up fewer rock concerts for an additional hockey game. Since the MRS is a
measure of how many of one good (rock concerts) an individual is willing to give
up for an additional unit of the other good (hockey games), then the MRS, and
hence the slope of the indifference curves, will be different for the two individuals.
7. The price of DVDs (D) is $20 and the price of CDs (C) is $10. Philip has a budget of
$100 to spend on the two goods. Suppose that he has already bought one DVD and one
CD. In addition there are 3 more DVDs and 5 more CDs that he would really like to buy.
a. Given the above prices and income, draw his budget line on a graph with CDs on
the horizontal axis.
His budget line is
D
+ P C
=
C
I
, or 20D+10C=100. If he spends his entire
income on DVD’s he could afford to buy 5. If he spends his entire income on
CD’s he could afford to buy 10.
Chapter 3: Consumer Behavior
b. Considering what he has already purchased, and what he still wants to purchase,
identify the three different bundles of CDs and DVDs that he could choose.
Assume that he cannot purchase fractional units for this part of the question.
Given he has already purchased one of each, for a total of $30, he has $70 left.
Since he wants 3 more DVD’s he can buy these for $60 and spend his remaining
$10 on 1 CD. This is the first bundle below. He could also choose to buy only
2 DVD’s for $40 and spend the remaining $30 on 3 CD’s. He can choose the
following bundles:
Purchased Quantities Total Quantities
D C D C
3 1 2 6
2 3 3 4
1 5 4 2
8. Anne has a job that requires her to travel three out of every four weeks. She has an
annual travel budget and can either travel by train or by plane. The airline she typically
flies with has a frequent traveler program that reduces the cost of her tickets depending on
the number of miles she has flown in a given year. When she reaches 25,000 miles the
airline will reduce the price of her tickets by 25% for the remainder of the year. When
she reached 50,000 miles, the airline will reduce the price of her tickets by 50% for the
remainder of the year. Graph Anne’s budget line, with train miles on the vertical axis
and plane miles on the horizontal axis.
The typical budget line is linear (with a constant slope) because the prices of the
two goods do not change as the consumer buys more or less of a particular good.
In this case, the price of airline miles will change depending on how many miles
she purchases. As the price changes, the slope of the budget line will change.
Since there are three prices, there will be three slopes, or two kinks, to the budget
line. Since the price falls as she flies more miles, the budget line will become
flatter with every price change. See the graph in the problem below.
9. Debra usually buys a soft drink when she goes to a movie theater, where she has a
choice of three sizes: the 8 ounce drink costs $1.50, the 12 ounce drink, $2.00, and the 16
ounce drink, $2.25. Describe the budget constraint that Debra faces when deciding how
many ounces of the drink to purchase. (Assume that Debra can costlessly dispose of any
of the soft drink that she does not want.
First notice that as the size of the drink increases, the price per ounce decreases.
When she buys the 8-ounce soft drink she pays
$1.50
8 oz
= $0.19 per oz.
When
she buys the 12-ounce size she pays $0.17 per ounce, and when she buys the 16-
ounce size, she pays $0.14 per ounce. Given that there are three different prices
per ounce of soft drink, the budget line will have two kinks in it, as illustrated
below. Notice that at each kink, the slope of the budget line gets flatter (due to
the decreasing cost per ounce relative to the “other good” on the vertical axis).
28
Chapter 3: Consumer Behavior
Ounces of
Soft Drink
812 16
10. Antonio buys 5 new college textbooks during his first year at school at a cost of $80
each. Used books cost only $50 each. When the bookstore announces that there will be a
10% increase in the price of new books and a 5% increase in the price of used books,
Antonio’s father offers him $40 extra.
a. What happens to Antonio’s budget line? Illustrate the change with new books on
the vertical axis.
In the first year he spends $80 each on 5 new books for a total of $400. For the
same amount of money he could have bought 8 used textbooks. His budget line
is therefore 80*New+50*Used=400. After the price change, new books cost
$88, used books cost $52.5, and he has an income of $440. If he spends all of
his income on new books, he can still afford to buy 5 new books, but can now
afford to buy 8.4 used books if he buys only used books. The new budget line is
88*New+52.5*Used=440. The budget line has changed its slope and become
flatter if we place used books on the horizontal axis.
b. Is Antonio worse or better off after the price change? Explain.
The first year he bought 5 books at a cost of $80 each for a total of $400. The
new price of books is $88 and the cost of 5 new books is now $440. The $40
extra income will cover the price increase. Antonio is definitely not worse off
since he can still afford the same number of new books. He may in fact be better
off if he decides to switch to used books.
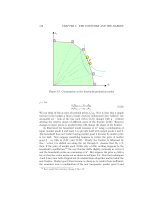
11. Consumers in Georgia pay twice as much for avocados as they do for peaches.
However, avocados and peaches are equally priced in California. If consumers in both
states maximize utility, will the marginal rate of substitution of peaches for avocados be the
same for consumers in both states? If not, which will be higher?
The marginal rate of substitution of peaches for avocados is the amount of avocados
that a person is willing to give up to obtain one additional peach. When
consumers maximize utility, they set their marginal rate of substitution equal to the
29