127 Drivers and Characteristics of Wastewater Agriculture in Developing pdf
Bạn đang xem bản rút gọn của tài liệu. Xem và tải ngay bản đầy đủ của tài liệu tại đây (779.51 KB, 39 trang )
Liqa Raschid-Sally and Priyantha Jayakody
IWMI is a Future Harvest Center
supported by the CGIAR
Drivers and Characteristics of
Wastewater Agriculture in
Developing Countries:
Results from a Global Assessment
127
RESEARCH
REPOR T
SM
IWMI is a Future Harvest Center
supported by the CGIAR
Postal Address
P O Box 2075
Colombo
Sri Lanka
Location
127, Sunil Mawatha
Pelawatta
Battaramulla
Sri Lanka
Telephone
+94-11-2880000
Fax
+94-11-2786854
E-mail
Website
I n t erna tiona l
Water Management
Institu t e
ISBN: 978-92-9090-698-8
ISSN: 1026-0862
I n t e rna tional
Water Management
Institu t e
Research Reports
IWMI’s mission is to improve the management of land and water resources for food,
livelihoods and environment. In serving this mission, IWMI concentrates on the
integration of policies, technologies and management systems to achieve workable
solutions to real problems—practical, relevant results in the field of irrigation and
water and land resources.
The publications in this series cover a wide range of subjects—from computer
modeling to experience with water user associations—and vary in content from
directly applicable research to more basic studies, on which applied work ultimately
depends. Some research reports are narrowly focused, analytical and detailed
empirical studies; others are wide-ranging and synthetic overviews of generic
problems.
Although most of the reports are published by IWMI staff and their collaborators,
we welcome contributions from others. Each report is reviewed internally by IWMI’s
own staff and Fellows, and by external reviewers. The reports are published and
distributed both in hard copy and electronically (www.iwmi.org) and where possible
all data and analyses will be available as separate downloadable files. Reports may
be copied freely and cited with due acknowledgment.
i
International Water Management Institute
P O Box 2075, Colombo, Sri Lanka
Research Report 127
Drivers and Characteristics of Wastewater
Agriculture in Developing Countries:
Results from a Global Assessment
Liqa Raschid-Sally and Priyantha Jayakody
The authors:
Liqa Raschid-Sally is a Senior Researcher at the West Africa office of the
International Water Management Institute (IWMI) in Accra, Ghana ();
and Priyantha Jayakody is a Research Officer at the International Water Management
Institute (IWMI) headquarters in Colombo, Sri Lanka ().
Acknowledgements:
The authors wish to thank Mr. Gez Cornish (ex-HR Wallingford), Mr.
Jean-Marc Faurès (FAO) and Drs. David Molden, Hugh Turral, and Pay Drechsel (all from
IWMI) for their contributions in formulating the research questions and designing the study.
Additional thanks are due to the internal and external reviewers for their extremely useful
inputs during review of the report. Thanks are also due to research assistants Ms. Evelyn
Dahlberg, Mr. James Juana and Ms. Anila Weerakkody, for assistance in conducting
literature reviews on various aspects of wastewater agriculture. Finally, the study could not
have been conducted without the technical assistance of the consultants who undertook
the surveys in the 53 cities selected for the study. The study was funded by the
Comprehensive Assessment of Water Management in Agriculture, a program of the
International Water Management Institute, Colombo, Sri Lanka, under a grant from the
Government of the Netherlands.
Raschid-Sally, L.; Jayakody, P. 2008.
Drivers and characteristics of wastewater agriculture
in developing countries: Results from a global assessment
. Colombo, Sri Lanka:
International Water Management Institute. 35p. (IWMI Research Report 127)
/ wastewater / water use / urban agriculture / wastewater irrigation / water supply / sanitation /
water demand / women / gender / irrigation methods / health hazards / developing countries /
ISSN 1026-0862
ISBN 978-92-9090-698-8
Copyright © 2008, by IWMI. All rights reserved.
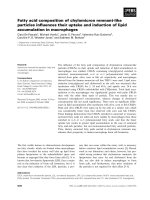
Cover photograph
shows a view of the Niger River flowing through Bamako, the capital city
of Mali. The water is polluted from urban wastewater discharges and is used for urban
agriculture on its banks.
Please send inquiries and comments to:
IWMI receives its principal funding from 58 governments, private foundations, and
international and regional organizations known as the Consultative Group on International
Agricultural Research (CGIAR). Support is also given by the Governments of Ghana,
Pakistan, South Africa, Sri Lanka and Thailand.
iii
iii
Contents
Acronyms and Abbreviations iv
Summary v
Background and Scope 1
Methodology and Selection Criteria 4
Results and Discussion 7
Conclusions 23
Recommendations for Implementation 26
References 27
iv
Acronyms and Abbreviations
AF Africa
AS Asia
FAO Food and Agriculture Organization of the United Nations
GDP Gross Domestic Product
GNI Gross National Income
LA Latin America
LDC Less developed countries
l/c/d liters per capita per day
ME Middle East
PPP Purchasing Power Parity
UPA Urban and Peri-urban Agriculture
WW Wastewater
WWA Wastewater Agriculture
v
diluted) in urban and peri-urban agriculture even if
areas cultivated in each of the cities may
sometimes be small. Across 53 cities we conclude
that just for these cities alone, approximately 0.4
million hectares (Mha) are cultivated with
wastewater by a farmer population of 1.1 million with
about 4.5 million family dependants. Compiling
information from various sources, the total number
of farmers irrigating worldwide with treated, partially
treated and untreated wastewater is estimated at
200 million; farming on at least 20 Mha. These
figures include areas where irrigation water is
heavily polluted.
Though the actual physical areas under
cultivation may be small, some vegetables are
grown up to 10 times a year on the same plot.
Data from a detailed city study in Accra showed
that about 200,000 urban dwellers benefit everyday
from vegetables grown on just 100 ha of land. Strict
irrigation water quality guidelines can hardly be
imposed where traditional irrigation water sources
are polluted, and thousands of farmers depend on
it, unless alternative sources of water are provided.
Farmers are aware of the potential risks to
themselves and to consumers but a clear
understanding of cause and effect are missing. The
fact that consumers in most cities habitually wash
vegetables supports the idea that where treatment
is still rudimentary, a feasible method of minimizing
health risks for consumers in the short term would
be to encourage effective washing of vegetables.
Some key policy recommendations are made:
1. Urban and peri-urban agriculture can enhance
food supplies to cities and is an effective source
of nutrition which can be improved at very little
marginal cost.
2. The WHO (2006) guidelines for the safe use of
wastewater should be extensively applied as it
allows for incremental and adaptive risk
Summary
In many cities of developing countries untreated
wastewater and polluted water are used for
agriculture in urban and peri-urban areas. Though
such practices are a threat to the health of users
and consumers, they do provide important livelihood
benefits and perishable food to cities. This paper
through a cross country analysis of 53 cities in the
developing world, contributes to an understanding of
the factors that drive wastewater use. The 53 cities
represent a range of settings in arid and humid
areas, in rich and poor countries, and coastal as
well as inland cities to provide a picture of
wastewater use globally. It relates the wastewater
collection and disposal practices to the increasing
impact of poor water quality on agriculture.
The study shows that the main drivers of
wastewater use in irrigated agriculture are in most
cases a combination of three factors:
• Increasing urban water demand and related
return flow of used but seldom treated
wastewater into the environment and its water
bodies, causing pollution of traditional irrigation
water sources.
• Urban food demand and market incentives
favoring food production in city proximity where
water sources are usually polluted.
• Lack of alternative (cheaper, similarly reliable or
safer) water sources.
The key underlying factor is in most cases
poverty which limits the “coping capacity” of cities
to respond to the infrastructure needs of
urbanization, e.g., with comprehensive wastewater
treatment.
However, the use of untreated wastewater is not
limited to the countries and cities with the lowest
GDP, and is prevalent in many mid-income
countries as well. In four out of every five cities
surveyed wastewater is used (treated, raw or
vi
reduction which is more realistic and cost-
effective than stressing the need to achieve
certain water quality values.
3. Implementation of the Millennium Development
Goals should more closely link policies and
investments for improvements in the water
supply sector with those in the sanitation and
waste disposal sector, to achieve maximum
impact.
4. In addressing health risks; on the one hand,
state authorities have a role to play in
planning, financing and maintaining sanitation
and waste disposal infrastructure that is
commensurate with their capacities and
responds to agricultural reuse requirements.
On the other hand, as comprehensive
wastewater treatment will remain unlikely in
the near future, outsourcing water quality
improvements and health risk reduction to the
user level and supporting such initiatives
through farm tenure security, economic
incentives like easy access to credit for safer
farming, and social marketing for improving
farmer knowledge and responsibility, can lead
more effectively to reduced public health risks
while maintaining the benefits of urban and
peri-urban agriculture.
5. Finally, countries must address the need to
develop policies and locally viable practices for
safer wastewater use to maintain its benefits for
food supply and livelihoods while reducing
health and environmental risks.
1
Drivers and Characteristics of Wastewater Agriculture
in Developing Countries: Results from a Global
Assessment
Liqa Raschid-Sally and Priyantha Jayakody
Background and Scope
Contrary to most developed countries where
wastewater is treated before reuse, in many
developing countries, wastewater is used for
agriculture both with and without treatment; in the
latter instance it may be in undiluted or diluted
form (Box 1). While wastewater treatment and
recycling for various purposes has been well
documented, the agricultural use of raw and
diluted wastewater has only recently been brought
to the foreground as a phenomenon that needs
attention (Scott et al. 2004; Qadir et al. 2007;
Keraita et al. 2008).
Box 1. Definitions
The term wastewater as used in this report can have different qualities from raw to diluted:
• Urban wastewater is usually a combination of one or more of the following:
Domestic effluent consisting of
blackwater
(excreta, urine and associated sludge) and
grey water
(kitchen and bathroom wastewater)
Water from commercial establishments and institutions, including hospitals
Industrial
effluent where present
Storm water
and other urban runoff
• Treated wastewater is wastewater that has been processed through a wastewater treatment
plant and been subjected to one or more physical, chemical, and biological processes to reduce
its pollution or health hazard.
• Reclaimed (waste)water or recycled water is treated wastewater that can officially be used under
controlled conditions for beneficial purposes such as irrigation.
• Use of wastewater:
Direct
use
of
untreated
urban wastewater
from a sewage outlet is when it is directly
disposed of on land where it is used for cultivation.
Indirect
use
of
untreated
urban wastewater: when water from a river receiving urban
wastewater is abstracted by farmers downstream of the urban center for agriculture. This
happens when cities do not have any comprehensive sewage collection network and
drainage systems are discharging collected wastewater into rivers
Direct use
of
treated
wastewater: When wastewater has undergone treatment before it is
used for agriculture or other irrigation or recycling purposes.
2
Concurrently, wastewater use is viewed both as a
benefit
providing livelihoods and perishable food to
cities, and as a
threat
affecting the health of users
and consumers of the said produce, and the
environment. The secondary benefits are said to be:
1. Better nutrition and education to farming
families and traders as the income generated
from this practice (which usually involves cash
crops) raises living standards;
2. Recycling of nutrients and, therefore, eventual
savings in fertilizer, which on the one hand is
a direct saving to the farmer and on the other
provides an environmental benefit; and
3. Agricultural wastewater application is seen as
a form of land treatment where other means
are not viable, thus providing some reduction of
surface water pollution.
The primary health risk is diarrheal disease for
consumers and farmers as well as skin and worm
infections for all those in contact with wastewater.
Other related concerns are (Hamilton et al. 2007):
1. accumulation of bio-available forms of heavy
metals and fate of organics in soil,
2. impact from extensive use on catchment
hydrology and salt transport,
3. microbiological contamination risks for surface
water and groundwater, and
4. transfer of chemical and biological
contaminants to crops.
Importance of Treated Wastewater Use
for Agriculture
Agriculture is the largest consumer of freshwater
resources currently accounting for about 70% of
global water diversions (but sometimes even up to
80-95% in developing countries) (Seckler et al.
1998). With increasing demand from municipal and
industrial sectors, competition for water will increase
and it is expected that water now used for agriculture
will be diverted to the urban and industrial sectors.
A number of examples from Asia, North Africa, and
Latin America, are witness to this fact (Molle and
Berkoff 2006). One observed response to this
squeeze on agricultural water supply is to promote
greater use of treated urban wastewater for irrigation.
Discounting the significance of this practice as a
partial solution to the freshwater squeeze in
agriculture, it is argued that the total volume of
treated
wastewater available (even if all of it is
treated), is insignificant in many countries in terms
of the overall freshwater balance and the volumes
that will need to be transferred from agriculture to
municipal use. While this may be true in most
parts of the developing world, in the water-short arid
and semi-arid zones of the Middle Eastern,
Southern and Northern African regions, the
Mediterranean, parts of China, Australia and the
USA, domestic water use can represent between 30
to 70% of irrigation water use (or between 10-40%
of total water use) in the extreme cases (Abu-Zeid
et al. 2004; Angelakis et al.
1999; Crook 2000;
FAO 1997a,b; Lallana et al. 2001; Peasey et al.
2000; WRI 2001; UNEP 2002; WHO 2006; AATSE
2004). Substitution of freshwater by treated
wastewater is already seen as an important water
conservation and environmental protection strategy,
which is simultaneously contributing to the
maintenance of agricultural production. In Australia
where the share of domestic water use (20% of
total water use) is the second highest in the world,
after the USA, the limited total water supply in the
country, has necessitated careful use of water and
recycling (in 2000 up to 11% of wastewater was
being recycled in major cities, Vigneswaran 2004).
Tunisia, a middle income country with an arid
climate, is a typical example of good practice in this
regard where over the past 20 years water reuse
has been integrated into the national water resources
management strategy. Over 60 wastewater plants in
Tunisia produce high quality reclaimed water for use
in agriculture, and irrigation of parks and golf courses
(Bahri 2000, 2002). Currently about 43% of the
treated wastewater is being recycled for these
purposes. A recent comprehensive compilation of
data on water reuse (Jimenez and Asano 2008),
provides an understanding of common practices
around the world, particularly of treated wastewater
for municipal and industrial uses, agriculture and
groundwater recharge.
3
Genesis of Untreated Wastewater Use
and Its Importance
While wastewater has the potential to serve as a
hitherto untapped water and nutrient source for
agriculture; where treatment is limited it also has
the potential to affect human health and pollute large
volumes of freshwater, rendering them unfit for
human uses. This problem is substantial in the
developing world where urbanization has outpaced
urban infrastructure development. Not only will cities
be growing at an unprecedented rate
accommodating 50% of the world’s population
(United Nations Population Division 2002) but urban
water demand per capita will also increase with
increasing supply, coverage and overall urban
economic growth. More than 80% of urban
consumption returns as waste (Tchobanoglous and
Schroeder 1985) and its disposal has already
become a major issue, likely to worsen in the future,
without centralized collection and disposal systems.
Furthermore, densification of urban areas reduces
the possibility for on-site disposal via septic tanks.
Centralized treatment systems in developing
countries are not always affordable anyway, and
when they are in place, they have always been
vulnerable to the vagaries of skills, and institutional
and financial capacities found in these countries. The
fact that present wastewater management practices
in major cities of the less developed countries are
much less than desirable, is an indication that
future scenarios are likely to be worse. As part of
the the Millennium Development Goals for
Sanitation, many countries are attempting to
address the challenges of water supply and
improved sanitation facilities for all without
necessarily paying attention to the disposal of the
increasing volumes of wastewater that are being
discharged, in many instances, into the natural
drainage systems and streams of the cities.
Figuratively speaking (waste)water finds its
own outlet, and either oceans or water bodies
close to cities act as a sink for wastewater. Thus,
freshwater bodies which are already being used for
multiple domestic and agricultural purposes
including informal irrigation, literally become
wastewater as their capacity for dilution decreases.
Therefore, the term wastewater as used in this
report can refer to treated, raw or diluted
wastewater or, simply, highly polluted streams (Box
1) used under official or informal conditions for
irrigated farming.
A number of case studies of city and country
assessments of varying detail conducted in middle
and low-income countries of Africa, Asia and Latin
America have recognized that the use of
untreated
wastewater for the irrigation of high-value cash crops
in and close to urban centers is a widespread
practice. Recent estimates indicate that 20 Mha
under agriculture are using treated, partially treated,
diluted and untreated wastewater (Scott et al. 2004;
Marsalek et al. 2005; Hamilton et al. 2007;Keraita
et al. 2008). Even in the absence of a more accurate
overall estimate, the fact is that a large part of this
area is farmed by millions of poor farm households
for whom wastewater is a highly important
productive resource. It is being used in profitable,
but often informal, production systems that
contribute significantly to the supply of perishable
produce, notably fresh vegetables, to urban areas
(Scott et al. 2004; Drechsel et al. 2006). Cities in
developing countries have difficulty in sourcing
perishable crops from more distant locations due to
the lack of necessary infrastructure and cooled
storage trucks for transport. Thus, they depend on
agriculture in market proximity. Furthermore, it is
recognized that for these poor urban farmers,
wastewater irrigation is a substantial and sometimes
even a primary source of cash income in addition to
contributing towards urban food supply (UNDP 1996;
Drechsel et al. 2006; Van Veenhuizen and Danso
2007).
Drivers of the Practice and Objectives
of the Study
Although wastewater use is a global phenomenon,
its extent and drivers are likely to vary between
regions and climatic zones. Despite increasing
efforts by the FAO and others, and a growing
number of individual studies and reviews (Jimenez
and Asano 2008; Keraita et al. 2008; Hamilton et
al. 2007; Lazarova and Bahri 2005; Jimenez and
Asano 2004; Van der Hoek 2004; Strauss and
Blumenthal 1990; Shuval et al. 1986); to date there
4
are no comprehensive datasets that provide an
understanding of wastewater agriculture and related
practices across countries and cultures.
It is understood that local opportunities and
constraints should guide policies and decisions
about wastewater irrigation or wastewater
agriculture. However, a knowledge of the drivers can
steer decisions better and provide, in addition, an
understanding of the trade-offs and limitations
associated with the practice. With this in view, a
study of 53 selected cities across the developing
world was commissioned on the state of
wastewater use in developing countries.
The study, therefore, attempts:
- to identify the different factors that drive
wastewater use in developing countries,
- to understand the potential role that
wastewater plays in reducing the demand for
freshwater resources, in contributing to urban
food supplies and as a livelihood strategy, and
- to assess the consequences of poor sanitation
and wastewater management for agriculture
and the environment.
This global study was supported by the
Comprehensive Assessment of Water Management
in Agriculture with a more detailed study in West
Africa (Drechsel et al. 2006) and linked to three
country case studies earlier commissioned by
IWMI in Vietnam, Ghana and Pakistan,
respectively (Raschid-Sally et al. 2004; Obuobie et
al. 2006; Ensink et al. 2004).
Methodology and Selection Criteria
The city assessment, in selected cities around the
world, was intended to provide first estimates of the
volumes of wastewater generated and the related
treatment and disposal practices, extents of
agriculture practiced with wastewater and its value
to society, its significance as a livelihood strategy,
and its health implications. The main source of
information was an extensive survey across 53
cities using a specifically designed questionnaire.
The surveys were conducted using local experts
from the selected countries/cities identified by an
independent panel. The questionnaire was
completed by the experts using secondary data,
and further expert consultation through key
informant and stakeholder interviews.
City Selection
The cities were selected through a stratification
process to include both regulated and non-
regulated (informal) use of wastewater. The regions
targeted were Latin America, Middle East, Africa
and Asia. The countries from these regions were
categorized by the IWMI water scarcity index
1
,
annual rainfall and income
2
, and the larger cities
were identified for each country. Information on city
area, city population, urban sprawl, and location
(inland or coastal) was obtained for all the cities in
order to get a basic understanding of the individual
situation and to arrive at the final selection of cities
representing the given diversity.
The city boundaries were based on the authors’
understanding of the different definitions used in
urban planning for city area boundaries (Box 2).
Initially 45 cities were targeted. However, it turned
out that some of the megacities selected
comprised of more than one municipality (e.g.,
Kathmandu, La Paz, Sao Paolo, Mexico City and
Manila); which expanded the final number of cities
(which includes the urban and peri-urban areas)
considered in this study to the odd number of 53.
1
Seckler et al. (1997)
2
Economies are divided according to the 2003 GNI per capita, calculated using the World Bank Atlas method. The groups are: low
income - $765 or less; lower middle income - $766-3,035; upper middle income - $3,036-9,385; and high income - $9,386 or more
().
5
Box 2. Limitations of the study
Comparing city statistics in general, and looking at agricultural areas ‘in’ cities in particular, poses a
significant challenge as the outer demarcations of the administrative city boundaries and areas vary
significantly from city to city. Two examples might illustrate this:
The official administrative boundary of Accra, the capital city of Ghana, covers an area of about 230 square
kilometers (km²). The actual size of the urbanized area is, however, much larger (about 422 km²) as the
city boundaries are outdated. In both boundaries, there is little space for agriculture (about 10 km² in total
with, depending on the season, 0.5-1.5 km² ha under wastewater irrigation) (Obuobie et al. 2006).
In Vietnam, on the other hand, the municipal boundaries of Hanoi and Ho Chi Minh City (HCMC) comprise
much larger areas than the actual built “city” part, including several hundred square kilometers of agricultural
lands, which form nearly 50% of the administrative area, while the residential area covers less than 15%.
In these municipalities, agriculture is an essential part of municipal planning. In “suburban” HCMC there
are more than 900 km² of cultivated land.
As water pollution does not stop at the administrative city boundary, an ideal dataset would actually have
to go beyond these boundaries. This, however, was not possible to standardize. Having these limitations
in mind, we consider this study as a first approximation.
Data for the respective countries was collected/collated by different consultants. Hence, in spite of detailed
instructions and a well designed questionnaire, the quality of data varies from country to country. Wherever
the need was felt, data cross-referencing was done.
The calculated regressions presented in some figures are only supposed to indicate tendencies
irrespective of the level of significance.
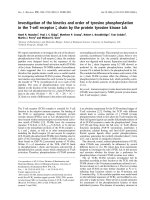
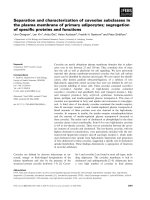
The regional distribution of the countries
selected is shown in Figure 1. The characteristics
of cities selected are shown in Figure 2. Of the 53
cities 14 were coastal of which 5 had populations
of over 5 million. Of the 39 inland cities 8 had
populations of over 5 million.
Design of the Questionnaire
To identify the drivers of wastewater irrigation and
extrapolate this data to other parts of the world,
relationships with factors like city poverty levels,
GDP per capita, sanitation coverage and the
percentage of wastewater treatment were
considered necessary. The questionnaire was,
therefore, designed to seek several types of
information: city statistics on development
indicators, population, environmental condition,
water supply, sanitation and waste disposal
statistics, wastewater management and industrial
development, environmental and irrigation
legislation, and water quality. Urban agriculture
was profiled to understand the context of
wastewater agriculture if it existed. Data on
wastewater agriculture, extents, practices and
methods, farmer perceptions of risk and risk
reduction methods, wastewater crop productivity,
prices and marketing, and the livelihoods generated
from wastewater agriculture through a profiling of
labor, wages, income, and poverty levels was also
requested where available. Gender differentiation
questions were included.
As the data was to be obtained essentially from
secondary data supplemented with key informant
and stakeholder interviews, it was expected that
some questions would be answered only for a few
cities where studies were available. As it turned out,
wages and income information was not available for
many of the cities and these parameters were not
included in the final analysis. The West Africa
Survey (Drechsel et al. 2006) and some of the case
studies in reference provide more details on some
of these parameters for interested readers.
6
FIGURE 1. Regional distribution of 53 selected cities/countries for the global survey.
FIGURE 2. Characteristics of (53) selected cities.
3 3
3 2 2
2 3
3 3
3
3
3 3
2
2
3
3
1
3
3
3
3
3
3
3
3
3
3
3
3
3 3
3 2
3
3
3
2
3
2
1
3 2
3
2
1
3
3
2
3
3
3
Population (millions) Water scarcity index (1,2,3) Scarcity index refers to the countries
1 = physical water scarcity
2 = economic water scarcity
3 = no water scarcity
Population (millions)
20.00
15.00
10.00
5.00
0.00
7
Results and Discussion
In the following sections, the basic information
derived from the analysis is presented.
Before analyzing data directly related to the use
of wastewater for agriculture, the first sections will
present a short analysis of water supply, sanitation
and waste disposal settings as one of the identified
drivers of wastewater agriculture, by looking at
trends in urban water use, and its implications for
sanitation and waste disposal in cities.
City Water Supply, Waste Disposal and
Industrial Contamination
Urban water supply and its implications for
wastewater generation
In 60% of the cities both surface water and
groundwater are used for water supply, 23% used
only surface water and 17% used only groundwater.
Inland cities, which are closer to lakes or rivers, also
used such surface water sources.
Only 50% of the cities have a pipe-borne water
supply coverage of over 90%, indicating that in
many cities service coverage is still largely
inadequate. At least 25% of the cities have
coverage of less than 25% (Figure 3).
The actual per capita water consumption
3
showed a very large variation from 34 to 350 l/c/d
(Figure 4). Half the cities have a consumption of
100-250 l/c/d. This is quite high for LDCs but it
must be remembered that non-domestic supply
(smaller and larger industries, etc.) is included, and
that system losses can be high – 50% of the
countries indicated losses between 25 and 55%.
There is a significant increase in water
consumption with the GDP/capita.
FIGURE 3. Water supply, sanitation, and sewer coverage by city.
3
Calculated as “actual volume of water supplied by a water utility, divided by the population served, expressed in liters per capita
per day.”
8
Sanitation coverage and type
Knowing sanitation coverage
4
and the manner in
which wastewater is collected and disposed of in
a city, are essential to gain an understanding of
the drivers of wastewater agriculture. About 80% of
the cities had at least a small sewer system
(sometimes various small areas of cities were
sewered), but only one third of the cities reached
a household coverage of 80%. Half of the
responding cities had only closed sewers, whereas
33% had both open and closed sewers. Relating
GDP/capita to sewer coverage shows a large and
non-significant variation (Figure 5) which implies (in
comparison with Figure 4) that investments in
water supply are not accompanied with similar
investments in wastewater collection.
From Figures 3 and 6, it is evident that 82%
(39 of 47) of the cities had sanitation coverage of
over 75% showing that most cities are well served
with some form of sanitation.
In at least 60% of the cities, a large
percentage of the urban population (between
30-100%) is still served by on-site sanitation
systems (septic tanks/water flush pit latrines/
dry pit latrines) (Figure 6). Nearly half these
cities have populations of over one million.
Under conditions of urban densification, on-site
systems which require space cannot function
efficiently leading to septage disposal
problems.
Treatment and disposal of septage and sewage
Disposal of household septage is by tankers in
80% of the cities and is handled by both the public
and private sectors. Despite guidelines/regulations
in many countries for safe disposal, the collected
septage is disposed of in whatever convenient
location that is available, sometimes into the
sewers serving other parts of the cities, in other
instances in rivers and other surface water bodies.
In a few cases municipalities regulate the disposal
when it is a private service and the septage is
treated/dried before disposal.
In spite of relatively good sewer coverage in
some cities, this does not imply that all the
wastewater collected is also treated. While 74% of
FIGURE 4. Actual per capita water consumption (in l/c/d).
4
Sanitation coverage does not include solid waste disposal.
9
FIGURE 5. Sewer coverage and GDP/capita.
cities with sewers treat their wastewater, the type
and degree of treatment varies widely. Responses
from 27 cities indicated that only 30% treated all
the wastewater collected. More than half of the
cities treated less than 50% of the wastewater
collected (Figure 7) at least to primary and in part
secondary level with stabilization ponds or other
biological processes. Only two cities carried out
tertiary treatment on some of the wastewater for a
specific use.
However, in 56% of the cities the treatment
plants were reported as only partially functioning or
not functioning at all. Overloading and poor
maintenance were given as key reasons for
ineffective treatment leading to water pollution of
receiving water bodies.
This does not only concern surface water
bodies. Many cities mentioned groundwater
contamination from point sources (leachate from
garbage dumps) and non-point sources (overflows
from septic tanks).
“Quality” of wastewater and industrial
contamination
Two thirds of the cities studied had a common
sewer system for the disposal of both domestic
and industrial wastewater. Only 28% had separate
sewers, showing that in many cities industrial
contaminants will find their way into municipal
systems. Even in cities where wastewater is largely
of domestic origin (90% of cities), the “better
quality” kitchen, laundry and bath waters are not
disposed of separately but sent to the sewer
system with the toilet wastes. There was no formal
grey water collection in any of the cities.
Even in cities categorized as largely
residential (14 of the cities studied), there was
a certain degree of mixing of industrial
wastewater. However, in the majority of cities
(70%), inflow of industrial wastewater was
minimal due to limited industrialization and even
in the worst cases did not exceed an estimated
40-50%. With a few exceptions, most industrial
10
FIGURE 6. Type of sanitation coverage in the cities.
11
development was on a small-scale within cities.
Contamination, of course, depends on the type
of industry, but related information was scarce.
About 60% of the responses confirmed that
industrial wastewater was treated to some
degree before being discharged, but with poor
enforcement of regulations it is unlikely that
treatment is very effective in removing chemical
contaminants that are potentially harmful to
human health.
However, in most developing countries with
poor road infrastructure, heavy industry, if present,
is located close to harbors where wastewater is
discharged into the ocean without further use. Of
the 14 coastal cities, 10 had rivers running through
them which collected the waste before discharging
into the sea. The others discharged directly into the
ocean.
Wastewater in Urban Farming - Extents
and Impact on Poverty and Water
Scarcity
Nature and extent of wastewater irrigation
The presence of irrigated urban and peri-urban
agriculture (UPA) was considered as a necessary
condition for the occurrence of wastewater
agriculture, where wastewater treatment was
limited. Out of the 53 cities studied, only 8 cities
reported to have little or no irrigated UPA. Seventy-
four percent of the cities studied had wastewater
agriculture though data on extents was not
available for some of them. Where data was
available (31 cities in this case), cumulative figures
show that there are about 1.1 million farmers
around these cities making a living from cultivating
FIGURE 7. Wastewater collected as a percentage of wastewater generated and wastewater treated as a percentage of
wastewater collected.
12
0.4 Mha of land irrigated with wastewater (raw or
diluted wastewater and includes all those areas
that use polluted rivers as the irrigation water
source). The regional breakdown of wastewater
agriculture by area or by the number of farmers,
the distribution of extents across cities, and the
cities with the largest extents, are shown in Tables
1, 2 and 3, respectively. The large standard
deviation for each group and the lack of correlation
with the GDP/capita shows that wastewater
agriculture has wide variations and occurs under a
wide variety of socioeconomic situations. Other
factors that may explain this variation across
groups, are the location of the cities (e.g., no
downstream agricultural areas), and the often
outdated and comparatively narrow city boundaries
in some cases (see Box 2). This was seen to be
especially so for many West African cities.
In the majority of cities in Asia landholding
sizes were seen to be small (less than 1 ha) in
contrast to the Latin American situation where
farmers owned larger farms in the range of 4-5 ha.
In Africa, on the other hand, urban farm sizes are
usually less than 0.05 ha, while peri-urban farms
are about 1 ha on average (Drechsel et al. 2006).
Links to poverty, migration and water scarcity
It was interesting to see that as the poverty level
in the city increases, i.e., the number of poor living
within the city, the share of wastewater agriculture
to urban agriculture increases, suggesting a close
relationship (Figure 8). It seems plausible to infer
from this that farmers in ‘poorer’ cities tend to face
increasingly polluted water sources. This appears
to be particularly so in Asia.
Rural-urban migration is a general factor of
urbanization and was reported from 89% of the
cities. It appeared, in general, higher in the
selected African (2.5% percent on average) and
Asian (4.2% on average) cities compared to Latin
America (1.0% on average). Many cities with low
GDP/capita (less than USD 2,000) had higher
levels of rural to urban migration (Figure 9). As
national income levels increase, the incentives for
migration appear to decrease. This is also
reflected in variations in the city poverty index
5
which, on average, decreased as we move from
Africa to Asia to Latin America.
Under lower GDP/capita conditions (<USD
2,000/year), and where alternative urban
employment is not available, the high levels of rural-
TABLE 1. Extents and numbers of farmers by region.
Region No. of cities with data Total farmers WW Total WW area (ha)
informal and formal informal and formal
Subtotal Africa (AF) 9 3,550 5,100
Subtotal Asia (AS) 19 992,880 214,560
Subtotal Latin America (LA) 8 88,300 142,160
Subtotal Middle East (ME) 3 3,320 34,920
Total 39 1,088,050 396,740
TABLE 2. Distribution of extents of wastewater agriculture.
Extents (ha) No. of cities GDP/capita range ($)
Range Mean (SD)
10-1,000 321 (272) 11 1,100-8,800
1,000-10,000 3,506 (2,589) 9 1,000-5,000
10,000-45,000 22,505 (12,917) 9 1,700-9,900
>75,000 - 2 2,500-9,000
5
Percentage of the population below the poverty line. In most cases the poverty line was about USD1/day.
13
FIGURE 8. Wastewater agriculture variations with city poverty.
FIGURE 9. Urban-rural migration versus GDP per capita.
14
urban migration, particularly in the African and Asian
cities studied, may be a factor that drives the
migrant population towards market-oriented urban
agriculture (in cities where land is available for this).
An added reason is that these migrants are from an
agricultural background which attracts them to use
their skills where they are not competitive in other
employment sectors. A survey of 12 cities in West
Africa also showed that in many cities the majority
of urban farmers engaged in irrigated agriculture are
migrants (Drechsel et al. 2006).
Among the cities falling in the lower range of
GDP/capita, irrigated UPA in many of them has
small plot sizes (varies between 0.07 and 1.2 ha,
but could sometimes be as small as 0.01 ha), low
overall extents of land under urban and peri-urban
agriculture (<15,000 ha) (Figure 10), and,
consequently, lower total extents of wastewater
agriculture. The lower plot sizes in many low-
income cities in Africa is explained by the fact that
plot sizes depend not only on access to land and
water, but also on security of tenure and farmers’
financial means to hire labor, all of which are limited
in low-income countries (Drechsel et al. 2006).
FIGURE 10. Landholding size and overall extents of urban agriculture with GDP/capita.
Close to three-fourths of the sample cities
studied had over 50% of their urban and peri-urban
agricultural land under wastewater. Notably, such a
dominance of wastewater irrigation in UPA is
independent of the level of economic growth of the
country in which the cities are located (Figure 11).
This means that wastewater agriculture is not
necessarily a phenomenon associated with the
poorest of countries, but is also a significant
phenomenon in high and middle income countries,
where wastewater collection and treatment might
gain momentum but is still far from providing full
coverage or being comprehensive. This was also
clearly seen in the sample of cities across Latin
America and Asia (Table 3).
One aspect that is common across all the
cities is that wastewater irrigation takes place
under dry and wet climates, as it allows to crop in
the dry season even in humid climates. However,
it is noteworthy when comparing across cities with
rainfall below 900 millimeters (mm) that wastewater
irrigation definitely occurs in all but two of these
cities
6
, clearly showing that scarcity of water is
also a driving factor (Figure 12).
6
In Chennai, India, where wastewater agriculture was not reported in the study; and in Mexico City where the wastewater is transported
to the adjoining valley for agriculture.
15
Table 3. Cities with largest extents of wastewater agriculture.
Region City Country City population Total WW area Total farmers
(millions) (ha) informal WW informal
and formal and formal
AS Ahmedabad India 2.88 33,600 No data
AS Hanoi Vietnam
1
3.09 43,778 658,300
AS Ho Chi Minh Vietnam
1
5.55 75,906
2
135,000
AS Kathmandu Nepal 0.67 5,466 19,524
AS Shijiazhuang China 2.11 11,000 107,000
AS Zhengzhou China 2.51 1,650 25,000
LA Mexico city/El Mezquital
3
Mexico 21.3 83,060 73,632
LA Santafé de Bogotá Colombia 7.03 22,000 3,000
LA Santiago Chile 5.39 36,500 7,300
1
Hanoi and Ho Chi Minh have very large extents of urban and particularly peri-urban agricultural land where irrigation water is often
from polluted rivers running through the cities. The farmer numbers are large because of the importance of urban and peri-urban
agriculture as a livelihood activity.
2
Cropped area
3
The large volume of wastewater from Mexico City is used to cultivate land in the El Mezquital Valley.
FIGURE 11. Variation of percentage of wastewater agriculture with GDP/capita.
16
Water Sources, Crops Grown and
Irrigation Methods
Water sources and quality as it affects
decisions on wastewater use
Water sources used for irrigated UPA (Figure 13)
were seen to vary between surface water,
rainwater and groundwater. Rainwater, and with
reservation groundwater, were assumed in many
cases to be “clean” compared to surface water
sources. In 31 out of 41 cities that responded on
the reasons for wastewater use, there was a clear
indication that farmers have generally little or no
alternative (safer) water source than diluted
wastewater/polluted river water or untreated
wastewater. Preferential use of wastewater for its
nutrient value and for its abundance (15 of 41) and
regularity (16 of 41) were also cited as key
reasons. The fact that wastewater is often
available at no charge, was, however, seldom
mentioned as an incentive for its use (5 out of 41
cities). From the data it was clear that if farmers
have access to other water sources they will not
seek to use wastewater. Avoiding wastewater use
FIGURE 12. Extent of wastewater agriculture versus annual rainfall.
due to cultural constraints or due to awareness of
risk was not cited as valid reasons for non-use,
although some feel public pressure as reported
from Ghana (Obuobie et al. 2006). However, a
remarkable 41% of the farmers complained about
industrial water contamination.
Crops grown and irrigation methods
Across the cities, vegetables and cereals
(especially rice) were the two most common crop
farmers cultivated with wastewater (Table 4). The
popularity of vegetables as a crop is easily explained
by their cash crop status, the lack of suitable
transport for perishable produce, and the ready
market proximity for such produce. Cereals, on the
other hand, are equally popular, partly for sale as a
cash source but mostly for consumption by the
farming families themselves. There was a clear bias
to more rice/cereal based systems in Asia.
For the type of irrigation method used, furrow,
flood and watering cans appeared to be the most
popular (Figure 13). In Africa, as irrigation with
polluted stream water or wastewater only occurs in
the informal smallholder irrigation sector, most of
17
FIGURE 13. Water sources, quality and methods used in wastewater agriculture.
TABLE 4. Distribution of crop types grown with wastewater.
Type of crop Number of cities*
Africa Asia Latin America Middle East
Vegetables 8 16 7 1
Cereals 5 15 5 2
Fodder 1 5 3 0
Other 1 5 3 2
* multiple responses were possible
the African cities use mainly watering cans and
furrow methods or flooding for wastewater irrigation
(see also Drechsel et al. 2006) while Asian cities
use a larger variety of methods. In the Latin
American countries farmers rely on methods
suitable for larger landholdings (furrow and flood
predominate, with some sprinkler).
The lack of popularity of drip systems and
sprinkler methods was confirmed in this survey as
well, with farmers citing the commonly evoked
reasons of costs and maintenance in the light of
poor water quality.
Farmer Perceptions of Health Risks
Water quality and occupational risks
Table 5 shows that in 19 cases no protection was
taken against wastewater exposure. An almost
equal number protected their feet, but it was seen
that in many instances this was not so much to
protect against pathogens or other contaminants
found in wastewater, but more as a protection
against rough surfaces, snakes and other field
dangers. The majority of farmers across the cities