Báo cáo khoa học: Investigation of the kinetics and order of tyrosine phosphorylation in the T-cell receptor f chain by the protein tyrosine kinase Lck potx
Bạn đang xem bản rút gọn của tài liệu. Xem và tải ngay bản đầy đủ của tài liệu tại đây (273.17 KB, 8 trang )
Investigation of the kinetics and order of tyrosine phosphorylation
in the T-cell receptor f chain by the protein tyrosine kinase Lck
Hazel R. Housden
1
, Paul J. S. Skipp
1
, Matthew P. Crump
1
, Robert J. Broadbridge
1
, Tom Crabbe
2
,
Martin J. Perry
2
and Michael G. Gore
1
1
Division of Biochemistry and Molecular Biology, School of Biological Sciences, University of Southampton, UK;
2
Celltech Group plc, Slough, UK
We report experiments to investigate the role of the physio-
logically relevant protein tyrosine kinase Lck in the ordered
phosphorylation of the T-cell receptor f chain. Six synthetic
peptides were designed based on the sequences of the
immunoreceptor tyrosine-based activation motifs (ITAMs)
of the f chain. Preliminary
1
H-NMR studies of recombinant
f chain suggested that it is essentially unstructured and
therefore that peptide mimics would serve as useful models
for investigating individual ITAM tyrosines. Phosphoryla-
tion kinetics were determined for each tyrosine by assaying
the transfer of
32
P by recombinant Lck on to each of the
peptides. The rates of phosphorylation were found to
depend on the location of the tyrosine, leading to the pro-
posal that Lck phosphorylates the six f chain ITAM tyro-
sines in the order 1N (first) > 3N > 3C > 2N > 1C >
2C (last) as a result of differences in the amino-acid sequence
surrounding each tyrosine. This proposal was then tested on
cytosolic, recombinant T-cell receptor f chain. After in vitro
phosphorylation by Lck, the partially phosphorylated f
chain was digested with trypsin. Separation and identifica-
tion of the f chain fragments using LC–MS showed, as
predicted by the peptide phosphorylation studies, that
tyrosine 1N is indeed the first to be phosphorylated by Lck.
We conclude that differences in the amino-acid context of the
six f chain ITAM tyrosines affect the efficiency of their
phosphorylation by the kinase Lck, which probably contri-
butes to the distinct patterns of phosphorylation observed
in vivo.
Keywords: immunoreceptor tyrosine-based activation motif
(ITAM); mass spectrometry; NMR; protein tyrosine kinase
Lck; T-cell receptor f chain.
The T-cell receptor (TCR) complex is essential for T-cell
function in the adaptive immune response. On binding of
the TCR to appropriate antigens, Src-family protein
tyrosine kinases (PTKs) such as Lck phosphorylate tyro-
sines located within immunoreceptor tyrosine-based activa-
tion motifs (ITAMs) [1,2]. ITAMs have the consensus
sequence Y-X-X-(L or I)-X
(6)8)
-Y-X-X-(L or I) and are
found in the intracellular portions of the TCR complex c,
d, e and f chains, as well as in other immunoreceptors
including the B-cell receptor [3] and several Fc receptors
[4,5]. Doubly phosphorylated ITAMs form binding sites for
pairs of Src homology domain 2 (SH2) domains, such as
those found on ZAP-70 (f-associated protein of 70 kDa).
Within 15 s of stimulation of the TCR, ZAP-70 binds
to phosphorylated f chain and becomes activated [6]. A
phosphorylation cascade ensues which culminates in T-cell
activation. Therefore, phosphorylation of ITAM tyrosines
is an absolute requirement for the TCR-mediated trigger of
T-cell activation [2,7]. Probing the TCR with different
stimuli leads to various patterns of f ITAM tyrosine
phosphorylation which in turn alters the T-cell response [8].
Only full agonist ligands can enable full phosphorylation of
all six ITAM tyrosines to make the phosphorylated f form
Ôp23Õ [9] and bring about the full array of T-cell effector
functions [including ZAP-70 recruitment, interleukin 2
production, calcium fluxing, and Ins(1,4,5)P generation].
Partial agonist ligands effect partial phosphorylation,
sometimes generating the partially phosphorylated f form
Ôp21Õ, and a partial or antagonist response.
The observed, crucial, ordered phosphorylation of TCRf
chain ITAMs may potentially be influenced by several
different factors in vivo. We report data from experiments
designed to investigate the role of PTK Lck in this process
and ascertain whether the kinase has a preference for
phosphorylation of certain ITAM tyrosines over others.
The six TCRf ITAM tyrosines investigated will be
described according to their location in the TCR, with the
ITAM closest to the N-terminus/membrane referred to as 1,
the next closest as 2, and the farthest as 3. The two tyrosines
within each ITAM are then further classified as N or C,
reflecting their locations relative to the N-terminus and
C-terminus (Fig. 1). Six synthetic peptides were made based
on the individual sequences of TCRf, and modified to con-
tain only a single tyrosine. These served as model substrates
for assessment of the phosphorylation kinetics of these
individual tyrosines. The absence of secondary structure in
Correspondence to M. G. Gore, Division of Biochemistry and
Molecular Biology, School of Biological Sciences, University of
Southampton, Southampton SO16 7PX, UK.
Fax:+442380594459,Tel.:+442380594313,
E-mail:
Abbreviations: ITAM, immunoreceptor tyrosine-based activation
motif; His-cTCRf, histidine-tagged cytosolic TCRf;PTK,protein
tyrosine kinase; SH2, src homology domain 2; TCR, T-cell receptor.
(Received 18 February 2003, revised 29 March 2003,
accepted 2 April 2003)
Eur. J. Biochem. 270, 2369–2376 (2003) Ó FEBS 2003 doi:10.1046/j.1432-1033.2003.03604.x
whole, cytosolic TCRf is shown by CD [10] and our
1
H-NMR spectroscopy, suggesting that it is unlikely that
ITAM tyrosines are buried by the rest of the f chain.
Consequently, tyrosines located on the peptides may be
expected to exhibit the same kinetics as those located on
the intact protein. Therefore, determination of the kinetics
of phosphorylation of these peptides allows the order of
phosphorylation of the six TCRf ITAM tyrosines, by the
PTK Lck, to be deduced.
Experimental procedures
Peptide synthesis
Peptides were made by manual solid-phase peptide synthesis
using the tBoc method [11], purified by RP-HPLC, and
analysed by MS. The following peptides were synthesized
for direct determination of phosphorylation kinetics: 1N,
QNQLYNELNLGRREEFDVLDNle; 1C, QNQLFNEL
NLGRREEYDVLDNle; 2N, QEGLYNELQKDKMAE
AFSEIG; 2C, QEGLFNELQKDKMAEAYSEIG; 3N,
HDGLYQGLSTATKDTFDALH, 3C, HDGLFQGLST
ATKDTYDALH. The nonstandard amino acid norleucine
(Nle) was used to replace a methionine in the ITAM1-based
peptides, which exhibited a tendency for oxidation during
synthesis. A phosphotyrosine (pY)-containing peptide,
based on f ITAM1, (pp1, QNQLpYNELNLGRREEpY
DVLD) was synthesized using Fmoc chemistry [12], for use
as an experimental control. An unrelated Ôcontrol peptideÕ
(CP, GAHNITEEEDTWQKLC) was also used. The con-
centrations of most of the peptides were determined from
their A
280
, using absorption coefficients of 5690
M
)1
Æcm
)1
for tryptophan, 1280
M
)1
Æcm
)1
for tyrosine, and 0
M
)1
Æcm
)1
for phenylalanine [13]. The concentration of phosphotyro-
sine-containing peptides was determined at 267 nm using
molar absorption coefficients of 652
M
)1
Æcm
)1
for phospho-
tyrosine [14] and 1427
M
)1
Æcm
)1
for tyrosine [15].
Gene cloning, protein expression, and purification
of glutathione
S
-transferase (GST)–Lck
The coding region of human
p56
Lck (amino acids 1–509)
was placed in-frame with the coding sequence of GST from
Schistosoma japonicum [16] in a pEE12 vector [17], which
was then stably transfected into the mouse myeloma NS0
cell line. Cells were grown in mass culture before harvesting
and lysis in 50 m
M
Tris/HCl, pH 7.3, containing 1%
Nonidet P40 and protease inhibitors. GST–Lck was purified
using glutathione-linked resin, washing in buffer A (25 m
M
Pipes/NaOH, 500
M
NaCl, pH 6.8), and then eluting the
bound GST–Lck in 20 m
M
glutathione (reduced) in buffer
A, before storage in aliquots at )70 °CinbufferAwith
10% (v/v) glycerol.
Gene cloning, protein expression, and purification
of His-cTCRf
The cytosolic portion of human TCRf was cloned into the
pQE-30 vector (Qiagen) giving it an N¢-terminal His
6
tag.
Sequencing of this cTCRf gene revealed it to have a slightly
different nucleotide, and consequently amino-acid, sequence
from the published sequence for the cytosolic portion of
TCRf. Instead of the nucleotide sequence gcagag at
positions 249–254 published by Weissman et al. [18],
corresponding to residues Glu60 and Phe61 in the whole
protein (SwissProt accession number P20963), we found the
nucleotide sequence gacgcc in our His-tagged cystosolic
TCRf chain (His-cTCRf) gene, corresponding to residues
Asp21 and Ala22 in His-cTCRf. The variation in sequences
is probably due to natural polymorphism of this gene and is
thought unlikely to influence the phosphorylation kinetics,
as the residues involved do not lie in any of the ITAMs or
the ITAM peptide mimic sequences used in our studies.
To produce His-cTCRf, a single colony of freshly
transformed Eschericia coli JM103 cells was grown over-
night in Luria–Bertani broth containing 100 lgÆmL
)1
ampicillin. Six flasks containing 750 mL Luria–Bertani
broth and ampicillin were inoculated and grown at 37 °Cin
an orbital shaker. When the A
600
reached 0.6, expression of
His-cTCRf wasinducedwith1m
M
isopropyl thio-b-
D
-
galactoside (final concentration), and the cells grown for a
further 3 h before harvesting by centrifugation. Cell pellets
were resuspended in buffer A [50 m
M
Tris/HCl, 500 m
M
NaCl, 0.01% (w/v) sodium azide, pH 7.5] also containing
lysozyme (1 mgÆmL
)1
; Sigma), a Complete
TM
EDTA-free
protease inhibitor cocktail tablet, and DNase I (5 l
M
; both
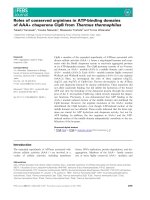
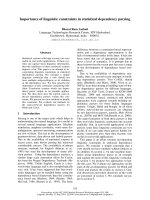
Fig. 1. Nomenclature used to describe positions of the six ITAM tyrosines in TCRf and simulated trypsin digest of His-cTCRf. The ITAM tyrosines
have been named according to the ITAM they are in and their position within each ITAM (towards the N¢ or C¢ terminus). Thus the individual
tyrosines are named 1N, 1C, 2N and so on, as shown in bold above the corresponding tyrosine. The location of trypsin cleavage sites (fl)inHis-
cTCRf is such that complete digestion will separate all of the ITAM tyrosines on to different peptide fragments (numbered in italics), which contain
between8and22residues.
2370 H. R. Housden et al.(Eur. J. Biochem. 270) Ó FEBS 2003
from Roche Diagnostics GmbH, Mannheim, Germany)
and sonicated. The soluble His-cTCRf was separated from
insoluble debris by centrifugation at 40 000 g and purified
using a 5-mL Hi-trap chelating column (Amersham Phar-
macia Biotech UK Ltd) charged with Ni
2+
ions. Buffer A
containing 50 m
M
imidazole was used to remove weakly
binding contaminants from the coordinated Ni
2+
. The pure
His-cTCRf wasthenelutedin200m
M
imidazole [in 50 m
M
Tris/HCl, 500 m
M
NaCl, 0.01% (w/v) sodium azide,
pH 7.5] and exhaustively dialysed against buffer A to
remove imidazole.
Assay of radioactivity incorporation
Peptides were prepared at a range of concentrations
between 0 and 140 l
M
and incubated with recombinant
PTK GST-Lck (0.03–0.1 mgÆmL
)1
)and[c-
32
P]ATP
(1–5 lCi per reaction; Amersham Pharmacia Biotech UK
Ltd) in 50 m
M
Tris/HCl, pH 7.5, containing 150 m
M
NaCl,
10 m
M
MgCl
2
,10m
M
MnCl
2
and 50 l
M
nonradioactive
ATP. Each 40 lL reaction was incubated for 30 min at
30 °C, and then stopped by adding 8 lL acetic acid.
Aliquots (12 lL) of stopped reaction mixture were applied
to strips of P81 phosphocellulose paper (Whatman), in
triplicate. Once completely dry, the strips were washed in
1% (v/v) phosphoric acid for 3 · 10 min, then rinsed for
5 min in acetone, and air-dried. The strips were immersed in
scintillation fluid (Optiphase HiSafe 3; Wallac), and a
Beckman LS 6500 scintillation counter was used to detect
32
P. As a negative control, 50 l
M
assayed peptide was
incubated without the GST-Lck. To determine the total
radioactivity present for each experiment, 12 lLlotsof
pooled, stopped reaction mixture were pipetted on to three
phosphocellulose strips which, after drying, were transferred
directly into the scintillation fluid, without washing.
NMR of His-cTCRf
The protein was resuspended in 500 lLH
2
Oand50lL
D
2
O, and the pH adjusted to 6 with dilute HCl. Standard
1D and 2D NOESY and DQF-COSY experiments were
recorded at 600 MHz on a Varian INOVA spectrometer at
the University of Southampton. Spectra were processed and
analysed using VNMR.
Analysis of the phosphorylation of His-cTCRf
using on-line LC-MS
A 1.6-mL reaction was prepared, containing 84 l
M
His-
cTCRf,24lgÆmL
)1
GST-Lck, 300 l
M
ATP, 10 m
M
MgCl
2
,10m
M
MnCl
2
,20m
M
Tris/HCl, pH 7.5. It was
incubated at 37 °C, and 200 lL samples were removed after
0, 5, 15, 30, 60, 90, 120 and 180 min and mixed with 40 lL
acetic acid to stop the reaction. The His-cTCRf was then
purified from the other reaction components using RP-
HPLC. For each timepoint sample, 200 lL stopped reac-
tion mix was loaded on to a 50 · 4 mm Genesis C
4
column
with 4-lm diameter beads with 300-A
˚
pores (Jones Chro-
matography USA Inc., Lakewood, CO, USA) using a
Hewlett-Packard series 1050 HPLC at 0.7 mLÆmin
)1
in
solvent A [0.1% (v/v) trifluoroacetic acid in H
2
O]. A linear
gradient was run from 5 to 40% solvent B [0.05% (v/v)
trifluoroacetic acid in acetonitrile) over 24 min following the
A
216
. All of the His-cTCRf phosphospecies were eluted at
about 20 min and were collected. Samples of these were
analysed using MS to identify the phosphospecies present.
Mass spectra were collected using a Fisons VG Quattro II
electrospray mass spectrometer in positive ion mode with a
scan range of 500–2500 m/z, a source temperature of
100 °C, and capillary and cone voltages of 4230 V and
29 V, respectively. Mass profiles were deconvoluted using
the maximum entropy software
MAX ENT
(Micromass UK
Ltd., Manchester, UK) initially over a 5–25 kDa, and then
finally to 1 Da resolution between 14 and 15.5 kDa (the
only region containing significant peaks).
The HPLC-purified, partially phosphorylated, His-
cTCRf samples were concentrated to dryness under vacuum
and then redissolved in solution containing 50 m
M
ammo-
nium bicarbonate, 5 m
M
CaCl
2
, 10% (v/v) acetonitrile and
HPLC-grade trypsin (Roche Diagnostics GmbH; 4% of the
mass of His-cTCRf) and incubated at 37 °Cfor24hto
separate each ITAM tyrosine on to a different fragment
(Fig. 1). The 200-lL samples were loaded on to a Synergi
4 l RP-polar HPLC column (250 · 4.6 mm; Phenomenex,
Torrance, CA, USA) using a Hewlett–Packard series 1050
HPLC at 8% solvent B [where solvent A is 0.1% (v/v)
trifluoroacetic acid in water and solvent B is 0.05% (v/v)
trifluoroacetic acid in acetonitrile] at 0.7 mLÆmin
)1
.The
peptide fragments were separated on a linear gradient of
8–40% solvent B, over 99 min, and, on exiting the column,
passed through a UV detector set to 216 nm; 10% of the
flow was directed into the Fisons VG Quattro II electro-
spray mass spectrometer, set in positive ion mode, for
continuous recording. Scans were set up to detect ions with
m/z values in the range 500–2500, with a source temperature
of 100 °C and capillary and cone voltages of 4230 V and
29 V, respectively.
Results
The phosphorylation was investigated by incubating a range
of concentrations of each ITAM peptide with recombinant
GST–Lck, [c-
32
P]ATP and unlabelled ATP over 30 min.
The excess of ATP ensured that none of the reactions were
rate-limited by ATP concentration. The levels of incorpor-
ation of
32
P into the peptide were used to calculate the
kinetics of phosphorylation by Lck at each tyrosine, and
from these an order of phosphorylation was determined.
The results of these peptide studies were then followed up
using whole (cytosolic) f chain. The recombinant f chain
was phosphorylated under limited ATP conditions, so that,
if phosphorylation were ordered, then only the first tyrosine
in the series would become significantly phosphorylated.
Samples of the partially phosphorylated f chain were then
digested with trypsin so that each ITAM tyrosine was on
a different fragment. On-line LC-MS was then used to
separate and identify the fragments, allowing clear identi-
fication of the first tyrosine phosphorylated by Lck, as
tyrosine 1N, in agreement with the peptide-based studies.
Assay of
32
PO
4
incorporation
For each peptide representing a tyrosine from His-cTCRf,
triplicate scintillation count data were obtained at a range
Ó FEBS 2003 Phosphorylation of the T-cell receptor f chain (Eur. J. Biochem. 270) 2371
of peptide (substrate) concentrations. The triplicate values
were averaged, and the negative control subtracted. The
short half-life of
32
P necessitated determination of the spe-
cific radioactivity of the phosphate at the time of the assay
from the Ôtotal radioactivityÕ samples, to allow conversion
from c.p.m. to mol phosphate. The phosphorylation was
shown to occur at a constant rate over the 30 min duration
of the assay (data not shown) and was not limited by
concentrations of peptide or ATP, the latter giving rise to
near saturation (95%) of the enzyme [19]. It was therefore
assumed that the extent of phosphorylation at 30 min is
directly proportional to the phosphorylation rate. For each
set of peptide concentrations and corresponding rate values,
kinetic parameters were calculated using the Hanes–Woolf
derivative of the Michaelis–Menten equation (S/v) ¼
(K
m
/V
max
)+(S/V
max
), where v ¼ therateofreaction,
V
max
¼ the maximum rate at infinite substrate concentra-
tion, S ¼ the substrate concentration, and K
m(app)
¼ the
Michaelis constant under these conditions. From the
calculated value of V
max
, the turnover number [k
cat(app)
]
was also determined under these conditions. The values
obtained for phosphorylation of each of the six f ITAM
tyrosines are presented in Table 1. Here it is seen that the
K
m(app)
of Lck for each of the tyrosines ranges from
2.3 · 10
)5
to 21.7 · 10
)5
M
,andinallcasesishigherthan
the published K
m
of PTK Lck for an ÔartificialÕ,single
tyrosine-containing peptide AEEEIYGVLFAKKKK
(1.7 · 10
)5
M
) [19] and for a peptide based on whole,
cytosolic, TCRf, containing all three ITAMs (0.65 ·
10
)5
M
) [20]. The k
cat(app)
ranges from 2.3 · 10
)4
to
98 · 10
)4
s
)1
for phosphorylation of the different f ITAM
tyrosines. Our values are lower than the k
cat
value calculated
from published data for the PTK c-Src for phosphorylation
of enolate (250 · 10
)4
s
)1
) [21], and also those for PTK Csk
with a-casein as substrate (ranging from 330 · 10
)4
s
)1
[22]
to 2400 · 10
)4
s
)1
[23]). The specificity constant [k
cat(app)
/
K
m(app)
], a measure of the enzyme’s efficiency with different
tyrosine substrates, allows a direct comparison of its
effectiveness at phosphorylating the different tyrosines, with
a high specificity constant indicating high efficiency. It can
be seen that Lck shows marked differences in specificity
towards the six tyrosines investigated, suggesting that it will
phosphorylate TCRf in the order 1N first [k
cat(app)
/
K
m(app)
¼ 122
M
)1
Æs
)1
], then 3N, 3C, 2N, 1C and lastly
2C [k
cat(app)
/K
m(app)
¼ 1.76
M
)1
Æs
)1
], provided that all sites
are equally accessible.
Supplementary experiments were performed to investi-
gate the effect of the phosphotyrosine product on the ability
of Lck to phosphorylate tyrosine substrates. The radio-
activity-incorporation assay was performed for peptide 1N
in the presence of either a doubly phosphorylated ITAM1-
based peptide (pp1) or an unrelated control peptide (CP).
The K
m(app)
and k
cat(app)
values obtained for phospho-
rylation of peptide substrate 1N in the presence
(22.8 ± 5.5 · 10
)5
M
and 28.7 ± 15.9 · 10
)4
s
)1
, respect-
ively) and absence (25.1 ± 5.1 · 10
)5
M
and 23.1 ±
12.3 · 10
)4
s
)1
, respectively) of pp1 are not significantly
different, showing that there is no product inhibition.
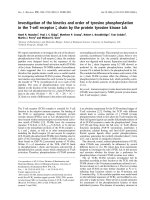
NMR of His-cTCRf
The 1D NMR spectrum of His-cTCRf is presented in
Fig. 2. The downfield region between 6.6 and 8.6 p.p.m.
shows several sets of peaks that can be grouped by type. The
two sharp peaks at 7.50 and 8.62 p.p.m. correspond to
the aromatic protons of the His
6
tag. At 7.8–8.6 p.p.m. the
amide resonances of the protein backbone show a poorly
dispersed envelope considering the protein size of 14.3 kDa.
In contrast, amide resonances show a well-dispersed envel-
ope of peaks in a folded globular protein. This alone
indicates that His-cTCRf has no defined secondary or
tertiary structure. The two groups of peaks at 6.85 and
7.15 p.p.m. correspond to the aromatic resonances of the
seven tyrosines in the protein, and the inset 2D expansion of
the
1
H-
1
H COSY shows that the seven are indistinguishable
from each other by chemical shift, showing just one
overlapped cross-peak between the d and e protons. The
remaining 2D spectrum shows few NOEs, again indicating
that the protein has no overall structure. In conclusion, it
appears that all of the seven tyrosines in His-cTCRf are in
similar chemical environments and may therefore be equally
exposed to solvent and potentially kinases.
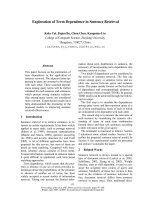
Following phosphorylation of His-cTCRf using MS
Samples of His-cTCRf were taken after different lengths of
incubation with GST-Lck, and their masses determined to
assess the level of phosphorylation. For the unphosphoryl-
ated sample shown in Fig. 3, the predominant mass was
14 274 Da (24 Da less than the mono-isotopic mass of
14 298 Da predicted from the amino-acid sequence using
Biolynx software from Micromass). No single chemical
process has been found to account for this, but it may well
result from a combination of processes, perhaps including
loss of the N¢-terminal methionine ()131 Da) and oxidation
of some or all of the remaining five methionines (as
observed by van Oers et al. [24]). Less abundant mass
species are mostly plus multiples of 14 Da, which could be
due to formylation. Mass determination of the samples of
His-cTCRf that were incubated with Lck revealed the
presence of several phosphospecies, which had masses that
were multiples of 80 Da larger than the unphosphorylated
protein. The deconvoluted calculated mass profile from a
sample incubated for 30 min, presented in Fig. 3, shows
that the sample contains His-cTCRf molecules phospho-
rylated at zero, one, two, three or four different locations.
Table 1. Kinetics of phosphorylation for each tyrosine of TCRf.
32
PO
4
-incorporation assays were used to determine the apparent
Michaelis constant [K
m(app)
], the apparent turnover number [k
cat(app)
]
and the specificity constant [k
cat(app)
/K
m(app)
] for phosphorylation of
peptides representing the six ITAM tyrosines in TCRf, by the kinase
Lck. Values are mean ± SD.
f tyrosine
investigated
K
m(app)
(· 10
)5
M
)
k
cat(app)
(· 10
)4
s
)1
)
k
cat(app)
/K
m(app)
(
M
)1
Æs
)1
) No.
1N 2.3 ± 0.1 28.0 ± 3.0 121.8 2
1C 3.1 ± 0.2 2.3 ± 0.7 7.4 2
2N 3.9 ± 1.6 7.8 ± 3.0 20.0 3
2C 21.7 ± 2.0 3.8 ± 0.8 1.8 2
3N 9.2 ± 0.4 95.0 ± 6.8 103.8 2
3C 11.9 ± 1.8 98.4 ± 16.8 82.7 3
2372 H. R. Housden et al.(Eur. J. Biochem. 270) Ó FEBS 2003
As expected, the extent of phosphorylation of His-cTCRf
increases with incubation time, and, in the 60 minute
sample, evidence of complete ITAM phosphorylation (six
phosphates) was seen. However, this analysis does not give
any information about the location of the phosphate groups
within the protein.
To determine the phosphorylation status of each ITAM
tyrosine in His-cTCRf, the protein was digested with
trypsin, which cleaves His-cTCRf so that each of the ITAM
tyrosine residues is on a different fragment, shown in Fig. 1.
On-line LC-MS analysis of the samples revealed the presence
of more products than would be expected after complete
trypsin digestion in both the UV and total ion count
recordings. Trypsin does not cut efficiently at pairs or groups
of neighbouring Arg and Lys residues, of which there are
several in the His-cTCRf sequence. Therefore, in practice, a
range of fragments are generated for each predicted peptide,
which differ by inclusion of additional Lys or Arg residues.
The individual mass spectra of samples comprising each
peak of the total ion count profile were examined for
evidence of multiple ion species of the predicted peptide
fragments. For each of the six f ITAM tyrosines, collections
of mass ions were found generated from peptides containing
the individual tyrosines, eluted at 32–58 min. Mass ions
corresponding to the phosphorylated species of each of these
fragments (with molecular mass of 80 Da more) were also
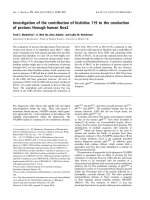
Fig. 3. MS profiles of unphosphorylated and 30 minute phosphorylated His-cTCRf. Mass spectra of His-cTCRf were determined for HPLC-purified
samples in 30% acetonitrile and 0.08% trifluoroacetic acid, using positive ion electrospray ionization MS. The mass spectra were combined and
deconvoluted to 1 Da. The regions containing significant peaks are expanded above to show the different mass species present in sample
phosphorylated for 0 min (left panel) and 30 min (right panel) of phosphorylation. The modal mass of the nonphosphorylated His-cTCRf is
14 274 Da, and the other mass species are mostly increased by multiples of 14 Da, which could be due to formylation. After phosphorylation,
species that have gained between 0 and 4 · 80 Da in mass are detected, corresponding to the addition of 0–4 phosphate moieties.
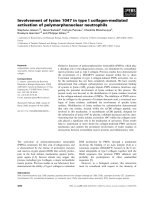
Fig. 2.
1
H-NMR spectroscopy of His-cTCRf. (A) Expansion of the 1D
1
HspectrumofHis-cTCRf. The aromatic resonances of the tyrosines are
marked with arrows. (B) Expansion from the
1
H-
1
H DQF-COSY of His-cTCRf. The major cross-peak is the correlation between the d and e
protons and is clearly overlapped for all seven tyrosines.
Ó FEBS 2003 Phosphorylation of the T-cell receptor f chain (Eur. J. Biochem. 270) 2373
identified, eluting 5–12 min earlier in the HPLC gradient
than their unphosphorylated partners, at 22–52 min). The
majority of the peptide fragments were present as +2 and
+3 ion species, with the +1 and +4 forms making a
negligible contribution to the overall mass ion count. An
attempt was made to use the second quadropole (MS-MS)
to look for parent ions that lost 80 Da (phosphate).
However, it was not possible to use parent ion scanning
because, unlike phosphoserine and phosphothreonine,
phosphotyrosine is unable to undergo b-elimination.
To determine the order of tyrosine phosphorylation in
His-cTCRf, the presence of each of the relevant fragment
mass ions in the samples phosphorylated for different
durations was determined. Figure 4 shows a reconstituted
mass chromatogram for m/z values of 1225.3 and 1265.8,
corresponding to the +2 ion species of peptide fragment 5,
containing tyrosine 1N in its unphosphorylated and phos-
phorylated forms, respectively. As expected, the level of
phosphorylated peptide ÔproductÕ increases with time relat-
ive to the level of unphosphorylated ÔsubstrateÕ. Integrating
the area under each peak gives the total number of ions with
aparticularm/z value in each sample. To compare the levels
of phosphorylated and unphosphorylated tyrosine 1N from
one sample to the next, the levels of +2 and +3 ion species
of phosphorylated fragment 5 were expressed as a percent-
age of the combined ion count from both the phosphoryl-
ated and unphosphorylated forms of fragment 5 present in
that sample. The analysis was repeated for fragment 5–6, the
other high-yielding product of the (incomplete) trypsin
digest in which the only ITAM Tyr was 1N. This procedure
was performed for all of the other high-yielding products of
trypsin digestion that contained single ITAM tyrosines at
each time point. The level of phosphorylation was seen to
increase mainly over the first 30 min, with the levels of each
phosphotyrosine staying similar over the following 60 min.
The average levels of phosphorylation of each ITAM
tyrosine after 30 min of phosphorylation are presented in
Table 2. Tyrosine 1N is clearly the most highly phosphory-
lated tyrosine, being over 65% phosphorylated. The
remaining five ITAM tyrosines are phosphorylated to a
much lesser extent and at similar levels to one another
(13–21%). These data, obtained in the presence of a limited
supply of ATP, confirm that tyrosine 1N is indeed the first
tyrosine to be phosphorylated.
Discussion
We have used peptide ITAM mimics to show that the PTK
Lck phosphorylates the six ITAM tyrosines of TCRf with
different efficiencies. An investigation into the specificity of
the catalytic domain of PTK Lck using a peptide library
Table 2. Presence of phosphate on trypsin-generated peptide fragments
containing individual ITAM tyrosines from His-cTCRf phosphorylated
for 30–90 min. His-cTCRf was phosphorylated for between 0 and
90 min, then digested with trypsin to separate each ITAM tyrosine on
to a different fragment. The fragments, and their phosphorylation
statuses, were identified using HPLC-MS. The fragment numbers refer
to the fragments generated in a complete hypothetical digest of His-
cTCRf, starting with the N¢-terminal fragment, as shown in Fig. 1.
The ion count corresponding to m/z values of the M+2 and M+3
species of a specific phosphorylated peptide fragment were converted
into a percentage of the combined ion count for m/z values from both
the unphosphorylated and phosphorylated versions of the relevant
fragment. (The levels of +1 and +4 ion species were found to be
negligible.) The average percentage values obtained for samples that
have been incubated for between 30 and 90 min are given.
Phosphorylated
tyrosine
Fragment(s) of
His-cTCRf
Percentage of these fragments
found to be phosphorylated
after 30 min (± SD) n ¼ 3
1N 5 & 5–6 65.9 (± 7.6)
1C 6–8, 7–9 & 7–9 12.7 (± 2.8)
2N 12–14 & 12–15 19.9 (± 9.3)
2C 16–17 19.0 (± 9.3)
3N 21 & 20–21 21.0 (± 3.9)
3C 22 19.6 (± 8.3)
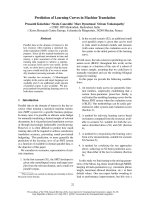
Fig. 4. LC-MS profiles showing increased
phosphorylation of His-cTCRf tyrosine 1N
with time of incubation with Lck. The levels of
fragment 5 (containing tyrosine 1N) detected
with and without phosphate, after 0, 5 and
30 min of incubation with Lck are displayed
above. Both the unmodified (U) and phos-
phorylated (P) versions of the fragment were
most commonly found as the M+2 ions
(with m/z values of 1225.3 and 1265.8,
respectively). These spectra are normalized
to 100% of the highest peak at each time
point, and show that the relative level of the
phosphorylated species increases over the
30 min of incubation.
2374 H. R. Housden et al.(Eur. J. Biochem. 270) Ó FEBS 2003
based on the sequence Met-Ala-x-x-x-x-Tyr-x-x-x-x-Ala-
Lys-Lys-Lys (where x is any of the 20 standard amino acids
except Ser, Thr, Tyr, Cys or Trp) found the kinase to exhibit
a preference for certain residues in the sites )3, )1and+1
to +4, relative to the tyrosine [25]. Particularly favoured
were bulky hydrophobic residues (Phe, Ile, Leu or Val) at
the Tyr )1 and Tyr +3 sites, and small residues (Gly or Ala)
in the Tyr +1 position. All six of the ITAM-located
tyrosines that we studied contain an optimal leucine residue
at position Tyr +3. Comparison of the sequence prefer-
ences with the other residues surrounding the six f ITAM
tyrosines reveals that those found to be most efficiently
phosphorylated, 1N and 3N, both contain an additional
match, having a leucine at the Tyr )1 position. Meanwhile,
the least efficiently phosphorylated tyrosine, 3N, has no
additional favoured residue matches. However, 2N, the only
f ITAM tyrosine to contain two additional matches, at
the )1and)3 positions, has an intermediate specificity
constant, which perhaps indicates that the effect of a
favourable residue at one position can be reduced when
certain other amino acids are nearby.
We believe that the 20-residue and 21-residue peptides
studied, each containing a single tyrosine, are good
representatives of the individual tyrosines on the larger,
multityrosine-containing TCRf chain because CD studies
[10] and our NMR data show that the cytosolic portion of
TCRf lacks classical secondary structure. Therefore it can
be concluded from these studies that Lck phosphorylates
TCRf in the order 1N (first) > 3N > 3C > 2N >
1C > 2C (last). Subsequent studies of recombinant
TCRf, using trypsin digestion followed by LC-MS to
identify the sites of in vitro phosphorylation by Lck,
confirmed tyrosine 1N to be the first phosphorylated.
Differences arising in the order of phosphorylation of the
subsequent tyrosines in the whole cTCRf chain in vitro,
relative to the single-tyrosine-containing peptides, may
well be due to the presence of an SH2 domain in Lck
which binds to phosphotyrosines in an ITAM context
with high affinity [26]. On binding of the SH2 domain of
Lck to a phosphorylated tyrosine in TCRf, an additional
steric factor may well be introduced to the observed
phosphorylation kinetics, as its site of binding on TCRf
may influence the ability of its catalytic domain to reach
the remaining unphosphorylated tyrosines of TCRf.
However, our studies using peptides containing single
tyrosines show that Lck is capable of phosphorylating all
six of the tyrosines without being tethered to the substrate
via such phosphotyrosine–SH2 domain interactions. It is
also possible that, although TCRf lacks classical secon-
dary structure, there may still be some steric restriction to
Lck accessing certain tyrosine residues of the protein
chain.
Our studies have determined the efficiency of phosphory-
lation of each of the six f ITAM tyrosines by PTK Lck,
from which we can deduce the order in which Lck should
perform the phosphorylations, in the absence of any other
influencing factors. To determine whether the order
observed in vivo is solely due to the differential phosphory-
lation kinetics of Lck for the individual tyrosines, our results
must be compared with previous reports of ordered
phosphorylation. Kersh et al. [9] used phosphotyrosine
antibodies, specific for the individual phosphotyrosines in
TCRf, to detect which tyrosines were phosphorylated in
response to partial and full agonist ligands in T-cell lines.
Their results suggested a different phosphorylation order
from that for Lck acting alone, starting with 2N (being
phosphorylated even in resting cells) then 3C, 1C, 1N, 2C
and lastly 3N (only phosphorylated in the presence of strong
agonist ligands). Both findings contrast with the results of
van Oers et al.[24],whousedHPLCandMStoidentify
phosphorylated tyrosines in the partially phosphorylated
p21 and more/fully phosphorylated p23 forms of f chain
purified from human thymus samples. They found that the
pair of tyrosines in ITAM1 (1N and 1C) were the least likely
to be phosphorylated. The differences between the observed
patterns of in vivo phosphorylation and our results show
that the phosphorylation status of ITAMs within the cell is
not only affected by Lck activity. Other important factors
present in vivo include the Src-family member PTK Fyn,
which can also phosphorylate TCRf [27], phosphatases [28],
proteins containing SH2 domain(s) such as ZAP-70 which
can bind to and stabilize certain phosphoforms of proteins
[24], and membrane lipids, which have been shown in vitro
to prevent phosphorylation when bound to cytosolic f [29].
Acknowledgements
We are indebted to the BBSRC for the studentship of H.R.H., also
sponsored by Celltech Group plc.
References
1. Baniyash, M., Garcia-Morales, P., Luong, E., Samelson, L.E. &
Klausner, R.D. (1988) The T-cell antigen receptor zeta chain is
tyrosine phosphorylated upon activation. J. Biol. Chem. 263,
18225–18230.
2. Straus, D.B. & Weiss, A. (1992) Genetic evidence for the
involvement of the Lck tyrosine kinase in signal transduction
through the T-cell antigen receptor. Cell 70, 585–593.
3. Reth, M. (1989) Antigen receptor tail clue. Nature (London) 338,
383–384.
4. Ravetch, J.V. & Kinet, J.P. (1991) Fc Receptors. Annu. Rev.
Immunol. 9, 457–492.
5. Pfefferkorn, L.C. & Yeaman, G.R. (1994) Association of IgA-Fc
receptor (FcaR) with FceRIc2 subunits in U937cells. Aggregation
induces the tyrosine phosphorylation of c2. J. Immunol. 153,
3228–3236.
6. Chan, A.C., Irving, B.A., Fraser, J.D. & Weiss, A. (1991) The zeta
chain is associated with a tyrosine kinase and upon T-cell antigen
receptor stimulation associates with ZAP-70, a 70kDa tyrosine
phosphoprotein. Proc. Natl Acad. Sci. USA 88, 9166–9170.
7. June, C.H., Fletcher, M.C., Ledbetter, J.A., Schieven, G.L., Siegel,
J.N., Phillips, A.F. & Samelson, L.E. (1990) Inhibition of tyrosine
phosphorylation prevents T-cell receptor-mediated signal trans-
duction. Proc. Natl Acad. Sci. USA 87, 7722–7726.
8. Sloan-Lancaster, J. & Allen, P.M. (1996) Altered peptide ligand-
induced partial T cell activation: molecular mechanisms and role
in T cell biology. Annu. Rev. Immunol. 14, 1–27.
9. Kersh, E.N., Shaw, A.S. & Allen, P.M. (1998) Fidelity of T cell
activation through multistep T cell receptor f phosphorylation.
Science 281, 572–575.
10. Weissenhorn, W., Eck, M.J., Harrison, S.C. & Wiley, D.C. (1996)
Phosphorylated T cell receptor f-chain and ZAP70 tandem SH2
domains form a 1 : 3 complex in vitro. Eur. J. Biochem. 238,
440–445.
11. Merrifield, B. (1986) Solid phase synthesis. Science 232, 341–347.
Ó FEBS 2003 Phosphorylation of the T-cell receptor f chain (Eur. J. Biochem. 270) 2375
12. Atherton, E. & Sheppard, R.C. (1989) Solid Phase Peptide
Synthesis: a Practical Approach.IRLPressatOxfordUniversity
Press, Oxford.
13. Gill, S.C. & von Hippel, P.H. (1989) Calculation of protein
extinction coefficients from amino acid sequence data. Anal.
Biochem. 182, 319–326.
14. Labadia, M.E., Ingraham, R.H., Schembri-King, J., Morelock,
M.M. & Jakes, S. (1996) Binding affinities of the SH2 domains of
ZAP-70, p
56
Lck and Shc to the f chain ITAMs of the T-cell
receptor determined by surface plasmon resonance. J. Leukoc.
Biol. 59, 740–746.
15. Grucza, R.A., Bradshaw, J.M., Mixaxov, V. & Waksman, G.
(2000) Role of electrostatic interactions in SH2 domain recogni-
tion: salt dependence of tyrosyl-phosphorylated peptide binding
to the tandem SH2 domain of the Syk kinase and the single
SH2 domain of the Src kinase. Biochemistry 39, 10072–10081.
16. Smith, D.B. & Johnson, K.S. (1988) Single-step purification of
polypeptides expressed in Escherichia coli as fusions with gluta-
thione S-transferase. Gene 67, 31–40.
17. Murphy, G., Cockett, M.I., Ward, R.V. & Docherty, A.J.P. (1991)
Matrix metalloproteinase degradation of elastin, type-IV collagen
and proteoglycan: a quantitative comparison of the activities of 95
kDa and 72 kDa gelatinases, stromelysin-1 and stromelysin-2 and
punctuated metalloproteinase (pump). Biochem. J. 277, 277–279.
18. Weissman, A.M., Hou, D., Orloff, D.G., Modi, W.S., Seuanez,
H., O’Brian, S.J. & Klausner, R.D. (1988) Molecular cloning and
chromosomal localization of the human T-cell receptor zeta chain:
distinction from the molecular CD3 complex. Proc. Natl Acad.
Sci. USA 85, 9709–9713.
19. Seethala, R. & Menzel, R. (1998) A fluorescence polarization
competition immunoassay for tyrosine kinases. Anal. Biochem.
255, 257–262.
20. Watts, J.D., Wilson, G.M., Ettehadieh, E., Clarke-Lewis, I.,
Kubanek, C.A., Astell, C.R., Marth, J.D. & Aebersold, R. (1992)
Purification and initial characterization of the lymphocyte-specific
protein tyrosyl kinase p56Lck from a baculovirus expression sys-
tem. J. Biol. Chem. 267, 901–907.
21. Feder, D. & Bishop, J.M. (1990) Purification and enzymatic
characterization of pp60c-src from human platelets. J. Biol. Chem.
265, 8205–8211.
22. Amrein, K.E., Takacs, B., Steiger, M., Molnos, J., Flint, N.A. &
Burn, P. (1995) Purification and characterization of recombinant
human p50
csk
protein tyrosine-kinase from an Escherichia coli
expression system overproducing the bacterial chaperone GroES
and GroEL. Proc. Natl Acad. Sci. USA 92, 1048–1052.
23. Vang, T., Tasken, K., Skalhegg, B.S., Hansson, V. & Levy, F.O.
(1998) Kinetic properties of the C-terminal Src kinase, p50
csk
.
Biochim. Biophys. Acta 1384, 285–293.
24. van Oers, N.S.C., Tohlen, B., Malissen, B., Moomaw, C.R.,
Afendis, S. & Slaughter, C.A. (2000) The 21- and 23-kD forms of
TCRZ. are generated by specific ITAM phosphorylations. Nat.
Immunol. 1, 322–328.
25. Songyang, Z., Carraway, K.L. III, Eck, M.J., Harrison, S.C.,
Feldman, R.A., Mohammadi, M., Schlessinger, J., Hubbard,
S.R., Smith, D.P., Eng, C., Lorenzo, M.J., Ponder, B.A.J., Mayer,
B.J. & Cantley, L.C. (1995) Catalytic specificity of phospho-
tyrosine kinases is critical for selective signalling. Nature (London)
373, 536–539.
26. Songyang, Z., Shoelson, S.E., Chaudhuri, M., Gish, G., Pawson,
T.,Haser,W.G.,King,F.,Roberts,T.,Ratnofsky,S.,Lechleider,
R.J., Neel, B.G., Birge, R.B., Fajardo, J.E., Chou, M.M., Hana-
fusa, H., Schaffhausen, B. & Cantley, L.C. (1993) SH2 domains
recognise specific phosphopeptide sequences. Cell 72, 767–778.
27. Hall, C.G., Sancho, J. & Terhorst, C. (1993) Reconstitution of T
cell receptor f-mediated calcium mobilisation in nonlymphoid
cells. Science 261, 915–918.
28. Hegedu
ˆ
s, Z., Chitu, V., Toth, G.K., Finta, C., Varadi, G., Ando, I.
& Monostori, E. (1999) Contribution of kinases and the CD45
phosphatase to the generation of tyrosine phosphorylation pat-
terns in the T-cell receptor complex zeta chain. Immunol. Lett. 67,
31–39.
29. Aivazian, D. & Stern, L.J. (2000) Phosphorylation of T cell
receptor f is regulated by a lipid dependent folding transition. Nat.
Struct. Biol. 7, 1023–2000.
2376 H. R. Housden et al.(Eur. J. Biochem. 270) Ó FEBS 2003