E-learning, experiences and future pptx
Bạn đang xem bản rút gọn của tài liệu. Xem và tải ngay bản đầy đủ của tài liệu tại đây (23.34 MB, 460 trang )
I
E-learning, experiences and future
E-learning, experiences and future
Edited by
Safeeullah Soomro
In-Tech
intechweb.org
Published by In-Teh
In-Teh
Olajnica 19/2, 32000 Vukovar, Croatia
Abstracting and non-prot use of the material is permitted with credit to the source. Statements and
opinions expressed in the chapters are these of the individual contributors and not necessarily those of
the editors or publisher. No responsibility is accepted for the accuracy of information contained in the
published articles. Publisher assumes no responsibility liability for any damage or injury to persons or
property arising out of the use of any materials, instructions, methods or ideas contained inside. After
this work has been published by the In-Teh, authors have the right to republish it, in whole or part, in any
publication of which they are an author or editor, and the make other personal use of the work.
© 2010 In-teh
www.intechweb.org
Additional copies can be obtained from:
First published April 2010
Printed in India
Technical Editor: Maja Jakobovic
Cover designed by Dino Smrekar
E-learning, experiences and future,
Edited by Safeeullah Soomro
p. cm.
ISBN 978-953-307-092-6
V
Preface
Basically e-learning is new way of providing knowledge to peoples to interact with web
based systems which is need of current world. E-learning based systems received tremendous
popularity in the world since this decade. Currently most of the universities are using e-bases
systems to provide interactive systems to students which can make communication fast to
grow up the knowledge in every eld of study. Many advantages comes to adopt e-learning
systems like paper less environment, pay less to instructors, students can access systems from
any part of world, advanced computer trainings provided at homes and access any material
using web. In advanced countries e-learning systems play major role in an economy to
produce productive output in the industries without having paid huge amount for personal
staff that are locating physically and also provide big advantage to peoples of developed
countries who can not attend physically courses neither afford experts in a professional elds.
This is big achievement of e-learning bases systems to promote education online.
This book is consisting of 24 chapters which are focusing on the basic and applied research
regarding elearning systems. Authors made efforts to provide theoretical as well as practical
approaches to solve open problems through their elite research work. This book increases
knowledge in the following topics such as e-learning, e-Government, Data mining in e-learning
based systems, LMS systems, security in elearning based systems, surveys regarding teachers
to use e-learning systems, analysis of intelligent agents using e-learning, assessment methods
for e-learning and barriers to use of effective e-learning systems in education.
Basically this book is an open platform for creative discussion for future e-learning based
systems which are essential to understand for the students, researchers, academic personals
and industry related people to enhance their capabilities to capture new ideas and provides
valuable solution to an international community.
The editor and authors of this book hope that this book will provide valuable platform for
the new researchers and students who are interested to carry research in the e-learning based
systems. Finally we are thankful to I-Tech Education and publishing organization which
provides the best platform to integrate researchers of whole world though this published
book.
Dr. Safeeullah Soomro
Yanbu University College,
Kingdom of Saudi Arabia
VI
VII
Contents
Preface V
1. E-LearningIndicators:AMultidimensionalModelForPlanning
DevelopingAndEvaluatingE-LearningSoftwareSolutions 001
BekimFetajiandMajlindaFetaji
2. BarrierstoEffectiveuseofInformationTechnologyinScience
EducationatYanbuKingdomofSaudiArabia 035
AbdulkaremEidS.Al-AlwaniandSafeeullahSoomro
3. TheUseofMulti-Agents’Systemsine-LearningPlatforms 047
TomaszMarcinOrzechowski
4. QualityMetricsofanIntegratedE-LearningSystem–
students’perspective 071
KsenijaKlasnić,JadrankaLasić-LazićandSanjaSeljan
5. IntelligentInteractionSupportfore-Learning 095
TakashiYukawaandYoshimiFukumura
6. SupportingTechnologiesforSynchronousE-learning 111
JuanC.Granda,ChristianUría,FranciscoJ.SuárezandDanielF.García
7. BayesianAgentine-Learning 129
MaomiUeno
8. DataMiningforInstructionalDesign,LearningandAssessment 147
LluísVicentandXavierGumara
9. Alearningstyle–drivenarchitecturebuildonopensourceLMS’s
infrastructureforcreationofpsycho-pedagogically–‘savvy’
personalizedlearningpaths 163
KerkiriAl.Tania,PaleologouAngela-M.,
KonetasDimitrisandChatzinikolaouKostantinos
10. E-learningininformationaccessibilityofdisabledassistanttechnology 189
ChunlianLi,Yusun
VIII
11. ApplicationofData-MiningTechnologyonE-LearningMaterial
Recommendation 213
Feng-JungLiuandBai-JiunShih
12. Loosely-TiedDistributedArchitectureforHighlyScalable
E-LearningSystem 229
GierłowskiandNowicki
13. EvolutionofCollaborativeLearningEnvironmentsbased
onDesktopComputertoMobileComputing:AModel-BasedApproach 261
AnaI.Molina,WilliamJ.Giraldo,FranciscoJurado,
MiguelA.RedondoandManuelOrtega
14. Fromthediscoveryofstudentsaccesspatternsine-learning
includingweb2.0resourcestothepredictionandenhancement
ofstudentsoutcome 275
RaquelHijón-NeiraandÁngelVelázquez-Iturbide
15. Dependablee-learningsystems 295
AliAl-Dahoud,MarekWodaandTomaszWalkowiak
16. Ontology-drivenAnnotationandAccessofEducationalVideo
DatainE-learning 305
AijuanDong,HonglinLiandBaoyingWang
17. Whenarobotturnsintoatotem:TheRoboBeggarcase 327
GaetanoLaRussa,ErkkiSutinenandJohannesC.Cronje
18. Virtualpatientsasapracticalrealisationofthee-learningidea
inmedicine 345
AndrzejA.KononowiczandIngaHege
19. DataWarehouseTechnologyandApplicationinDataCentreDesign
forE-government 371
XuanziHu
20. TheEmergenceoftheIntelligentGovernmentintheSecondSociety 385
DennisdeKoolandJohanvanWamelen
21. ALightweightSOA-basedCollaborationFrameworkforEuropean
PublicSector 397
AdomasSvirskas,JelenaIsačenkovaandRekMolva
22. SpatialAidedDecision-makingSystemforE-Government 413
LiangWANG,RongZHAO,BinLI,JipingLIUandQingpuZHANG
23. EvaluatingLocalE-Government:AComparativeStudyofGreekPrefecture
Websites 441
ProdromosYannasandGeorgiosLappas
E-LearningIndicators:AMultidimensionalModel
ForPlanningDevelopingAndEvaluatingE-LearningSoftwareSolutions 1
E-LearningIndicators:AMultidimensionalModelForPlanningDeveloping
AndEvaluatingE-LearningSoftwareSolutions
BekimFetajiandMajlindaFetaji
X
E-Learning Indicators: A Multidimensional
Model For Planning Developing And Evaluating
E-Learning Software Solutions
1
Bekim Fetaji and
2
Majlinda Fetaji
1, 2
South East European University, (Computer Sciences Faculty)
Macedonia
1. Introduction
Many current e-learning initiatives follow the “one-size-fits-all” approach just offering some
type of Learning Management System (LMS) to learners or Learning Content Management
System (LCMS). Typically, this approach is related to lack of knowledge of the learner
audience or factors influencing that audience and e-learning project overall and therefore
fail to provide satisfactory support in the decision making process (Fetaji, 2007a).
In order to address this issue, an approach dealing with e-learning indicators is proposed,
assessed, measured and evaluated. The proposed E-learning Indicators Methodology
enables successful planning, comparison and evaluation of different e-learning projects. It
represents an empirical methodology that gives concrete results expressed through numbers
that could be analysed and later used to compare and conclude its e-learning efficiency.
With the application of this methodology in e-learning projects it is more likely to achieve
better results and higher efficiency as well as higher Return on Investment ROI.
The purpose of e-learning indicators was to raise the awareness of the factors influencing e-
learning project in order to identify the nature of obstacles being faced by e-learners. This
research argues that if such obstacles could be recognized early in the process of planning
and development of e-learning initiatives then the actions that remedy the obstacles can be
taken on time. We believe that the absence of appropriate on-time actions is one of the main
reasons for the current unsatisfactory results in many e-learning projects.
The e-learning indicators approach is a multidimensional model used in planning,
developing, evaluating, and improving an e-learning initiative. Thus, the model comprises
e-learning projects as iterative development processes where at each iteration step
appropriate actions to improve the initiative outcomes can be taken. The iteration steps of
this development process include:
Planning phase with the initial measurement of e-learning indicators. The obtained
results influence all the other phases.
Design phase where (group or so called “collective”) personalisation issues and
pedagogical and instructional techniques and aspects are addressed.
1
E-learning,experiencesandfuture2
Implementation phase where a number of e-learning experiments are conducted
based on the results from the previous phases.
Evaluation phase to obtain precise results of the initiative outcomes.
Analysis phase where guidelines and recommendations are written down.
The proposed model defines 18 indicators that were practically applied in a number of case
studies including their application with Angel LMS and a number of self developed and
implemented e-learning interactive tools.
E-learning indicators have been defined with help of different focus groups, realised
literature review and a web based survey of academic staff and students in the framework
of South East European University. In addition, the approach was revised closely with
experts in the field during participation in several research projects (mentioned in
acknowledgement).
The experiences from these projects show that a more successful e-learning is not possible
only if a generic approach or generic guidelines for the learners are applied. Rather,
individual learning services are needed in supporting learners according to their personal
preference profile.
However, although not the focus of the research because of the interconnection with the
above identified issues several projects and research initiatives that deal with
personalization have been shortly reviewed. The reviewed projects are the OPen Adaptive
Learning Environment (OPAL), (Dagger, et al 2002) and ADELE-Adaptive e-Learning with
Eye Tracking (Mödritscher, et al 2006). The OPAL research shows personalization as
difficult to achieve and “… are often expensive, both from a time and financial perspective,
to develop and maintain.” (Dagger, et al 2002). Therefore, a conclusion is drown that learner
personalisation should not bee addressed at to finely grained level. Typically,
personalisation at that starting level is not practical based on the findings of OPAL project
(Dagger, et al 2002) and since it has too include all of those learners preferences that change
each time the learner uses the system clearly does not represent a constant factor that can be
addressed (Fetaji, 2007g). Instead, a recommendation is to use the defined approach with e-
learning indicators as starting point when developing an e-learning initiative. Then after the
measurements the learners are divided into groups so called ”collectives” (in Universities
these are the departmental levels) were personalisation is offered to the specifics of the
collectives majority primarily based on learning style categorization and type of learner
they are (indicator 4, 4). We have adopted the Felder-Silverman model for learning style
categorization (Felder, 1993). After that learner personalisation can be designed and offered
tailored to each collective (Fetaji, 2007g). Furthermore, based on the measurements of these
e-learning indicators a design of a sustainable e-learning initiative can be supported. Each e-
learning initiative is unique and involves specifics that can not be taken under consideration
in the form of “one-size-fits-all” solution.
However evaluating e-learning indicators in the planning phase is only the first step in more
successful e-learning. E-learning indicators can be used in other phases as well in particular
in evaluating different e-learning initiatives in conjunction with ELUAT methodology to
assess e-learning effectiveness. Comparison of different projects can be realised comparing
e-learning indicators measurements in conjunction with the evaluated e-learning
effectiveness (how effective they have shown measured using the ELUAT methodology)
(Fetaji, 2007g).
2. E-Learning Indicators Methodology
E-learning indicators are defined as the important concepts and factors that are used to
communicate information about the level of e-learning and used to make management
decisions when planning an e-learning strategy for an institution or University according to
the study of (Fetaji et al 2007a). The purpose was to raise the awareness of the factors and
concepts influencing e-learning in order to enhance learning and identify the nature of
obstacles being faced by e-learners and therefore proposed is a methodological approach in
developing any e-learning initiative. Because there are too many factors, personalization and
specifics related to each situation and circumstances it is considered that would be wrong
offering one size solution for all.
It is of great importance to have standardised guide of e-learning indicators accepted by
scientific community to be able to compare and to evaluate the different initiatives
regarding e-learning in a standardised manner.
In order to define and assess the e-learning indicators the data have been gathered from
interviews with e-learning specialists, 2 focus groups (one student and one instructors), web
based survey of academic staff and students and literature review of similar previous
research work found at (Bonk, 2004). The web based survey was realised through
questionnaire that was developed in three cycles. In the first cycle the questions were
developed based on the e-learning indicators. For most of the e-learning indicators there
was just one question to cover it, while for some 2 (two) or more questions. At the beginning
developed were more questions but after thorough consultations with survey experts
shortened and come up with 23 questions. In the second cycle the developed survey
questionnaire was tested on a 2 different focus groups. One group consisting of students
and the other group from instructors. After analyses of the survey data they were presented
to the focus groups and confronted to them how much do they agree and consider this
results as realistic and accurate. The initial response was that although the survey captures
in substantial level the real situation there were a lot of discussions especially on the student
focus group regarding the appropriateness of the survey questions. In discussion with both
of the focus groups most of the questions have changed according to the discussions and
proposals of the group. In the third cycle both of the focus group were filled the new survey
and after the survey data were given to them both of the focus groups agreed that it really
gives an accurate clear picture of the participants.
The survey was designed following the rule of thumb for all communications: Audience +
Purpose = Design. This survey was divided into 18 (eighteen) sections to cover al the e-
learning indicators previously defined and had 23 (twenty three) questions in total. It was
communicated to the participants and provided as link in the message board of the eservice
system of the University.
As e-learning indicators defined are: (1) learner education background; (2) computing skills
level (3) type of learners they are, (4) their learning style and multiple intelligence, (5)
obstacles they face in e-learning (e-learning barriers), (6) attention, (7) content (suitability,
format preferences), (8) instructional design, (9) organizational specifics, (10) preferences of
e-learning logistics; (11) preferences of e-learning design; (12) technical capabilities available
to respondents; (13) collaboration; (14) accessibility available to respondents; (15)
motivation, (16) attitudes and interest; and (17) performance-self-efficacy (the learner sense
their effectiveness in e-learning environment); (18) learning outcomes. Recommendation is
to use the defined e-learning indicators as starting point when developing e-learning
E-LearningIndicators:AMultidimensionalModel
ForPlanningDevelopingAndEvaluatingE-LearningSoftwareSolutions 3
Implementation phase where a number of e-learning experiments are conducted
based on the results from the previous phases.
Evaluation phase to obtain precise results of the initiative outcomes.
Analysis phase where guidelines and recommendations are written down.
The proposed model defines 18 indicators that were practically applied in a number of case
studies including their application with Angel LMS and a number of self developed and
implemented e-learning interactive tools.
E-learning indicators have been defined with help of different focus groups, realised
literature review and a web based survey of academic staff and students in the framework
of South East European University. In addition, the approach was revised closely with
experts in the field during participation in several research projects (mentioned in
acknowledgement).
The experiences from these projects show that a more successful e-learning is not possible
only if a generic approach or generic guidelines for the learners are applied. Rather,
individual learning services are needed in supporting learners according to their personal
preference profile.
However, although not the focus of the research because of the interconnection with the
above identified issues several projects and research initiatives that deal with
personalization have been shortly reviewed. The reviewed projects are the OPen Adaptive
Learning Environment (OPAL), (Dagger, et al 2002) and ADELE-Adaptive e-Learning with
Eye Tracking (Mödritscher, et al 2006). The OPAL research shows personalization as
difficult to achieve and “… are often expensive, both from a time and financial perspective,
to develop and maintain.” (Dagger, et al 2002). Therefore, a conclusion is drown that learner
personalisation should not bee addressed at to finely grained level. Typically,
personalisation at that starting level is not practical based on the findings of OPAL project
(Dagger, et al 2002) and since it has too include all of those learners preferences that change
each time the learner uses the system clearly does not represent a constant factor that can be
addressed (Fetaji, 2007g). Instead, a recommendation is to use the defined approach with e-
learning indicators as starting point when developing an e-learning initiative. Then after the
measurements the learners are divided into groups so called ”collectives” (in Universities
these are the departmental levels) were personalisation is offered to the specifics of the
collectives majority primarily based on learning style categorization and type of learner
they are (indicator 4, 4). We have adopted the Felder-Silverman model for learning style
categorization (Felder, 1993). After that learner personalisation can be designed and offered
tailored to each collective (Fetaji, 2007g). Furthermore, based on the measurements of these
e-learning indicators a design of a sustainable e-learning initiative can be supported. Each e-
learning initiative is unique and involves specifics that can not be taken under consideration
in the form of “one-size-fits-all” solution.
However evaluating e-learning indicators in the planning phase is only the first step in more
successful e-learning. E-learning indicators can be used in other phases as well in particular
in evaluating different e-learning initiatives in conjunction with ELUAT methodology to
assess e-learning effectiveness. Comparison of different projects can be realised comparing
e-learning indicators measurements in conjunction with the evaluated e-learning
effectiveness (how effective they have shown measured using the ELUAT methodology)
(Fetaji, 2007g).
2. E-Learning Indicators Methodology
E-learning indicators are defined as the important concepts and factors that are used to
communicate information about the level of e-learning and used to make management
decisions when planning an e-learning strategy for an institution or University according to
the study of (Fetaji et al 2007a). The purpose was to raise the awareness of the factors and
concepts influencing e-learning in order to enhance learning and identify the nature of
obstacles being faced by e-learners and therefore proposed is a methodological approach in
developing any e-learning initiative. Because there are too many factors, personalization and
specifics related to each situation and circumstances it is considered that would be wrong
offering one size solution for all.
It is of great importance to have standardised guide of e-learning indicators accepted by
scientific community to be able to compare and to evaluate the different initiatives
regarding e-learning in a standardised manner.
In order to define and assess the e-learning indicators the data have been gathered from
interviews with e-learning specialists, 2 focus groups (one student and one instructors), web
based survey of academic staff and students and literature review of similar previous
research work found at (Bonk, 2004). The web based survey was realised through
questionnaire that was developed in three cycles. In the first cycle the questions were
developed based on the e-learning indicators. For most of the e-learning indicators there
was just one question to cover it, while for some 2 (two) or more questions. At the beginning
developed were more questions but after thorough consultations with survey experts
shortened and come up with 23 questions. In the second cycle the developed survey
questionnaire was tested on a 2 different focus groups. One group consisting of students
and the other group from instructors. After analyses of the survey data they were presented
to the focus groups and confronted to them how much do they agree and consider this
results as realistic and accurate. The initial response was that although the survey captures
in substantial level the real situation there were a lot of discussions especially on the student
focus group regarding the appropriateness of the survey questions. In discussion with both
of the focus groups most of the questions have changed according to the discussions and
proposals of the group. In the third cycle both of the focus group were filled the new survey
and after the survey data were given to them both of the focus groups agreed that it really
gives an accurate clear picture of the participants.
The survey was designed following the rule of thumb for all communications: Audience +
Purpose = Design. This survey was divided into 18 (eighteen) sections to cover al the e-
learning indicators previously defined and had 23 (twenty three) questions in total. It was
communicated to the participants and provided as link in the message board of the eservice
system of the University.
As e-learning indicators defined are: (1) learner education background; (2) computing skills
level (3) type of learners they are, (4) their learning style and multiple intelligence, (5)
obstacles they face in e-learning (e-learning barriers), (6) attention, (7) content (suitability,
format preferences), (8) instructional design, (9) organizational specifics, (10) preferences of
e-learning logistics; (11) preferences of e-learning design; (12) technical capabilities available
to respondents; (13) collaboration; (14) accessibility available to respondents; (15)
motivation, (16) attitudes and interest; and (17) performance-self-efficacy (the learner sense
their effectiveness in e-learning environment); (18) learning outcomes. Recommendation is
to use the defined e-learning indicators as starting point when developing e-learning
E-learning,experiencesandfuture4
initiative and based on the measurements of these e-learning indicators to tailor the specifics
of e-learning. Each e-learning initiative should measure the provided indicators and based
on them to design and build their e-learning sustainability.
3. Research Methodology
The research methodology used was a combination of qualitative and quantitative research
as well as comparative analyses of factors influencing e-learning. Background research
consisted of an in depth literature review of e-learning. The background research consisted
of analyses of e-learning trends, e-learning technologies and solutions, e-learning standards,
learning theories, concepts and factors that influence e-learning. Then grounded theory
research was realised through exploratory research to determine the best research design
and then constructive research was undertaken to build the software solution followed by
empirical research to describe accurately the interaction between the learners and the system
being observed. The data for this research was gathered from research interviews with e-
learning specialists and participants, focus group and a web based survey as well as printed
hard copy survey of academic staff and students.
In order to develop a systematic methodology, either substantive or formal, about
improving and enhancing e-learning by addressing the deficiencies from the findings and in
this manner to contribute in enhancing e-learning effectiveness. In order to achieve this, the
following research objectives have been tried to be addressed:
Review key authoritative literature on e-learning trends, e-learning standards,
technologies and e-learning systems provided as e-learning solutions, and
evaluation of e-learning effectiveness in order to provide a thorough
understanding of e-learning in general and associated knowledge dissemination.
Discuss the advantages and disadvantages of different approaches to e-learning
solutions.
Analyses of different e-learning environments and solutions
Asses, measure and evaluate concepts and factors influencing e-learning defined as
e-learning indicators
Design, develop and conduct experiments in order to asses the best modelling
approach to developing e-learning software solutions
Connect e-learning indicators with each e-learning software solution approach and
learning theory and design
Analyse and discuss the data gathered from the experiments
Conclude and deliver recommendations for enhanced learning and future
improvements.
Key variables and themes that have been studied are: students needs analyses, usage
environment feasibility analyses, e-learning indicators, e-content and learning processes
issues, feasibility analyses of authoring issues, assessment of e-learning effectiveness, and
discussion of the purpose and evaluation of results of the research and proposed
recommendations for e-content and e-learning processes issues, applications specifics and
requirements in correlation with the environment and situation of the Communication
Sciences and Technologies Faculty at south East European University, accessibility and
learning specifics based on learners needs, deployment, testing and evaluation of the
solution.
Interviewed and realised direct observation of students as program implementation case
study for the three subjects: Advanced Elective course “Object Oriented Programming in
Java” and the two core courses “Software Engineering” and “Algorithms and Data
Structures”. There implemented the solutions proposed under the part of the research study
on e-content issues and e-learning processes.
Developed is a novel e-learning indicators-(ELI) model to be used for developing
information retrieval courseware’s by concentrating on previously assessed e-learning
indicators. Secondly, the research is conveying the need for close correlation of software
development and e-learning pedagogy. Recommend that technology should adapt to
theories of learning and e-learning indicators assessed earlier. This process modelling based
on e-learning indicators should be used as guidelines in similar developments.
A pilot study was conducted on e-learning interactive courseware applying network
analyses method in order to find the critical activities and assess the risks. The main focus
and aim of research was set on software development proposed and based upon the e-
learning indicators and the design of the courseware in compliance with theories of learning
and didactical pedagogical approach. For the assessment of e-learning effectiveness
proposed a methodology, called ELUAT (E-learning Usability Attributes Testing), for which
developed an inspection technique the Predefined Evaluation Tasks (PET), which describe
the activities to be performed during inspection in the form of a predefined tasks, measuring
previously assessed usability attributes.
4. The Experiments
In order to investigate the implementation strategy and try to address the above identified
issues 7 (seven) experimental case studies were developed and evaluated.
The experiments have been separated in 3 (three) groups based on their research nature and
investigation focus. The first 2 (two) experiments concentrate on e-learning indicators and
their usage in planning as well as evaluating e-learning projects. In the next 4 (four)
experiments various e-learning software solutions as interactive tools are designed and
developed in order to test several hypotheses as well as to investigate the new e-learning
indicators methodology approach in developing e-learning software solutions and at the
same time to investigate instructional strategies discussed and reviewed earlier. The final
experiment is devised in order to investigate and analyse the e-content and attention
correlation and conjunction in the e-learning process. Each case study experiment is tailored
based on the information collected in the first step, evaluated e-learning indicators.
The technological part of the research involved analyses of software engineering issues in
designing e-learning environments. Proposed is ELI (E-Learning Indicators) model - as
methodology for developing e-learning software solutions (Fetaji, 2007e).
Further, the experiments also investigated applications of different instructional techniques
and pedagogical learning models and how they are reflected in the software development
process according to different devised scenarios in supporting instructional strategy. An
analysis of Project, Problem, Inquiry-based and Task based learning instructional techniques
and their appropriateness for different scenarios was realized. In the final step, each
experiment and its underlying pedagogical model was once more evaluated using the
evaluation methodology developed for this purpose. The developed methodology is called
ELUAT (E-Learning Usability Attributes Testing) through the PET (Predefined Evaluation
E-LearningIndicators:AMultidimensionalModel
ForPlanningDevelopingAndEvaluatingE-LearningSoftwareSolutions 5
initiative and based on the measurements of these e-learning indicators to tailor the specifics
of e-learning. Each e-learning initiative should measure the provided indicators and based
on them to design and build their e-learning sustainability.
3. Research Methodology
The research methodology used was a combination of qualitative and quantitative research
as well as comparative analyses of factors influencing e-learning. Background research
consisted of an in depth literature review of e-learning. The background research consisted
of analyses of e-learning trends, e-learning technologies and solutions, e-learning standards,
learning theories, concepts and factors that influence e-learning. Then grounded theory
research was realised through exploratory research to determine the best research design
and then constructive research was undertaken to build the software solution followed by
empirical research to describe accurately the interaction between the learners and the system
being observed. The data for this research was gathered from research interviews with e-
learning specialists and participants, focus group and a web based survey as well as printed
hard copy survey of academic staff and students.
In order to develop a systematic methodology, either substantive or formal, about
improving and enhancing e-learning by addressing the deficiencies from the findings and in
this manner to contribute in enhancing e-learning effectiveness. In order to achieve this, the
following research objectives have been tried to be addressed:
Review key authoritative literature on e-learning trends, e-learning standards,
technologies and e-learning systems provided as e-learning solutions, and
evaluation of e-learning effectiveness in order to provide a thorough
understanding of e-learning in general and associated knowledge dissemination.
Discuss the advantages and disadvantages of different approaches to e-learning
solutions.
Analyses of different e-learning environments and solutions
Asses, measure and evaluate concepts and factors influencing e-learning defined as
e-learning indicators
Design, develop and conduct experiments in order to asses the best modelling
approach to developing e-learning software solutions
Connect e-learning indicators with each e-learning software solution approach and
learning theory and design
Analyse and discuss the data gathered from the experiments
Conclude and deliver recommendations for enhanced learning and future
improvements.
Key variables and themes that have been studied are: students needs analyses, usage
environment feasibility analyses, e-learning indicators, e-content and learning processes
issues, feasibility analyses of authoring issues, assessment of e-learning effectiveness, and
discussion of the purpose and evaluation of results of the research and proposed
recommendations for e-content and e-learning processes issues, applications specifics and
requirements in correlation with the environment and situation of the Communication
Sciences and Technologies Faculty at south East European University, accessibility and
learning specifics based on learners needs, deployment, testing and evaluation of the
solution.
Interviewed and realised direct observation of students as program implementation case
study for the three subjects: Advanced Elective course “Object Oriented Programming in
Java” and the two core courses “Software Engineering” and “Algorithms and Data
Structures”. There implemented the solutions proposed under the part of the research study
on e-content issues and e-learning processes.
Developed is a novel e-learning indicators-(ELI) model to be used for developing
information retrieval courseware’s by concentrating on previously assessed e-learning
indicators. Secondly, the research is conveying the need for close correlation of software
development and e-learning pedagogy. Recommend that technology should adapt to
theories of learning and e-learning indicators assessed earlier. This process modelling based
on e-learning indicators should be used as guidelines in similar developments.
A pilot study was conducted on e-learning interactive courseware applying network
analyses method in order to find the critical activities and assess the risks. The main focus
and aim of research was set on software development proposed and based upon the e-
learning indicators and the design of the courseware in compliance with theories of learning
and didactical pedagogical approach. For the assessment of e-learning effectiveness
proposed a methodology, called ELUAT (E-learning Usability Attributes Testing), for which
developed an inspection technique the Predefined Evaluation Tasks (PET), which describe
the activities to be performed during inspection in the form of a predefined tasks, measuring
previously assessed usability attributes.
4. The Experiments
In order to investigate the implementation strategy and try to address the above identified
issues 7 (seven) experimental case studies were developed and evaluated.
The experiments have been separated in 3 (three) groups based on their research nature and
investigation focus. The first 2 (two) experiments concentrate on e-learning indicators and
their usage in planning as well as evaluating e-learning projects. In the next 4 (four)
experiments various e-learning software solutions as interactive tools are designed and
developed in order to test several hypotheses as well as to investigate the new e-learning
indicators methodology approach in developing e-learning software solutions and at the
same time to investigate instructional strategies discussed and reviewed earlier. The final
experiment is devised in order to investigate and analyse the e-content and attention
correlation and conjunction in the e-learning process. Each case study experiment is tailored
based on the information collected in the first step, evaluated e-learning indicators.
The technological part of the research involved analyses of software engineering issues in
designing e-learning environments. Proposed is ELI (E-Learning Indicators) model - as
methodology for developing e-learning software solutions (Fetaji, 2007e).
Further, the experiments also investigated applications of different instructional techniques
and pedagogical learning models and how they are reflected in the software development
process according to different devised scenarios in supporting instructional strategy. An
analysis of Project, Problem, Inquiry-based and Task based learning instructional techniques
and their appropriateness for different scenarios was realized. In the final step, each
experiment and its underlying pedagogical model was once more evaluated using the
evaluation methodology developed for this purpose. The developed methodology is called
ELUAT (E-Learning Usability Attributes Testing) through the PET (Predefined Evaluation
E-learning,experiencesandfuture6
Tasks) inspection technique (Fetaji, 2007c). The developed 4 (four) e-learning software
solutions as case study experiments were created under two research projects realised in a
time framework of more than two years and later evaluated:
Intranet Gateway research project and
E-Learning Framework research project,
The e-learning software solutions developed for the needs of the experiments are:
XHTML and XML e-learning Interactive tool,
E-learning interactive mathematical tool,
Information Retrieval Courseware system-Intranet Gateway.
Online Dictionary of Computer Science terms and nomenclatures.
The results of this research show that e-learning indicators approach is of primary
importance (Fetaji, 2007e). Having a standardised set of e-learning indicators accepted by
scientific community enables comparison and evaluation of different e-learning initiatives
and their e-learning projects in a systematic manner. Moreover this approach combined
with experimental approach to e-learning brings new insights into the specifics of e-learning
that might help in increasing the learning outcomes, especially knowledge transfer.
Therefore, conclusion is that no new systems are needed but a series of experiments has to
be conducted to see what does and does not work in a particular situation and to provide
guidelines and recommendations for that situation.
Furthermore, an investigation of issues in authoring e-learning content (e-content) was
realised. The main purpose was to effectively identify the vehicles into increased knowledge
dissemination and efficient knowledge transfer and thus improve the overall e-learning
process. Preparing quality e-content delivered digitally is probably the major aspect for
long term success of any e-learning endeavour. It is the content, however, that learners care
for and judge how much they learn from it. Therefore we have identified and addressed
most important authoring issues by analyzing different courses using an Learning
Management System.
5. Data Collection and Analysis
Depending from the Software Lifecycle used for each e-learning software solutions
developed in particular for the given experiment used is the ELUAT methodology and PET
testing as described thoroughly at (Fetaji et al 2007a). Questionnaires, surveys, focus groups,
usability testing and other software testing groups were used. Groups of students filled out
different surveys discussing e-learning indicators, barriers to distance education and
usability surveys of e-learning software solutions modelled and developed. The return rate
for the surveys for each experiment was different and the highest was for distance education
with 64.89 %, (The distance education program at the moment has 81undergraduate full
time students, and 13 part time students, or in totals 94 students) while for the e-learning
indicators the response rate was 9.7 % (There were in total 701 student surveys filled. The
University at the moment of the research survey has 6.386 undergraduate and 188
postgraduate full time students, and 643 part time students, or in total 7217 students). The
majority of the participants (63.8%) have used the e-learning software solutions discussed.
Ten percent of the participants took fewer than all of the courses mentioned previously since
Object Oriented Programming in Java was an elective subject. Large amount of data was
collected and used from the literature reviews and inputs from other related projects.
Several statistical procedures were conduct for data analysis. First, the zero-order
correlations were computed among all variables. The aim of this operation is to have an
initial test of whether there were relationships among the variables. The interaction of
technology with teaching or social presence was considered if including those items would
increase the power of the regression model substantially. The standard multiprogression
procedures were conducted with course subjective satisfaction through the perceived
learning outcome, learning engagement assessed through time to learn and time of
performance as dependent variables. All assumptions of normality, usability, of residuals
were checked in those regression analyses. In order to handle those data the triangulation
technique from Dumas and Redish (1999) was used, were we look at all data at the same
time to see how the different data supports each other.
6. E-Learning Indicators Specification and Analyses
(1) Learner education background together with his cultural background is set as indicator
since it is a direct factor that is associated and impacts e-learning. According to Gatling et al,
(2005), students today come from a variety of cultural backgrounds and educational
experiences outside of the traditional classroom. How do students construct meaning from
prior knowledge and connect it with the new experiences? Based on this facts and
interviews with e-learning specialist It was set it as important indicator.
(2) Computing skills level of the learner is set as indicator since it directly influences the way e-
learning is conducted with the use of Information and communication technologies (ICT) and
use of computers and the computing skills requirements are essential in learning. “As we
move toward the 21st century, anyone who is not “computer literate” will find themselves at a
disadvantage when competing in the job market.” (Johnson, Gatling, Hill, 1997).
The indicator (3) type of learners they are depends primarily on the balance in the two
dimensions of the Learning Style scale model formulated by Richard M. Felder and Linda K.
Silverman of North Carolina State University according to Felder & Soloman (n.d) based on
four dimensions (active/reflective, sensing/intuitive, visual/verbal, and sequential/global).
According to Felder & Soloman (n.d) “students preferentially take in and process
information in different ways: by seeing and hearing, reflecting and acting, reasoning
logically and intuitively, analyzing and visualizing, steadily and in fits and starts. Teaching
methods also vary. Some instructors lecture, others demonstrate or lead students to self-
discovery; some focus on principles and others on applications; some emphasize memory
and others understanding. Active learners tend to retain and understand information best
by doing something active with it, discussing or applying it or explaining it to others.
Reflective learners prefer to think about it quietly first. Sensing learners tend to like
learning facts; intuitive learners often prefer discovering possibilities and relationships.
Visual learners remember best what they see: pictures, diagrams, flow charts, time lines,
films, and demonstrations. Verbal learners get more out of word, written and spoken
explanations. Sequential learners tend to gain understanding in linear steps, with each step
following logically from the previous one. Global learners tend to learn in large jumps,
absorbing material almost randomly without seeing connections, and then suddenly getting
it”. Therefore assessing and knowing the learning audience is crucial in order to know
whom to support and there is an extensive need for this input data in order for the e-
learning initiative to be successful and effective. Then after the measurements the learners
E-LearningIndicators:AMultidimensionalModel
ForPlanningDevelopingAndEvaluatingE-LearningSoftwareSolutions 7
Tasks) inspection technique (Fetaji, 2007c). The developed 4 (four) e-learning software
solutions as case study experiments were created under two research projects realised in a
time framework of more than two years and later evaluated:
Intranet Gateway research project and
E-Learning Framework research project,
The e-learning software solutions developed for the needs of the experiments are:
XHTML and XML e-learning Interactive tool,
E-learning interactive mathematical tool,
Information Retrieval Courseware system-Intranet Gateway.
Online Dictionary of Computer Science terms and nomenclatures.
The results of this research show that e-learning indicators approach is of primary
importance (Fetaji, 2007e). Having a standardised set of e-learning indicators accepted by
scientific community enables comparison and evaluation of different e-learning initiatives
and their e-learning projects in a systematic manner. Moreover this approach combined
with experimental approach to e-learning brings new insights into the specifics of e-learning
that might help in increasing the learning outcomes, especially knowledge transfer.
Therefore, conclusion is that no new systems are needed but a series of experiments has to
be conducted to see what does and does not work in a particular situation and to provide
guidelines and recommendations for that situation.
Furthermore, an investigation of issues in authoring e-learning content (e-content) was
realised. The main purpose was to effectively identify the vehicles into increased knowledge
dissemination and efficient knowledge transfer and thus improve the overall e-learning
process. Preparing quality e-content delivered digitally is probably the major aspect for
long term success of any e-learning endeavour. It is the content, however, that learners care
for and judge how much they learn from it. Therefore we have identified and addressed
most important authoring issues by analyzing different courses using an Learning
Management System.
5. Data Collection and Analysis
Depending from the Software Lifecycle used for each e-learning software solutions
developed in particular for the given experiment used is the ELUAT methodology and PET
testing as described thoroughly at (Fetaji et al 2007a). Questionnaires, surveys, focus groups,
usability testing and other software testing groups were used. Groups of students filled out
different surveys discussing e-learning indicators, barriers to distance education and
usability surveys of e-learning software solutions modelled and developed. The return rate
for the surveys for each experiment was different and the highest was for distance education
with 64.89 %, (The distance education program at the moment has 81undergraduate full
time students, and 13 part time students, or in totals 94 students) while for the e-learning
indicators the response rate was 9.7 % (There were in total 701 student surveys filled. The
University at the moment of the research survey has 6.386 undergraduate and 188
postgraduate full time students, and 643 part time students, or in total 7217 students). The
majority of the participants (63.8%) have used the e-learning software solutions discussed.
Ten percent of the participants took fewer than all of the courses mentioned previously since
Object Oriented Programming in Java was an elective subject. Large amount of data was
collected and used from the literature reviews and inputs from other related projects.
Several statistical procedures were conduct for data analysis. First, the zero-order
correlations were computed among all variables. The aim of this operation is to have an
initial test of whether there were relationships among the variables. The interaction of
technology with teaching or social presence was considered if including those items would
increase the power of the regression model substantially. The standard multiprogression
procedures were conducted with course subjective satisfaction through the perceived
learning outcome, learning engagement assessed through time to learn and time of
performance as dependent variables. All assumptions of normality, usability, of residuals
were checked in those regression analyses. In order to handle those data the triangulation
technique from Dumas and Redish (1999) was used, were we look at all data at the same
time to see how the different data supports each other.
6. E-Learning Indicators Specification and Analyses
(1) Learner education background together with his cultural background is set as indicator
since it is a direct factor that is associated and impacts e-learning. According to Gatling et al,
(2005), students today come from a variety of cultural backgrounds and educational
experiences outside of the traditional classroom. How do students construct meaning from
prior knowledge and connect it with the new experiences? Based on this facts and
interviews with e-learning specialist It was set it as important indicator.
(2) Computing skills level of the learner is set as indicator since it directly influences the way e-
learning is conducted with the use of Information and communication technologies (ICT) and
use of computers and the computing skills requirements are essential in learning. “As we
move toward the 21st century, anyone who is not “computer literate” will find themselves at a
disadvantage when competing in the job market.” (Johnson, Gatling, Hill, 1997).
The indicator (3) type of learners they are depends primarily on the balance in the two
dimensions of the Learning Style scale model formulated by Richard M. Felder and Linda K.
Silverman of North Carolina State University according to Felder & Soloman (n.d) based on
four dimensions (active/reflective, sensing/intuitive, visual/verbal, and sequential/global).
According to Felder & Soloman (n.d) “students preferentially take in and process
information in different ways: by seeing and hearing, reflecting and acting, reasoning
logically and intuitively, analyzing and visualizing, steadily and in fits and starts. Teaching
methods also vary. Some instructors lecture, others demonstrate or lead students to self-
discovery; some focus on principles and others on applications; some emphasize memory
and others understanding. Active learners tend to retain and understand information best
by doing something active with it, discussing or applying it or explaining it to others.
Reflective learners prefer to think about it quietly first. Sensing learners tend to like
learning facts; intuitive learners often prefer discovering possibilities and relationships.
Visual learners remember best what they see: pictures, diagrams, flow charts, time lines,
films, and demonstrations. Verbal learners get more out of word, written and spoken
explanations. Sequential learners tend to gain understanding in linear steps, with each step
following logically from the previous one. Global learners tend to learn in large jumps,
absorbing material almost randomly without seeing connections, and then suddenly getting
it”. Therefore assessing and knowing the learning audience is crucial in order to know
whom to support and there is an extensive need for this input data in order for the e-
learning initiative to be successful and effective. Then after the measurements the learners
E-learning,experiencesandfuture8
are divided into groups so called”collectives” were personalisation is offered to the specifics
of the collective majority (in Universities these are the departmental levels) primarily based
on learning style categorization and type of learner they are according Felder-Silverman
model for learning style categorization (Felder, 1993).
The importance of the type of learner and (4) their learning style and multiple intelligence is
for the both sides: instructor and student. For instructors it is of importance since it reflects
the preferences of Learning style in their teaching and delivery style to students. We advise
to tend to use each learning style to teach also in a delivery type suited to other types of
learners and truing to bring it closer and generalize to include all the types using
visualization and verbal communications, as well as other communication tools. According
to Tomas Armstrong (n.d.) Multiple Intelligences are eight different ways to demonstrate
intellectual ability. 1) Linguistic intelligence ("word smart"), 2) Logical-mathematical
intelligence ("number/reasoning smart"); 3) Spatial intelligence ("picture smart"); 4) Bodily-
Kinesthetic intelligence ("body smart"); 5) Musical intelligence ("music smart"); 6)
Interpersonal intelligence ("people smart"); 7) Intrapersonal intelligence ("self smart"); 8)
Naturalist intelligence ("nature smart"). Again assessing the audience and having this input
data is very important e-learning indicator in planning and developing e-learning initiative.
The indicator (5) obstacles they face in e-learning (e-learning barriers) is set as important
based on interviews and speaking with e-learning specialists. Each e-learning project has
different barriers and they are specified as learner input and depend from a situation.
Assessing what the learner audience faces as barrier is crucial in achieving effective e-
learning. Indicator (6) attention is set as very important. Attention cues when the learners
begin to feel some mental workload, Ueno, M. (2004).
(7) e-content (suitability, format preferences), e-learning content (e-content) considered as
vehicle of the e-learning process and knowledge construction. The quality of the virtual
learning environment is mainly depending on the quality of the presented e-learning
content. Fetaji, B. (2006).
Indicator (8) Instructional design has gained significant prominence in e-learning for a
number of compelling reasons. One of them is the possibility for instructional design to
systematically address the need for creating and evaluating students’ learning experience as
well as learning outcome. The other is instructional design can help faculty to focus on using
the appropriate format and tools for the appropriate learning objectives. Fetaji, B. (2006).
Indicator (9) organizational specifics - every instituion has its specific business processes
that influences and impacts e-learning, Galotta et. al. (2004)
(10) preferences of e-learning logistics - targeted at learners of different experience levels
and organizational background/hierarchy, based on the ELA model-the European Logistics
Association (ELA), (Zsifkovits, 2003). The following 7 (seven) variables have been set as
priority in determining viable learning environment and its e-learning logistics: 1)
Interoperability; 2) Pricing; 3) Performance; 4) Content development; 5) Communication
tools; 6) Student Involvement Tools; 7) Evolving technology.
(11) indicator preferences of e-learning design; designing instruction that acknowledges that
students differ in their learning preferences and abilities and that instruction needs to be
flexible to address these differences, (Kumar 2006).
The next indicators (12) technical capabilities available to respondents (13) collaboration;
(14) accessibility available to respondents, ares defined as important indicators in
discussions with e-learning specialist and experts. They represent the essential influencing
factors on e-learning mentioned in different studies such as (Coleman, B., Neuhauser, J. &
Fisher, M. 2004).
(15) Motivation is essential to learning and performances, particularly in e-learning
environments where learners must take an active role in their learning by being self directed
(Lee, 2000).
(16) Attitudes and interest. A review of studies on attitudes toward learning and using
information technology in education has revealed that most studies have shown that
students’ attitudes toward technology are critical, (Liu, et. al. 2004);
(17) performance: self-efficacy (the learner sense their effectiveness in e-learning
environment); Self-efficacy refers to people beliefs about their capabilities to perform a task
successfully at designated levels, (Bandura, 1997).
(18) According to Jenkins, A. and (Unwin, 1996) learning outcomes are defined as
statements of what is expected that a student will be able to do as a result of a learning
activity. Learning outcomes are usually expressed as knowledge transfer, skills, or attitudes
(Unwin, 1996). Therefore, it is a very important indicator in planning, designing and
evaluating e-learning.
7. E-Learning Indicators Assessment, Measurement and Evaluation
7.1 Definition
E-learning indicators have been defined with help of different focus groups, realised
literature review and a web based survey of academic staff and students in the framework
of South East European University as well as revised closely with experts in the field during
participation in several research projects. In order to investigate e-learning indicators in
planning phase of e-learning projects a case study was initiated in order to asses, measure
and evaluate e-learning indicators a web based survey has been used. The survey was
designed following the rule of thumb for all communications: Audience + Purpose =
Design. The survey was divided into 18 (eighteen) sections to cover al the e-learning
indicators previously defined. It was communicated to the participants and provided as
survey in Angel LMS. It was offered to two different department from two different
Universities. One using angel LMs as e-learning platform and the other using Moodle as
learning platform. There were in total 701 student surveys filled. The answer rate was
30.48%. There were 701 filled survey, and the total number of students in using Angel
platform was 2300. The data was collected using Angel Learning Management System and
further analyzed in Excel. The second e-learning project that is using Moodle as e-learning
platform was focused on computer Science Faculty and in total 44 surveys were filled and
the answer rate was 9.78%.
7.2 Analyses of indicator: Self efficacy in e-learning
Please rate your self efficacy in e-learning. How effective and efficient you are?
Bad Not so good OK Good Very good
□ 1 □ 2 □ 3 □ 4 □ 5
E-LearningIndicators:AMultidimensionalModel
ForPlanningDevelopingAndEvaluatingE-LearningSoftwareSolutions 9
are divided into groups so called”collectives” were personalisation is offered to the specifics
of the collective majority (in Universities these are the departmental levels) primarily based
on learning style categorization and type of learner they are according Felder-Silverman
model for learning style categorization (Felder, 1993).
The importance of the type of learner and (4) their learning style and multiple intelligence is
for the both sides: instructor and student. For instructors it is of importance since it reflects
the preferences of Learning style in their teaching and delivery style to students. We advise
to tend to use each learning style to teach also in a delivery type suited to other types of
learners and truing to bring it closer and generalize to include all the types using
visualization and verbal communications, as well as other communication tools. According
to Tomas Armstrong (n.d.) Multiple Intelligences are eight different ways to demonstrate
intellectual ability. 1) Linguistic intelligence ("word smart"), 2) Logical-mathematical
intelligence ("number/reasoning smart"); 3) Spatial intelligence ("picture smart"); 4) Bodily-
Kinesthetic intelligence ("body smart"); 5) Musical intelligence ("music smart"); 6)
Interpersonal intelligence ("people smart"); 7) Intrapersonal intelligence ("self smart"); 8)
Naturalist intelligence ("nature smart"). Again assessing the audience and having this input
data is very important e-learning indicator in planning and developing e-learning initiative.
The indicator (5) obstacles they face in e-learning (e-learning barriers) is set as important
based on interviews and speaking with e-learning specialists. Each e-learning project has
different barriers and they are specified as learner input and depend from a situation.
Assessing what the learner audience faces as barrier is crucial in achieving effective e-
learning. Indicator (6) attention is set as very important. Attention cues when the learners
begin to feel some mental workload, Ueno, M. (2004).
(7) e-content (suitability, format preferences), e-learning content (e-content) considered as
vehicle of the e-learning process and knowledge construction. The quality of the virtual
learning environment is mainly depending on the quality of the presented e-learning
content. Fetaji, B. (2006).
Indicator (8) Instructional design has gained significant prominence in e-learning for a
number of compelling reasons. One of them is the possibility for instructional design to
systematically address the need for creating and evaluating students’ learning experience as
well as learning outcome. The other is instructional design can help faculty to focus on using
the appropriate format and tools for the appropriate learning objectives. Fetaji, B. (2006).
Indicator (9) organizational specifics - every instituion has its specific business processes
that influences and impacts e-learning, Galotta et. al. (2004)
(10) preferences of e-learning logistics - targeted at learners of different experience levels
and organizational background/hierarchy, based on the ELA model-the European Logistics
Association (ELA), (Zsifkovits, 2003). The following 7 (seven) variables have been set as
priority in determining viable learning environment and its e-learning logistics: 1)
Interoperability; 2) Pricing; 3) Performance; 4) Content development; 5) Communication
tools; 6) Student Involvement Tools; 7) Evolving technology.
(11) indicator preferences of e-learning design; designing instruction that acknowledges that
students differ in their learning preferences and abilities and that instruction needs to be
flexible to address these differences, (Kumar 2006).
The next indicators (12) technical capabilities available to respondents (13) collaboration;
(14) accessibility available to respondents, ares defined as important indicators in
discussions with e-learning specialist and experts. They represent the essential influencing
factors on e-learning mentioned in different studies such as (Coleman, B., Neuhauser, J. &
Fisher, M. 2004).
(15) Motivation is essential to learning and performances, particularly in e-learning
environments where learners must take an active role in their learning by being self directed
(Lee, 2000).
(16) Attitudes and interest. A review of studies on attitudes toward learning and using
information technology in education has revealed that most studies have shown that
students’ attitudes toward technology are critical, (Liu, et. al. 2004);
(17) performance: self-efficacy (the learner sense their effectiveness in e-learning
environment); Self-efficacy refers to people beliefs about their capabilities to perform a task
successfully at designated levels, (Bandura, 1997).
(18) According to Jenkins, A. and (Unwin, 1996) learning outcomes are defined as
statements of what is expected that a student will be able to do as a result of a learning
activity. Learning outcomes are usually expressed as knowledge transfer, skills, or attitudes
(Unwin, 1996). Therefore, it is a very important indicator in planning, designing and
evaluating e-learning.
7. E-Learning Indicators Assessment, Measurement and Evaluation
7.1 Definition
E-learning indicators have been defined with help of different focus groups, realised
literature review and a web based survey of academic staff and students in the framework
of South East European University as well as revised closely with experts in the field during
participation in several research projects. In order to investigate e-learning indicators in
planning phase of e-learning projects a case study was initiated in order to asses, measure
and evaluate e-learning indicators a web based survey has been used. The survey was
designed following the rule of thumb for all communications: Audience + Purpose =
Design. The survey was divided into 18 (eighteen) sections to cover al the e-learning
indicators previously defined. It was communicated to the participants and provided as
survey in Angel LMS. It was offered to two different department from two different
Universities. One using angel LMs as e-learning platform and the other using Moodle as
learning platform. There were in total 701 student surveys filled. The answer rate was
30.48%. There were 701 filled survey, and the total number of students in using Angel
platform was 2300. The data was collected using Angel Learning Management System and
further analyzed in Excel. The second e-learning project that is using Moodle as e-learning
platform was focused on computer Science Faculty and in total 44 surveys were filled and
the answer rate was 9.78%.
7.2 Analyses of indicator: Self efficacy in e-learning
Please rate your self efficacy in e-learning. How effective and efficient you are?
Bad Not so good OK Good Very good
□ 1 □ 2 □ 3 □ 4 □ 5
E-learning,experiencesandfuture10
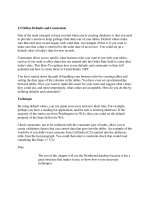
7.2.1 ANGEL LMS - Findings for indicator: Self efficacy in e-learning
Most of the respondents, 43.7% have rated them self’s as good their efficacy in e-learning.
While 24.1 % have rated them self’s as very good.
On the other hand 1% of them were not satisfied with the e-learning environment and their
efficacy and have rated them self’s as bad, 4.7 % not so good, and 26.5% rated them self’s as
OK, meaning they are partially satisfied with the e-learning system and their effectiveness in it.
1,00%
4,70%
26,50%
43,70%
24,10%
Bad Not so
good
OK Good Very
Good
Self Efficacy in e-learning
Fig. 1. ANGEL LMS - Findings for indicator
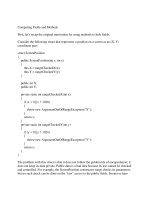
7.2.2 Moodle LMS- Findings for indicator: Self efficacy in e-learning
Most of the respondents, 33.17%, have rated them self’s as good their efficacy in e-learning.
While 26.54 % have rated them self’s as very good.
On the other hand 1.12% of them were not satisfied with the e-learning environment and
their efficacy and have rated them self’s as bad, 9.7 % not so good, and 29.47% rated them
self’s as OK, meaning they are partially satisfied with the e-learning system and their
effectiveness in it.
1,12%
9,70%
29,47%
33,17%
26,54%
Bad Not so
good
OK Good Very
Good
Self Efficacy in e-learning
Fig. 2. Moodle LMS - Findings for indicator
7.2.3 Discussion of the Findings for Indicator: Self Efficacy in E-learning
As Bandura (1997) defined it, self-efficacy refers to people beliefs about their capabilities
whether or not they can perform successfully at designated levels using the e-learning
environment. From the analyses of the findings it indicates that there is an increase in
student’s achievement after their engagement in an e-learning environment. Overall 94.3%
of the students in Angel and 89.18 % of students in MOODLE are satisfied with their self-
efficacy and have shown progress moving in the new e-learning environment from the
traditional classroom. However there are 5.7 % of the students (ANGEL) and 10.82 %
(MOODLE) that are not satisfied with their achievement. The main reason among others for
this result is identified in the usability issues of the two offered e-learning systems. Other
reasons will be discussed in conclusions. However in general students rated their self
efficacy as better in using ANGEL compared to MOODLE.
7.3 Analyses of Indicator: Type of Learner
What type of learner you are? (Please Circle one option: a) or b) for each row)
a) ACTIVE or b) REFLECTIVE Learner
(Explanations: Active learners tend to retain and understand information best by doing
something active with it discussing or applying it or explaining it to others. Reflective
learners prefer to think about it quietly first.)
7.3.1 ANGEL LMS - Findings for Indicator: Type of Learner
Type of Learner
Active; 72,61%
Reflective;
29,24%
Activ e
Reflectiv e
Fig. 3. ANGEL LMS - Findings for indicator
On the whole, 72.61 % of respondents rated them self’s as Active learners while the others
29.24 % as Reflective learners.
7.3.2 MOODLE - Findings for indicator: Type of Learner
Type of Learner
Active; 54,28%
Reflective;
45,72%
Active
Reflective
Fig. 4. Moodle LMS - Findings for indicator
E-LearningIndicators:AMultidimensionalModel
ForPlanningDevelopingAndEvaluatingE-LearningSoftwareSolutions 11
7.2.1 ANGEL LMS - Findings for indicator: Self efficacy in e-learning
Most of the respondents, 43.7% have rated them self’s as good their efficacy in e-learning.
While 24.1 % have rated them self’s as very good.
On the other hand 1% of them were not satisfied with the e-learning environment and their
efficacy and have rated them self’s as bad, 4.7 % not so good, and 26.5% rated them self’s as
OK, meaning they are partially satisfied with the e-learning system and their effectiveness in it.
1,00%
4,70%
26,50%
43,70%
24,10%
Bad Not so
good
OK Good Very
Good
Self Efficacy in e-learning
Fig. 1. ANGEL LMS - Findings for indicator
7.2.2 Moodle LMS- Findings for indicator: Self efficacy in e-learning
Most of the respondents, 33.17%, have rated them self’s as good their efficacy in e-learning.
While 26.54 % have rated them self’s as very good.
On the other hand 1.12% of them were not satisfied with the e-learning environment and
their efficacy and have rated them self’s as bad, 9.7 % not so good, and 29.47% rated them
self’s as OK, meaning they are partially satisfied with the e-learning system and their
effectiveness in it.
1,12%
9,70%
29,47%
33,17%
26,54%
Bad Not so
good
OK Good Very
Good
Self Efficacy in e-learning
Fig. 2. Moodle LMS - Findings for indicator
7.2.3 Discussion of the Findings for Indicator: Self Efficacy in E-learning
As Bandura (1997) defined it, self-efficacy refers to people beliefs about their capabilities
whether or not they can perform successfully at designated levels using the e-learning
environment. From the analyses of the findings it indicates that there is an increase in
student’s achievement after their engagement in an e-learning environment. Overall 94.3%
of the students in Angel and 89.18 % of students in MOODLE are satisfied with their self-
efficacy and have shown progress moving in the new e-learning environment from the
traditional classroom. However there are 5.7 % of the students (ANGEL) and 10.82 %
(MOODLE) that are not satisfied with their achievement. The main reason among others for
this result is identified in the usability issues of the two offered e-learning systems. Other
reasons will be discussed in conclusions. However in general students rated their self
efficacy as better in using ANGEL compared to MOODLE.
7.3 Analyses of Indicator: Type of Learner
What type of learner you are? (Please Circle one option: a) or b) for each row)
a) ACTIVE
or b) REFLECTIVE Learner
(Explanations: Active learners
tend to retain and understand information best by doing
something active with it discussing or applying it or explaining it to others. Reflective
learners prefer to think about it quietly first.)
7.3.1 ANGEL LMS - Findings for Indicator: Type of Learner
Type of Learner
Active; 72,61%
Reflective;
29,24%
Activ e
Reflectiv e
Fig. 3. ANGEL LMS - Findings for indicator
On the whole, 72.61 % of respondents rated them self’s as Active learners while the others
29.24 % as Reflective learners.
7.3.2 MOODLE - Findings for indicator: Type of Learner
Type of Learner
Active; 54,28%
Reflective;
45,72%
Active
Reflective
Fig. 4. Moodle LMS - Findings for indicator
E-learning,experiencesandfuture12
On the whole, 54.28 % of respondents rated them self’s as Active learners while the others
45.72 % as Reflective learners.
7.3.3 Discussion of the findings for indicator: Type of Learner
The indicator (3) type of learners they are depends primarily on the balance in the two
dimensions of the Learning Style scale model formulated by Richard M. Felder and Linda K.
Silverman according to Felder & Soloman (n.d). The findings indicate that students in using
ANGEL are primarily of the Active type of learner 72.61% in comparison to 29.24%
Reflective type of a learner. The students in using MOODLE are primarily of type reflective
learners 54.28% in comparison to 45.72 %. These findings indicate that the structure and
curriculum of the studies should change and embrace this type of learner more by
preferring and choosing a hands on approach in comparison to the theoretical approach for
the learners using ANGEL and the opposite for the learners using MOODLE were learners
should be provided more reading materials and solved examples so they can reflect this and
learn by doing this.
7.4.3 Analyses of indicator: Type of Learner
a) SENSING
or b) INTUITIVE Learner
(Explanations: Sensing learners
tend to like learning facts; intuitive learners often prefer
discovering possibilities and relationships.)
7.4.3.1 ANGEL LMS - Findings for indicator: Type of Learner
Type of Learner
Sensing; 62,62%
Intuitive; 37,37%
Sensing
Intuitive
Fig. 5. ANGEL LMS - Findings for indicator
On the whole, 62.62 % of respondents rated them self’s as Sensing learners while the others
37.37% as Intuitive learners.
7.4.3.2 MOODLE - Findings for indicator: Type of Learner
Type of Learner
Intuitive; 56,09%
Sensing; 43,91%
Sensing
Intuitive
Fig. 6. Moodle LMS - Findings for indicator
On the whole, 43.91 % of respondents rated them self’s as Sensing learners while the others
56.09% as Intuitive learners.
7.4.3.3 Discussion of the findings for indicator: Type of Learner
The findings indicate that ANGEL LMS students are primarily of type sensing and they tend
to learn by learning facts 62.62%. The minority group of the students are of type intuitive
learners 37.37% and they prefer discovering possibilities and relationships for them self’s.
These finding suggests that the content created and used in the e-learning environment
should be concentrated around facts and detailed descriptions rather then on living this to
students to discover for them self’s. MOODLE students are primarily of type Intuitive
56.09% compared to the sensing group with 56.09%. For the students of this type the
recommendations are to provide more information and case studies for students in order to
intuitively learn and find the answers.
7.4.4 Analyses of Indicator: Type of Learner
a) VISUAL or b) VERBAL LEARNER
(Explanations: Visual learners remember best what they see pictures, diagrams, flow
charts, time lines, films, and demonstrations. Verbal learners get more out of words-
written and spoken explanations.)
7.4.4.1 ANGEL LMS - Findings for indicator: Type of Learner
Type of Learner
Visual, 59.34%
Verbal, 40.66%
Visual
Verbal
Fig. 7. ANGEL LMS - Findings for indicator
On the whole, 59.34 % of respondents rated them self’s as Visual learners while the others
40.66% as Verbal learners.
E-LearningIndicators:AMultidimensionalModel
ForPlanningDevelopingAndEvaluatingE-LearningSoftwareSolutions 13
On the whole, 54.28 % of respondents rated them self’s as Active learners while the others
45.72 % as Reflective learners.
7.3.3 Discussion of the findings for indicator: Type of Learner
The indicator (3) type of learners they are depends primarily on the balance in the two
dimensions of the Learning Style scale model formulated by Richard M. Felder and Linda K.
Silverman according to Felder & Soloman (n.d). The findings indicate that students in using
ANGEL are primarily of the Active type of learner 72.61% in comparison to 29.24%
Reflective type of a learner. The students in using MOODLE are primarily of type reflective
learners 54.28% in comparison to 45.72 %. These findings indicate that the structure and
curriculum of the studies should change and embrace this type of learner more by
preferring and choosing a hands on approach in comparison to the theoretical approach for
the learners using ANGEL and the opposite for the learners using MOODLE were learners
should be provided more reading materials and solved examples so they can reflect this and
learn by doing this.
7.4.3 Analyses of indicator: Type of Learner
a) SENSING or b) INTUITIVE Learner
(Explanations: Sensing learners tend to like learning facts; intuitive learners often prefer
discovering possibilities and relationships.)
7.4.3.1 ANGEL LMS - Findings for indicator: Type of Learner
Type of Learner
Sensing; 62,62%
Intuitive; 37,37%
Sensing
Intuitive
Fig. 5. ANGEL LMS - Findings for indicator
On the whole, 62.62 % of respondents rated them self’s as Sensing learners while the others
37.37% as Intuitive learners.
7.4.3.2 MOODLE - Findings for indicator: Type of Learner
Type of Learner
Intuitive; 56,09%
Sensing; 43,91%
Sensing
Intuitive
Fig. 6. Moodle LMS - Findings for indicator
On the whole, 43.91 % of respondents rated them self’s as Sensing learners while the others
56.09% as Intuitive learners.
7.4.3.3 Discussion of the findings for indicator: Type of Learner
The findings indicate that ANGEL LMS students are primarily of type sensing and they tend
to learn by learning facts 62.62%. The minority group of the students are of type intuitive
learners 37.37% and they prefer discovering possibilities and relationships for them self’s.
These finding suggests that the content created and used in the e-learning environment
should be concentrated around facts and detailed descriptions rather then on living this to
students to discover for them self’s. MOODLE students are primarily of type Intuitive
56.09% compared to the sensing group with 56.09%. For the students of this type the
recommendations are to provide more information and case studies for students in order to
intuitively learn and find the answers.
7.4.4 Analyses of Indicator: Type of Learner
a) VISUAL or b) VERBAL LEARNER
(Explanations: Visual learners
remember best what they see pictures, diagrams, flow
charts, time lines, films, and demonstrations. Verbal learners
get more out of words-
written and spoken explanations.)
7.4.4.1 ANGEL LMS - Findings for indicator: Type of Learner
Type of Learner
Visual, 59.34%
Verbal, 40.66%
Visual
Verbal
Fig. 7. ANGEL LMS - Findings for indicator
On the whole, 59.34 % of respondents rated them self’s as Visual learners while the others
40.66% as Verbal learners.
E-learning,experiencesandfuture14
7.4.4.2 MOODLE - Findings for indicator: Type of Learner
Type of Learner
V
isual, 51.4
2
Verbal, 49.58%
Visual
Verbal
Fig. 8. Moodle LMS - Findings for indicator
On the whole, 51.42 % of respondents rated them self’s as Visual learners while the others
49.58% as Verbal learners.
7.4.4.3 Discussion of the findings for indicator: Type of Learner
The findings indicate that ANGEL students are 59.34% while MOODLE 51.42% primarily of
type Visual learners and they tend to learn by pictures, diagrams, flow charts, time lines,
films, and demonstrations. The other group of the students is of type verbal learners Angel
40.66% and MOODLE 49.58% and they prefer to learn out of words, written and spoken.
This findings suggests that the e-content created and used in the e-learning environment
should contain more multimedia elements like pictures, diagrams, flow charts and
demonstrations rather then just text explanations.
7.4.5 Analyses of indicator: Type of Learner
a) SEQUENTIAL or b) GLOBAL LEARNER
(Explanations: Sequential learners tend to gain understanding in linear steps, with each
step following logically from the previous one. Global learners tend to learn in large
jumps, absorbing material almost randomly without seeing connections, and then
suddenly "getting it.")
7.4.5.1 ANGEL LMS - Findings for indicator
Type of Learner
Sequential,
61.63%
Global, 38.37%
Sequential
Global
Fig. 9. ANGEL LMS - Findings for indicator
On the whole, 61.63 % of respondents rated them self’s as Sequential learners while the
others 38.37% as Global learners.
7.4.5.2 MOODLE - Findings for indicator
Type of Learner
Sequential,
47.17%
Global, 52.83%
Sequential
Global
Fig. 10. Moodle LMS - Findings for indicator
On the whole, 52.83 % of respondents rated them self’s as Sequential learners while the
others 47.17% as Global learners.
7.4.5.3 Discussion of the findings
The findings indicate that 61.63 % Angel students and 47.17% Moodle students are
primarily of type Sequential learners and they tend to learn in linear steps, with each step
following logically from the previous one. The other group of the students are of type
Global learners 38.37% Angel students and 52.83% Moodle students and they prefer to learn
in large jumps, absorbing material almost randomly without seeing connections, and then
suddenly "getting it.". This findings suggests that the e-content created and used in the e-
learning environment should present the subject sequentially and then progressing step by
step to the global and general issues for Angel environment students while for the Moodle
environment students the content provided should contain information that provides global
picture of the content.
7.4.6 Analyses of indicator: Learning Style and intelligence
1) Linguistic ("word smart", sensitivity and ability to spoken and written language):
2) Logical-mathematical ("number/reasoning smart", analyze problems logically,
investigate issues scientifically)
3) Spatial ("picture smart", potential to recognize and use the patterns of wide space)
4) Bodily-Kinesthetic ("body smart", mental abilities to coordinate bodily movements)
5) Musical ("music smart", skill in the performance, composition, and appreciation of
musical patterns)
6) Interpersonal ("people smart", capacity to understand the intentions, motivations and
desires of other people)
7) Intrapersonal ("self smart", capacity to understand oneself, to appreciate one's feelings,
fears and motivations)
8) Naturalist ("nature smart", recognize, categorize certain features of the environment)
E-LearningIndicators:AMultidimensionalModel
ForPlanningDevelopingAndEvaluatingE-LearningSoftwareSolutions 15
7.4.4.2 MOODLE - Findings for indicator: Type of Learner
Type of Learner
V
isual, 51.4
2
Verbal, 49.58%
Visual
Verbal
Fig. 8. Moodle LMS - Findings for indicator
On the whole, 51.42 % of respondents rated them self’s as Visual learners while the others
49.58% as Verbal learners.
7.4.4.3 Discussion of the findings for indicator: Type of Learner
The findings indicate that ANGEL students are 59.34% while MOODLE 51.42% primarily of
type Visual learners and they tend to learn by pictures, diagrams, flow charts, time lines,
films, and demonstrations. The other group of the students is of type verbal learners Angel
40.66% and MOODLE 49.58% and they prefer to learn out of words, written and spoken.
This findings suggests that the e-content created and used in the e-learning environment
should contain more multimedia elements like pictures, diagrams, flow charts and
demonstrations rather then just text explanations.
7.4.5 Analyses of indicator: Type of Learner
a) SEQUENTIAL or b) GLOBAL LEARNER
(Explanations: Sequential learners tend to gain understanding in linear steps, with each
step following logically from the previous one. Global learners tend to learn in large
jumps, absorbing material almost randomly without seeing connections, and then
suddenly "getting it.")
7.4.5.1 ANGEL LMS - Findings for indicator
Type of Learner
Sequential,
61.63%
Global, 38.37%
Sequential
Global
Fig. 9. ANGEL LMS - Findings for indicator
On the whole, 61.63 % of respondents rated them self’s as Sequential learners while the
others 38.37% as Global learners.
7.4.5.2 MOODLE - Findings for indicator
Type of Learner
Sequential,
47.17%
Global, 52.83%
Sequential
Global
Fig. 10. Moodle LMS - Findings for indicator
On the whole, 52.83 % of respondents rated them self’s as Sequential learners while the
others 47.17% as Global learners.
7.4.5.3 Discussion of the findings
The findings indicate that 61.63 % Angel students and 47.17% Moodle students are
primarily of type Sequential learners and they tend to learn in linear steps, with each step
following logically from the previous one. The other group of the students are of type
Global learners 38.37% Angel students and 52.83% Moodle students and they prefer to learn
in large jumps, absorbing material almost randomly without seeing connections, and then
suddenly "getting it.". This findings suggests that the e-content created and used in the e-
learning environment should present the subject sequentially and then progressing step by
step to the global and general issues for Angel environment students while for the Moodle
environment students the content provided should contain information that provides global
picture of the content.
7.4.6 Analyses of indicator: Learning Style and intelligence
1) Linguistic ("word smart", sensitivity and ability to spoken and written language):
2) Logical-mathematical ("number/reasoning smart", analyze problems logically,
investigate issues scientifically)
3) Spatial ("picture smart", potential to recognize and use the patterns of wide space)
4) Bodily-Kinesthetic ("body smart", mental abilities to coordinate bodily movements)
5) Musical ("music smart", skill in the performance, composition, and appreciation of
musical patterns)
6) Interpersonal ("people smart", capacity to understand the intentions, motivations and
desires of other people)
7) Intrapersonal ("self smart", capacity to understand oneself, to appreciate one's feelings,
fears and motivations)
8) Naturalist ("nature smart", recognize, categorize certain features of the environment)
E-learning,experiencesandfuture16
7.4.6.1 ANGEL LMS - Findings for indicator
Learning Style
Musical; 6,42%
Logical-
mathematical;
24,10%
Linguistic; 11,64%
Naturalist; 14,78%
Bodily-Kinesthetic ;
4,63%
Spatial; 7,84%
Intrapersonal ;
14,85%
Interpersonal ;
15,75%
Linguistic
Logical-mathematical
Spatial
Bodily-Kinesthetic
Musical
Interpersonal
Intrapersonal
Naturalist
Fig. 11. ANGEL LMS - Findings for indicator
7.4.6.2 MOODLE - Findings for indicator
Learning Style
2,42%
Interpersonal ;
15,75%
Intrapersonal ;
11,85%
Spatial; 17,84%
i
ly-Kinesthetic ;
4,63%
Naturalist; 5,80%
Linguistic; 5,16%
Logical-
mathematical;
36,55%
Linguistic
Logical-
mathematical
Spatial
Bodily-
Kinesthetic
Musical
Interpersonal
Intrapersonal
Naturalist
Fig. 12. Moodle LMS - Findings for indicator
7.4.6.3 Discussion of the Findings
The findings indicate that Angel and Moodle students are more or less with a balanced and
similar learning style and intelligence were slightly prevails the Logical-mathematical, and
linguistic style and intelligence preferences.
7.4.7 Analyses of indicator: Obstacles - Borders
Please define the obstacles you face in e-learning?
7.4.7.1 ANGEL LMS - Findings for indicator
Obstacles - borders
content suitability;
9,65%
Computer access;
8,79%
Computer skills;
10,50%
Location based;
10,40%
Organisational;
9,75%
Personal; 12,97%
instructional
design; 12,86%
Internet
connection;
13,29%
Learning Style;
11,79%
Computer skills
Learning Style
content suitability
Computer access
Internet connection
instructional design
Personal
Organisational
Location based
Fig. 13. ANGEL LMS - Findings for indicator
7.4.7.2 MOODLE - Findings for Indicator
Obstacles - borders
content suitability;
24,85%
Computer access;
6,83%
Computer skills;
1,00%
Location based;
9,04%
Organisational;
14,98%
Personal; 22,92%
instructional
design; 3,60%
Internet
connection; 3,29%
Learning Style;
14,49%
Computer skills
Learning Style
content suitability
Computer access
Internet connection
instructional design
Personal
Organisational
Location based
Fig. 14. Moodle LMS - Findings for indicator
7.4.7.3 Discussion of the Findings
The findings indicate that there are a lot of obstacles and barriers to e-learning and they are
rated as follows in percentage: Angel: Based on these findings the internet connection and e-
content not suited to learners learning style are rated as the biggest obstacles and barriers to
enhanced learning. Moodle: Based on the findings content suitability, personal issues and
learning style are rated as the biggest obstacles to enhanced learning.
E-LearningIndicators:AMultidimensionalModel
ForPlanningDevelopingAndEvaluatingE-LearningSoftwareSolutions 17
7.4.6.1 ANGEL LMS - Findings for indicator
Learning Style
Musical; 6,42%
Logical-
mathematical;
24,10%
Linguistic; 11,64%
Naturalist; 14,78%
Bodily-Kinesthetic ;
4,63%
Spatial; 7,84%
Intrapersonal ;
14,85%
Interpersonal ;
15,75%
Linguistic
Logical-mathematical
Spatial
Bodily-Kinesthetic
Musical
Interpersonal
Intrapersonal
Naturalist
Fig. 11. ANGEL LMS - Findings for indicator
7.4.6.2 MOODLE - Findings for indicator
Learning Style
2,42%
Interpersonal ;
15,75%
Intrapersonal ;
11,85%
Spatial; 17,84%
i
ly-Kinesthetic ;
4,63%
Naturalist; 5,80%
Linguistic; 5,16%
Logical-
mathematical;
36,55%
Linguistic
Logical-
mathematical
Spatial
Bodily-
Kinesthetic
Musical
Interpersonal
Intrapersonal
Naturalist
Fig. 12. Moodle LMS - Findings for indicator
7.4.6.3 Discussion of the Findings
The findings indicate that Angel and Moodle students are more or less with a balanced and
similar learning style and intelligence were slightly prevails the Logical-mathematical, and
linguistic style and intelligence preferences.
7.4.7 Analyses of indicator: Obstacles - Borders
Please define the obstacles you face in e-learning?
7.4.7.1 ANGEL LMS - Findings for indicator
Obstacles - borders
content suitability;
9,65%
Computer access;
8,79%
Computer skills;
10,50%
Location based;
10,40%
Organisational;
9,75%
Personal; 12,97%
instructional
design; 12,86%
Internet
connection;
13,29%
Learning Style;
11,79%
Computer skills
Learning Style
content suitability
Computer access
Internet connection
instructional design
Personal
Organisational
Location based
Fig. 13. ANGEL LMS - Findings for indicator
7.4.7.2 MOODLE - Findings for Indicator
Obstacles - borders
content suitability;
24,85%
Computer access;
6,83%
Computer skills;
1,00%
Location based;
9,04%
Organisational;
14,98%
Personal; 22,92%
instructional
design; 3,60%
Internet
connection; 3,29%
Learning Style;
14,49%
Computer skills
Learning Style
content suitability
Computer access
Internet connection
instructional design
Personal
Organisational
Location based
Fig. 14. Moodle LMS - Findings for indicator
7.4.7.3 Discussion of the Findings
The findings indicate that there are a lot of obstacles and barriers to e-learning and they are
rated as follows in percentage: Angel: Based on these findings the internet connection and e-
content not suited to learners learning style are rated as the biggest obstacles and barriers to
enhanced learning. Moodle: Based on the findings content suitability, personal issues and
learning style are rated as the biggest obstacles to enhanced learning.