RECENT ADVANCES IN BRAIN COMPUTER INTERFACE SYSTEMS doc
Bạn đang xem bản rút gọn của tài liệu. Xem và tải ngay bản đầy đủ của tài liệu tại đây (10.47 MB, 234 trang )
RECENT ADVANCES
IN BRAINͳCOMPUTER
INTERFACE SYSTEMS
Edited by Reza Fazel-Rezai
Recent Advances in Brain-Computer Interface Systems
Edited by Reza Fazel-Rezai
Published by InTech
Janeza Trdine 9, 51000 Rijeka, Croatia
Copyright © 2011 InTech
All chapters are Open Access articles distributed under the Creative Commons
Non Commercial Share Alike Attribution 3.0 license, which permits to copy,
distribute, transmit, and adapt the work in any medium, so long as the original
work is properly cited. After this work has been published by InTech, authors
have the right to republish it, in whole or part, in any publication of which they
are the author, and to make other personal use of the work. Any republication,
referencing or personal use of the work must explicitly identify the original source.
Statements and opinions expressed in the chapters are these of the individual contributors
and not necessarily those of the editors or publisher. No responsibility is accepted
for the accuracy of information contained in the published articles. The publisher
assumes no responsibility for any damage or injury to persons or property arising out
of the use of any materials, instructions, methods or ideas contained in the book.
Publishing Process Manager Iva Lipovic
Technical Editor Teodora Smiljanic
Cover Designer Martina Sirotic
Image Copyright Jezper, 2010. Used under license from Shutterstock.com
First published Februry, 2011
Printed in India
A free online edition of this book is available at www.intechopen.com
Additional hard copies can be obtained from
Recent Advances in Brain-Computer Interface Systems, Edited by Reza Fazel-Rezai
p. cm.
ISBN 978-953-307-175-6
free online editions of InTech
Books and Journals can be found at
www.intechopen.com
Chapter 1
Chapter 2
Chapter 3
Chapter 4
Chapter 5
Chapter 6
Chapter 7
Chapter 8
Preface IX
Hardware/Software Components
and Applications of BCIs 1
Christoph Guger, Günter Edlinger and Gunther Krausz
Applied Advanced Classifiers
for Brain Computer Interface 25
José Luis Martínez, Antonio Barrientos
Feature Extraction by Mutual Information
Based on Minimal-Redundancy-Maximal-Relevance
Criterion and Its Application to Classifying
EEG Signal for Brain-Computer Interfaces 67
Abbas Erfanian, Farid Oveisi and Ali Shadvar
P300-based Brain-Computer
Interface Paradigm Design 83
Reza Fazel-Rezai and Waqas Ahmad
Brain Computer Interface Based on the Flash
Onset and Offset Visual Evoked Potentials 99
Po-Lei Lee, Yu-Te Wu,
Kuo-Kai Shyu and Jen-Chuen Hsieh
Usability of Transient VEPs in BCIs 119
Natsue Yoshimura and Naoaki Itakura
Visuo-Motor Tasks
in a Brain-Computer Interface Analysis 135
Vito Logar and Aleš Belič
A Two-Dimensional Brain-Computer Interface
Associated With Human Natural Motor Control 151
Dandan Huang, Xuedong Chen,
Ding-Yu Fei and Ou Bai
Contents
Contents
VI
Advances in Non-Invasive Brain-Computer
Interfaces for Control and Biometry 171
Nuno Figueiredo, Filipe Silva, Pétia Georgieva and Ana Tomé
State of the Art in BCI Research: BCI Award 2010 193
Christoph Guger, Guangyu Bin, Xiaorong Gao, Jing Guo,
Bo Hong, Tao Liu, Shangkai Gao, Cuntai Guan, Kai Keng Ang,
Kok Soon Phua, Chuanchu Wang, Zheng Yang Chin,
Haihong Zhang, Rongsheng Lin, Karen Sui Geok Chua,
Christopher Kuah, Beng Ti Ang, Harry George, Andrea Kübler,
Sebastian Halder, Adi Hösle, Jana Münßinger, Mark Palatucci,
Dean Pomerleau, Geoff Hinton, Tom Mitchell, David B. Ryan,
Eric W. Sellers, George Townsend, Steven M. Chase,
Andrew S. Whitford, Andrew B. Schwartz, Kimiko Kawashima,
Keiichiro Shindo, Junichi Ushiba, Meigen Liu and Gerwin Schalk
Chapter 9
Chapter 10
Pref ac e
Communication and the ability to interact with the environment are basic human
needs. Millions of people worldwide suff er from such severe physical disabilities that
they cannot even meet these basic needs. Even though they may have no motor mobil-
ity, however, the sensory and cognitive functions of the physically disabled are usually
intact. This makes them good candidates for Brain Computer Interface (BCI) technol-
ogy, which provides a direct electronic interface and can convey messages and com-
mands directly from the human brain to a computer. BCI technology involves moni-
toring conscious brain electrical activity via electroencephalogram (EEG) signals and
detecting characteristics of EEG pa erns via digital signal processing algorithms that
the user generates to communicate. It has the potential to enable the physically dis-
abled to perform many activities, thus improving their quality of life and productivity,
allowing them more independence and reducing social costs. The challenge with BCI,
however, is to extract the relevant pa erns from the EEG signals produced by the brain
each second.
A BCI system has an input, output and a signal processing algorithm that maps the
inputs to the output. The following four major strategies are considered for the input
of a BCI system: 1) the P300 wave of event related potentials (ERP), 2) steady state visual
evoked potential (SSVEP), 3) slow cortical potentials and 4) motor imaginary.
Recently, there has been a great progress in the development of novel paradigms for
EEG signal recording, advanced methods for processing them, new applications for
BCI systems and complete so ware and hardware packages used for BCI applications.
In this book a few recent advances in these areas are discussed. In the fi rst chapter
hardware and so ware components along with several applications of BCI systems
are discussed. In chapters 2 and 3 several signal processing methods for classifying
EEG signals are presented. In chapter 4 a new paradigm for P300 BCI is compared
with traditional P300 BCI paradigms. Chapters 5 and 6 show how a visual evoked
potential (VEP)-based BCI works. In chapters 7 and 8 a visuo-motor-based and natural
motor control-based BCI systems are discussed, respectively. New applications of BCI
systems for control and biometry are discussed in chapter 9. Finally, the recent com-
petition in BCI held in 2010 along with a short summary of the submi ed projects are
presented in Chapter 10.
X
Preface
As the editor, I would like to thank all the authors of diff erent chapters. Without your
contributions, it would not be possible to have a quality book, help in growth of BCI
systems and utilize them in real-world applications.
Dr. Reza Fazel-Rezai
University of North Dakota
Grand Forks, ND,
USA
1
Hardware/Software Components and
Applications of BCIs
Christoph Guger, Günter Edlinger and Gunther Krausz
g.tec medical engineering GmbH/ Guger Technologies OG
Austria
1. Introduction
Human-Computer interfaces can use different signals from the body in order to control
external devices. Beside muscle activity (EMG-Electromyogram), eye movements (EOG-
Electrooculogram) and respiration also brain activity (EEG-Electroencephalogram) can be
used as input signal. EEG-based brain-computer interface (BCI) systems are realized either
with (i) slow cortical potentials, (ii) the P300 response, (iii) steady-state visual evoked
potentials (SSVEP) or (iv) motor imagery.
Potential shift of the scalp EEG over 0.5 – 10 s are called slow cortical potentials (SCPs).
Reduced cortical activation goes ahead with positive SCPs, while negative SCPs are
associated with movement and other functions involving cortical activation (Birbaumer,
2000). People are able to learn how to control these potentials, hence it is possible to use
them for BCIs as Birbaumer and his colleagues did (Birbaumer, 2000, Elbert, 1980). The main
disadvantage of this method is the extensive training time to learn how to control the SCPs.
Users need to train in several 1-2 h sessions/week over weeks or months.
The P300 wave was first discovered by Sutton (Sutton, 1965). It elicits when an unlikely
event occurs randomly between events with high probability. In the EEG signal the P300
appears as a positive wave about 300 ms after stimulus onset. Its main usage in BCIs is for
spelling devices, but one can also use it for control tasks (for example games (Finkea, 2009)
or navigation (e.g. to move a computer-mouse (Citi, 2008)). When using P300 as a spelling
device, a matrix of characters is shown to the subject. Now the rows and columns (or in
some paradigms the single characters) of the matrix are flashing in random order, while the
person concentrates only on the character he/she wants to spell. For better concentration, it
is recommended to count how many times the character flashes. Every time the desired
character flashes, a P300 wave occurs. As the detection of one single event would be
imprecise, more than one trial (flashing of each character) has to be carried out to achieve a
proper accuracy.
Krusienski et al. (Krusienski, 2006) evaluated different classification techniques for the P300
speller, wherein the stepwise linear discriminant analysis (SWLDA) and the Fisher’s linear
discriminant analysis provided the best overall performance and implementation
characteristics. A recent study (Guger 2009), performed on 100 subjects, revealed an average
accuracy level of 91.1%, with a spelling time of 28.8 s for one single character. Each character
was selected out of a matrix of 36 characters.
Recent Advances in Brain-Computer Interface Systems
2
Steady state visual evoked potentials (SSVEP)-based BCIs use several stationary flashing
sources (e.g. flickering LEDs, or phase-reversing checkerboards), each of them flashing with
another constant frequency. When a person gazes at one of these sources, the specific
frequency component will increase in the measured EEG, over the occipital lobe. Hence,
when using different light sources, each of them representing a predefined command, the
person gives this command by gazing onto the source. The classification is either done by
FFT-based spectrum comparison, preferably including also the harmonics (Müller-Putz,
2005), or via the canonical correlation analysis (CCA) (Lin, 2006). A third possibility is via
the minimum energy approach which was published by O. Friman et.al. in 2007 (Friman,
2007) and requires no training.
Typical SSVEP applications are made for navigation, for example Middendorf et al.
(Middendorf, 2000) used SSVEPs to control the roll position of a flight simulator. The
number of classes varies between two and eight, although Gao et al. (Gao, 2003) established
an experiment with even 48 targets. Bakardijan et al. (Bakardijan, 2010) investigated SSVEP
responses for frequencies between 5 and 84 Hz to find the strongest response between 5.6
Hz and 15.3 Hz peaking at 12 Hz. With their frequency-optimized-eight-command BCI they
achieved a mean success rate of 98 % and an information transfer rate (ITR) of 50 bits/min.
Bin et al. (Bin, 2009) reports of a six-target BCI with an average accuracy of 95.3% and an
information transfer rate of 58 ± 9.6 bits/min.
Although most SSVEP-based BCIs work with gaze shifting towards a source, recent studies
(Allison, 2009, Zhang, 2010) proofed that only selective attention onto a pattern alone is
sufficient for control. The latter paper achieved an overall classification accuracy of 72.6 +/-
16.1% after 3 training days. Therefore also severely disabled people, who are not able to
move their eyes, can control an SSVEP-based BCI.
When subjects perform or only imagine motor tasks, an event related desynchronization
(ERD) (Pfurtscheller & Neuper, 1997) and an event related synchronization (ERS) is
detectable by changes of EEG rhythms on electrodes close to the respective sensorimotor
areas. The ERD is indicated by a decrease of power in the upper alpha band and lower beta
band, starting 2 seconds before movement onset on the contra lateral hemisphere and
becomes bilaterally symmetrical immediately before execution of movement (Pfurtscheller,
1999). An ERS appears either after termination of the movement, or simultaneously to the
ERD, but in other areas of the cortex. The decrease/increase is always measured in
comparison to the power in a reference interval, for example a few seconds before the
movement occurs. For classification there are several approaches used. The simplest one is
by calculating the bandpower in a specific frequency band and consecutive discrimination
via a Fisher linear discriminant analysis. Other classification strategies are support vector
machines (SVM) (Solis-Escalante, 2008), principal component analysis (PCA) (Vallabhaneni,
2004), or common spatial patterns (CSP) (Guger, 2003)
2. Components and signals
For BCI experiments the subject or the patient is connected via electrodes or sensors to a
biosignal amplifier and a data acquisition unit (DAQ board) containing the analog-to-digital
conversion (as shown in Figure 1). Then the data are passed to the real-time system to
perform the feature extraction and classification. Important is that the real-time system
Hardware/Software Components and Applications of BCIs
3
works fast enough to present feedback to the subject via a stimulation unit. The feedback
represents the BCI output and allows the subject to learn the BCI control faster. For system
update and data collection a central control unit managing several systems is of advantage.
Fig. 1. BCI components to run real-time experiments
2.1 Electrodes
For EEG measurements normally single disk electrodes made of gold or Ag/AgCl are used
(see Figure 2). Gold electrodes are maintenance free and have a good frequency response for
EEG, EMG or ECG measurements. For DC derivations with EEG frequencies below 0.1 Hz
Ag/AgCl electrodes perform better than gold electrodes. Passive electrodes consist only of
the disk material and are connected with the electrode cable and a 1.5 mm medical
connector to the biosignal amplifier. Active electrodes have a pre-amplifier with gain 1-10
inside the electrode which makes the electrode less sensitive to environmental noise such as
power line interference and cable movements. Because of this fact, active electrodes also
work if the electrode-skin impedance is higher than for passive electrodes (should be below
10 kOhm). Active electrodes have system connectors to supply the electronic components
with power. Fig.A, Fig.B and Fig.C show EEG electrodes that can be fitted into EEG caps,
Fig.D shows an ECG/EMG electrode which is placed close to the muscle/heart. Electrodes
of type A and D can also be used for EOG recordings.
Recent Advances in Brain-Computer Interface Systems
4
Fig. 2. Electrodes for EEG, ECG, EOG,… measurements. A: Active single electrode with
multi-pole connector; B: active gold electrode with multi-pole connector; C: screw-able
passive gold electrode to adjust location; D: active ECG electrode with disposable Ag/AgCl
electrode
EEG electrodes are normally distributed on the scalp according to the international 10-20
electrode system. Therefore, the distance from the Inion to the Nasion is first measured.
Then, electrode Cz on the vertex of the cap is shifted exactly to 50 % of this distance, as
indicated in Figure 3A. Figure 3B shows a cap with 64 positions. The cap uses screwable
single electrodes to adjust the depth and optimize electrode impedance. Each electrode has a
1.5 mm safety connector which can be directly connected to the biosignal amplifier. Active
electrodes have system connectors to supply the electronic components with power. There
are two main advantages of a single electrode system: (i) if one electrode breaks down it can
be removed immediately and (ii) every electrode montage can be realized easily. The
disadvantage is that all electrodes must be connected separately each time. Hence, caps are
also available with integrated electrodes. All the electrodes are combined in one ribbon cable
that can be directly connected to system connectors of the amplifiers. The main
disadvantage is the inflexibility of the montage, and the whole cap must be removed if one
electrode breaks down.
Fig. 3. Electrode caps. A: Electrode positioning according to the 10/20 electrode system. B:
Electrode cap with screwable single passive or active electrodes. C: Electrode cap with
build-in electrodes with a specific montage. D: Electrode cap with active electrodes
Active electrodes avoid or reduce artifacts and signal noise resulting from high impedance
between the electrode(s) and the skin (e.g. 50/60 Hz coupling, artifacts caused by electrode
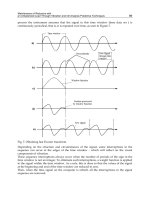
or cable movements, distorted signals or background noise). Figure 4 shows a comparison of
active and passive electrodes. Active electrodes were mounted on positions F1 (channel 1),
C1 (channel 2), O1 (channel 3) with g.GAMMAgel (no abrasion) and passive electrodes were
Hardware/Software Components and Applications of BCIs
5
mounted on positions F2 (channel 4), C2 (channel 5) and O2 (channel 6) with abrasive gel.
Active and passive electrodes are located next to each other to allow a better comparison. The
ground electrode was located on position FPz. The active electrodes were referenced against
the right ear. The passive electrodes are referenced against the left ear. Five conditions were
compared: (i) eye movements, (ii) biting, (iii) cable artefacts, (iv) active head movements by the
person himself and (v) passive head movements done by a second person.
EOG Biting
Cable artefacts Active head movement
Passive head movement
Fig. 4. Comparison of active and passive electrodes. The first three channels in each plot are
recorded with active electrodes, the last three channels with passive electrodes
EYE MOVEMENTS -The channels closer to the eyes (1 and 4) show higher EOG artefacts
than central and occipital channels. Both passive and active electrodes show a similar EOG
contamination which is also clear because both pick up the same source signal.
Recent Advances in Brain-Computer Interface Systems
6
BITING - Biting produces an EMG contamination almost equally on all channels and there is
no difference between active and passive electrodes because both pick up the same source
signal.
CABLE ARTEFACTS - Cable artefacts are produced by touching or shaking the cables. The
active electrodes are almost unaffected while the passive electrodes show large movement
artefacts.
ACTIVE HEAD MOVEMENTS - Active head movements produce fewer artefacts with
active electrodes compared to passive ones. Artefacts for both electrodes can occur because
of skin-electrode movements. Passive electrodes are mostly affected by the cable movements
initiated by the head movements.
PASSIVE HEAD MOVEMENTS - Passive head movements have lower accelerations than
active head movements and therefore the artefacts are smaller and mostly visible with
passive electrodes.
2.2 Biosignal amplifier
One of the key components of a physiological recording and analysis system is the biosignal
amplifier. Figure 5 illustrates g.USBamp and a block diagram of the amplifier.
Fig. 5. Biosignal amplifier and block diagram
Hardware/Software Components and Applications of BCIs
7
This device has 16 input channels, which are connected over software controllable switches
to the internal amplifier stages and anti-aliasing filters before the signals are digitized with
sixteen 24 Bit ADCs. The device is also equipped with digital to analog converters (DAC)
enabling the generation of different signals like sinusoidal waves, which can be sent to the
inputs of the amplifiers for system testing and calibration. Additionally, the impedance of
each electrode can be checked by applying a small current to the individual electrodes and
measuring the voltage drops. All these components are part of the so-called applied part of
the device, as a subject or patient is in contact to this part of the device via the electrodes. All
following parts of the device are separated via optical links from the subject/patient.
The digitized signals are passed to a digital signal processor (DSP) for further processing.
The DSP performs an over-sampling of the biosignal data, band pass filtering, Notch
filtering to suppress the power line interference and calculates bipolar derivations. These
processing stages eliminate unwanted noise from the signal, which helps to ensure accurate
and reliable classification. Then the pre-processed data are sent to a controller which
transmits the data via USB 2.0 to the PC. One important feature of the amplifier is the over-
sampling capability. Each ADC is sampling the data at 2.4 MHz. Then the samples are
averaged to the desired sampling frequency of e.g. 128 Hz. Here a total of 19.200 samples
are averaged, which improves the signal to noise ratio by the square root of 19.200 = 138,6
times.
For EEG or ECoG (Electrocorticogram) recordings with many channels, multiple devices can
be synchronized. One common synchronization signal is utilized for all ADCs, yielding a
perfect non delayed acquisition of all connected amplifiers. This is especially important for
evoked potential recordings or recordings with many EEG channels. If only one ADC with a
specific conversion time is used for many channels, then a time lag between the first channel
and the last channel could be the result (e.g. 100 channels * 10 µs = 1 ms). Important is also
that biosignal acquisition systems provide trigger inputs and outputs to log external events
in synchrony to the data or to send trigger information to other external devices such as a
visual flash lamp. Digital outputs can also be used to control external devices such as a
prosthetic hand or a wheelchair. An advantage here is to scan the digital inputs together
with the biosignals to avoid time-shifts between events and physiological data. A medical
power supply that works with 230 or 110 V is required for physiological recording systems
that are used mainly in the lab. For mobile applications like the controlling a wheelchair,
amplifiers which run on battery power are also useful.
For invasive recordings, only devices with an applied part of type CF are allowed. For EEG
measurements, both BF and CF type devices can be used. The difference here is the
maximum allowed leakage current. Leakage current refers to electric current that is lost
from the hardware, and could be dangerous for people or equipment. For both systems, the
character F indicates that the applied part is isolated from the other parts of the amplifier.
This isolation is typically done based on opto-couplers or isolation amplifiers. For a BF
device, the ground leakage current and the patient leakage current must be ≤100 µA
according to the medical device requirements, such as IEC 60601 or EN 60601. These refer to
widely recognized standards that specify details of how much leakage current is allowed,
among other details. For a CF device, the rules are more stringent. The ground leakage
current can also be ≤100µA, but the patient leakage current must be ≤10 µA only.
The next important feature is the number of electrodes used. For slow wave approaches or
oscillations in the alpha and beta range and P300 systems, a total of 1-8 EEG channels are
sufficient (Birbaumer, 2000, Krusienski, 2006, Guger, 2003). BCIs that use spatial filtering,
Recent Advances in Brain-Computer Interface Systems
8
such as common spatial pattern (CSP), require more channels (16-128) (Ramoser, 2000). For
ECoG recordings, 64-128 channel montages are typically used (Leuthard, 2004). Therefore,
stack-able systems might be advantageous because they can extend the functionality with
future applications. A stack-able e.g. 64-channel system can also be split into four 16-
channels systems if required for some experiments.
The signal type (EEG, ECoG, evoked potentials – EP, EMG, EOG) also influences the
necessary sampling frequency and bandwidth of the amplifier. For EEG signals, sampling
frequencies of 256 Hz with a bandwidth of 0.5 – 100 Hz are typically used (Guger, 2001). For
ECoG recordings, sampling frequencies of 512 or 1200 Hz are applied with a bandwidth of
0.5 – 500 Hz (Leuthardt, 2004). A special case are slow waves, where a lower cut – off
frequency of 0.01 Hz is needed (Birbaumer, 2000). For P300 based systems, a bandwidth of
0.1 – 30 Hz is typically used (Sellers, 2006). Notch filters are used to suppress the 50 Hz or 60
Hz power line interference. A notch filter is typically a narrow band-stop filter having a
very high order. Digital filtering has the advantage that every filter type (Butterworth,
Bessel, etc), filter order, and cut-off frequency can be realized. Analog filters inside the
amplifier are predefined and can therefore not be changed. The high input range of
g.USBamp of ±250 mV combined with a 24-bit converter (resolution of 29 nV) allows
measuring all types of biosignals (EMG, ECG, EOG, EPs, EEG, ECoG) without changing the
amplification factor of the device.
2.3 Real-time processing environment
Physiological recording systems are constructed under different operating systems (OS) and
programming environments. Windows is currently the most widely distributed platform,
but there are also implementations under Windows Mobile, Linux and Mac OS. C++,
LabVIEW (National Instruments Corp., Austin, TX, USA) and MATLAB (The MathWorks
Inc., Natick, USA) are mostly used as programming languages. C++ implementations have
the advantages that no underlying software package is needed when the software should be
distributed, and allow a very flexible system design. Therefore, a C++ Application Program
Interface (API) was developed that allows the integration of the amplifiers with all features
into programs running under Windows or Windows Mobile. The main disadvantage is the
longer development time. The BCI2000 software package was developed with the C API
(Schalk, 2004).
Under the MATLAB environment, several specialized toolboxes such as signal processing,
statistics, wavelets, and neural networks are available, which are highly useful components
for a BCI system. Signal processing algorithms are needed for feature extraction,
classification methods are needed to separate biosignal patterns into distinct classes, and
statistical functions are needed e.g. for performing group studies. Therefore, a MATLAB
API was also developed, which is seamlessly integrated into the Data Acquisition Toolbox.
This allows direct control of the amplification unit from the MATLAB command window to
capture the biosignal data in real-time and to write user specific m-files for the data
processing. Furthermore, standard MATLAB toolboxes can be used for processing, as well
as self-written programs. The MATLAB processing engine is based upon highly optimized
matrix operations, allowing very high processing speed. Such a processing speed is very
difficult to realize with self-written C code.
Beside the MATLAB and C API it is also useful to have a rapid prototyping environment that
allows to create different BCI experiments rapidly. Such an environment was designed under
Hardware/Software Components and Applications of BCIs
9
Simulink and allows the real-time processing of EEG data. The following BCI experiments
were realized with this “Highspeed On-line Processing for Simulink” software package.
2.3.1 Motor imagery
To train a user to control a BCI with motor imagery a training paradigm is necessary that is
synchronized with the EEG data acquisition and real-time analysis. Therefore the subject is
seated in front of the computer screen where the paradigm is shown. The user has the task
to wait until an arrow pointing either to the right or left side of the screen occurs (using
bipolar EEG derivation around C3 and C4). The direction of the arrow instructs the subject
to imagine a right or left hand movement for 3 seconds. Then, after some delay, the next
arrow appears. The direction of the arrows is randomly chosen, and about 40-200 trials are
typically used for further processing. The EEG data, together with the time points of the
appearance of the arrows on the screen, are loaded for off-line analysis to calculate a subject-
specific weight vector (WV) which is used for the feedback experiment.
A Simulink model for the real-time analysis of the EEG patterns is shown in Figure 5. Here
‘g.USBamp’ represents the device driver reading data from the biosignal amplifier into
Simulink. Then the data is converted to ‘double’ precision format and connected to a ‘Scope’
for raw data visualization and to a ‘To File’ block to store the data in MATLAB format. Each
EEG channel is further connected to 2 ‘Bandpower’ blocks to calculate the power in the
alpha and beta frequency range (both ranges were identified with the ERD/ERS and
spectral analysis). The outputs of the band-power calculation are connected to the ‘BCI
System’, i.e. the real-time LDA implementation which multiplies the features with the
weight vector WV. The ‘Paradigm’ block is responsible for the presentation of the
experimental paradigm in this case the control of the arrows on the screen and the feedback.
Fig. 5. Simulink model for the real-time feature extraction, classification and paradigm
presentation
2.3.2. P300
A P300 spelling device can be based on a 6 x 6 matrix of different characters displayed on a
computer screen. The row/column speller flashes a whole row or a whole column of
Recent Advances in Brain-Computer Interface Systems
10
characters at once in a random order as shown in Figure 6. The single character speller
flashes only one single character at an instant in time. This yields of course to different
communication rates; with a 6 x 6 matrix, the row/column approach increases speed by a
factor of 6. The underlying phenomenon of a P300 speller is the P300 component of the EEG,
which is seen if an attended and relatively uncommon event occurs. The subject must
concentrate on a specific letter he/she wants to write (Sellers, 2006, Guger, 2009). When the
character flashes on, the P300 is induced and the maximum in the EEG amplitude is reached
typically 300 ms after the flash onset. Several repetitions are needed to perform EEG data
averaging to increase the signal to noise ratio and accuracy of the system. The P300 signal
response is more pronounced in the single character speller than in the row/column speller
and therefore easier to detect (Guger, 2009).
Fig. 6. Left, mid panels: row/column speller. Right panel: single character speller
For training, EEG data are acquired from the subject while the subject focuses on the
appearance of specific letters in the copy spelling mode (positions Fz, Cz, Pz, Oz, P3, P4,
PO7, PO8). In this mode, an arbitrary word like LUCAS is presented on the monitor. First,
the subject counts whenever the L flashes. Each row, column, or character flashes for
e.g.100ms per flash. Then the subject counts the U until it flashes 15 times, and so on. These
data, together with the timing information of each flashing event, are then loaded for off-
line analysis. Then, the EEG data elicited by each flashing event are extracted within a
specific interval length and divided into sub-segments. The EEG data of each segment are
averaged and sent to a step-wise linear discriminant analysis (LDA). The LDA is trained to
separate the target characters, i.e. the characters the subject was concentrating on (15 flashes
x 5 characters), from all other events (15 x 36 – 15 x 5). This yields again a subject specific
weight vector WV for the real-time experiments. It is very interesting for this approach that
the LDA is trained only on 5 characters representing 5 classes and not on all 36 classes. This
Hardware/Software Components and Applications of BCIs
11
is in contrast to the motor imagery approach where each class must also be used as a
training class. The P300 approach allows minimizing the time necessary for EEG recording
for the setup of the LDA. However, the accuracy of the spelling system increases also with
the number of training characters.
After the setup of the WV the real-time experiments can be conducted with the Simulink
model shown in Figure 7.
Fig. 7. Real-time Simulink model for P300 experiment
The device driver ‘g.USBamp’ reads again the EEG data from the amplifier and converts the
data to double precision. Then the data are band pass filtered (‘Filter’) to remove drifts and
artifacts and down sampled to 64 Hz (‘Downsample 4:1’). The ‘RowCol Character Speller’
block generates the flashing sequence and the trigger signals for each flashing event and sends
the ‘ID’ to the ‘Signal Processing’ block. The ‘Signal Processing’ block creates a buffer for each
character. After all the characters flashed, the EEG data is used as input for the LDA and the
system decides which letter was most likely investigated by the subject. Then this character is
displayed on the computer screen. Nowadays, the P300 concept allows very reliable results
with high information transfer rates (Thulasidas, 2006, Krusienski, 2006, Guger, 2009).
2.3.3 SSVEP
The SSVEP stimulation is realized with a 12x12cm box (see Figure 8) equipped with four
LED-groups containing three LEDs each. Additionally four arrow LEDs were added to
indicate at which LED the user should look during the training. The LEDs are controlled by
a microcontroller connected to the computer via USB. The accuracy of the produced
frequencies has to be very accurate to make the feature extraction more reliable (frequency
error is < 0.025 Hz).
The EEG-data is derived with eight gold electrodes placed mostly over visual cortex on
positions POz, PO3, PO4, PO7, PO8, O1, O2 and Oz of the international 10-20 system. The
reference electrode is placed at the right earlobe and a ground electrode at position FPz.
The EEG data is analyzed with several feature extraction and classification methods
resulting in a classification output for each method. Each classifier has a discrete output in
the form of a number (1, 2, 3 and 4) that corresponds to a certain LED. Finally in the last
processing stage, the change rate/majority weight analysis step adds a 0 to this set of
outputs. The device driver of the robot transforms these five numbers semantically to
Recent Advances in Brain-Computer Interface Systems
12
driving commands (0-stop, 1-forward, 2-right, 3-backward, 4-left) and sends them to the
robot, which moves and gives the feedback to the user.
Fig. 8. SSVEP stimulation box and EEG recording
The four LEDs are flickering with different frequencies (10, 11, 12 and 13 Hz). These
frequencies have been chosen in preceding off-line tests and showed good performance for
the test subjects and are also known from literature to give good accuracy (Friman, 2007).
During training the subject has to look at each of the LEDs for several seconds which are
controlled by the paradigm. Beside the EEG data also the instruction at which LED the user
should look at is logged to harddisk.
All the components of the BCI system are shown in Figure 9. EEG data are recorded with a
sampling rate of 256 Hz with the g.USBamp block. Then in the Preprocessing block
Laplacian derivations are performed. Each Laplacian derivation is composed of one center
signal
C
X and an arbitrary number > 1n of side signals
,1
, 1, , n
S
Xi
=
which are
arranged symmetrically around the center signal. These signals are then combined to a new
signal
,1 ,
( +X )
j
cS Sn
YnX X=⋅ − + where j is the index of the derivation.
Two different methods are used to calculate features of the EEG data. One is the minimum
energy approach (ME) (Friman, 2007) which requires no training. This algorithm is fed with
raw EEG-data channels since it selects the best combination of channels by itself. First of all
the EEG-data gets “cleaned” of potential SSVEP-signals. After that operation the signals
contain just the unwanted noise. Now a weight vector is generated, which has the property
of combining the channels in a way, that the outcome has minimal energy. Now SSVEP
detection is done utilizing a test statistic which calculates the ratio between the signal with
an estimated SSVEP-response and the signal where no visual stimulus is present. This is
done for all stimulation frequencies and all EEG-channels. The output of this classifier is the
index of the frequency with the highest signal/noise ratio.
As second method a Fast Fourier Transformation (FFT) and linear discriminant analysis
(LDA) using the Laplacian derivations is used. First of all the incoming data gets
transformed to the frequency spectrum with a 1024-point FFT. A feature vector is extracted
by taking the values of the stimulation frequencies and their 1
st
and 2
nd
harmonics. With
Hardware/Software Components and Applications of BCIs
13
Fig. 9. SSVEP Simulink model. g.USBamp, Preprocessing, Classification ME (Minimum
Energy)/LDA and Changerate/Majority Analysis blocks perform the real-time analysis of
the EEG data. The block Paradigm controls the training sequence of the LED Stimulation.
Beside LEDs also the computer screen can be used as stimulation unit. Furthermore EEG
data is visualized and stored
these feature vectors a weight/bias vector must be generated for each user in a training
procedure. When the training was completed successfully the LDA classifier can then be
used to classify new feature vectors to one of the stimulation frequency indices. In the model
used for the experiments described in this paper four ME classification units and four
FFT+LDA classification units were used with different EEG channels as inputs.
The last step is a procedure called change rate/majority weight analysis. By having multiple
classification units configured with slightly different input data there will be in general
random classification results on noise input. This effect is used on one side to produce a zero
decision when the outputs of the classifiers are changing heavily and are very different. On
the other side a low change rate and a high majority weight (the number of classifications of
the different algorithms which are pointing in the same direction) can be used to strengthen
the robustness of the decision. Calculation is made on the last second. Default thresholds of
0.25 for change rate and 0.75 (1 – all outputs are pointing into the same direction) for
majority weight were used.
The first step of the procedure is to look at the change rate. If it is above the threshold the
procedure returns a final classification result of 0 which corresponds to a stop command.
Otherwise, if it is below the threshold the next step is to look at the majority weight. If this is
above the threshold the majority is taken as final result, otherwise the final output is again 0.
The final classification is then sent to external device such as a robot.
3. Accuracies achieved with different BCI principles
Results are presented of 81 subjects who tested a P300 based system, of 99 subjects who
tested a motor imagery based BCI system and of 3 subjects who tested a SSVEP based
system.
The subjects participating in the P300 study had to spell a 5 character word with only 5
minutes of training. EEG data were acquired to train the system while the subject looked at