DMIC2059 ANALYTICAL INTELLIGENCE: BASICS, MARKET DIRECTION, STRUCTURE LOGIC, ZOOM OUT IN, TIME TEAMS, TIME PRICE, AND KEY NOTES
Bạn đang xem bản rút gọn của tài liệu. Xem và tải ngay bản đầy đủ của tài liệu tại đây (1.19 MB, 26 trang )
<span class="text_page_counter">Trang 1</span><div class="page_container" data-page="1">
<b>Keeping it simple ! </b>
Below are the basics for understanding DMIC2059 analytical intelligence. Express Manuals and ‘Compilation’ examples cover the software mechanics in detail.
• Market Direction • Structure & Logic • Zoom out & Zoom in • First look at Time Teams • Time & Price
• Basics Summary & Over-view; Time Team simplified visual structure • Basic notes
<b>Market Direction; </b>
• Is indicated in the Structure & Logic of each day’s Daily Matrix Island Combination or DMIC. This is highlighted on the chart by a blue rectangle named R#1. R#1 engulfs the three red code lines that make up the Daily Matrix Island Combination recorded in the Panel’s first heading ‘DMIC.’ Using the combination of the code lines plus the measured ‘Ranges’ engulfing the code lines, a preferred directional bias for the market, plus preferred Time & Price activity is projected. • The fourth code line under ‘DMIC’ is the Dy-C line, the magenta line. This is an existential part of
the Dmic analysis, it might be inside Dmic R#1 or outside Dmic R#1. The AM Dy-C rolls-over in the PM market to become the new Dy-C. Or it might be a ‘Duplicate’ with one of the red code lines.
<b>Structure & Logic; </b>
• Dmic 3 red lines + magenta line form the Structure, Scaffold and Logic of each day’s market.
<b>Zoom out & Zoom in; </b>
• Zooming-out we see the basic directional intent of the market. In the chart below, the top panel heading is ‘DMIC’ with the indicator ‘Classic Up’ - projecting the key movement direction is bullish. The next Panel heading is ‘Ranges” and the measure is ‘Full’ – meaning at least 5.5 ES
<b>points in range - this projects Time Momentum expectations for this pattern. </b>
• Zooming- in we see instant market movements. The market’s ropes and pulleys do not usually move in one direction. So if we are looking at a bullish projection, where might we buy dips - or might we wait for a Break-Up above R#1 High prices to signal the up-side movement is on?
</div><span class="text_page_counter">Trang 2</span><div class="page_container" data-page="2"><b>• Time Teams; </b>
<b>• Dmic’s proprietary ‘Time Teams’ indicate the immediate position of the market relative to the Scaffold of the market. </b>
• There are various Time Teams, but the key Time Teams are the Orange Bars and the Grey Bars on the chart.
• Another key price point is YH (prior day High) or YL(Prior day Low) yellow lines.
• To the left side of the chart are Prices from the prior 7-10 days. The three main prices are; a) prior week high & low (W-Green),
b) the key prior Dmic(M-Black) c) the prior day Dmic (Y-Red).
When ‘in play’ for example as a Duplicate with current indicators; or serving as a ‘notice’ at the ‘First Test’ of ‘W-Green’ in a new week ; or when the current intra-day market -DMIC (R#1) - is engulfing W-M-Y prices – momentum is added to an R#1 break-out.
• The key Panel Prices showing Support and Resistance levels 1-2- 5 & key AAA Support &
Resistance levels are calculated at the 10.30amet open, & recorded on the left side of the chart at the relevant price level.
• A ‘PANEL HIGH’ indicator is recorded above the relative Panel price. This can be S/R levels 3 or 4, the software will recognize this and include S/R levels 3 or 4 in its’ PANEL HIGH analysis.
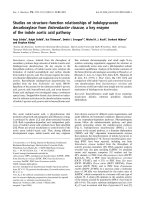
• The Dmic pattern analysis, projects the Time & Price movements expected from each day’s R#1 structure. The chart example below is a straight-forward study of the Dmic Indicators ;
</div><span class="text_page_counter">Trang 3</span><div class="page_container" data-page="3">• On the Chart below;
• Four green arrows indicate Buy positions; 1 Red arrow indicates Sell position; We reached the analysis to BUY based on the Panel indicator ‘DMIC’ plus ‘Ranges’ in the Panel.
• The DMIC signal is explicit - ‘Classic Up’ -
<b>• ‘Ranges’ signals ‘Full’ - indicating a normal progression in TIME & PRICE is expected. • Please note there is NO ‘Neutral’ signal under Ranges, which is a key Contextual note. </b>
• The first BUY is signaled by the LOD software indicator , printed live on the chart below the first Orange Time Team Bar.
• As this is a Classic Up projection, we are looking to buy Dips and/ or break-ups of R#1. • LOD stands for ‘Low of the Dmic Day’ and is projecting a market reverse from this low to the
upside. The LOD signal is purely Time Based, but on this chart it coalesces with a key price on the light orange line ‘FHHL’ or first half hour low.
• The ‘Classic Up ’ pattern is projected to bounce-up off the FHHL below R#1 High.
• The LOD signal engulfs two signals , both Time (LOD) & Price at the FHHH.
• The position of YH (yellow Line) is also an important element of support for this indicator. • The next (or preferred) comfort level is when the market closes above R#1 high.
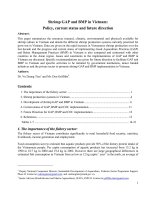
</div><span class="text_page_counter">Trang 5</span><div class="page_container" data-page="5">• The first green arrow indicates the LOD – Rally signal on a Classic up chart;
• The next indicator waits for Time & Price to coalesce. The next half hour bar open at 11.30amet opens and closes above the high of R#1. There are two buy options, the test back close to the C1 red line &/or above the break-up price L1 3371.75 shown in the Panel under the heading DMIC Up/Down.
• The new Orange bar at 1.05pmet, opens and closes above R#1. This confirms the bullish direction is projected to continue. The market tests back to the high of the R#1, and the
<b>bounces-up off the ‘re-test’ of R#1 high. Further confirmation for this projection is that NO NEUTRAL indictor is present under ‘Ranges’ – therefore R#1 High is a ‘Defensible Line’ that </b>
becomes an ‘Offensive’ position. A Buy MIT at R#1 High, with a ‘Stop Loss’ placed below R#1 High produced a good result.
• The new PM Magenta line is also above R#1. When the PM Orange Team plus the new Magenta Line are both above R#1 , a bullish continuation is signaled.
• If Context is not in line with the Orange Time Team Signal – as it was on this chart - waiting for the next Time Team signal at the new Magenta line is reasonable.
• The next BUY indicator is the grey bar open and close above the new roll-over PM Magenta line. • The market continues to rally until the next Orange Time Team Bar, which signals HOD, or high
of Dmic Day , this is a reverse indicator signaling SELL. It signals
a) to ‘protect’ Buy gains.
b) a preference not to buy in this context
c) Sell with tight stop if comfortable with market context
<b>• Understanding the ‘Context’ of the market at any time, is similar to identifying the ‘GPS’ position while driving. Is there an outstanding objective? </b>
• The example shown is a straight forward example for initial clarity. We will look at the nuances of ‘Context’ including GPS market positions as we continue through the Manuals & Compilations
</div><span class="text_page_counter">Trang 6</span><div class="page_container" data-page="6"><b>Next; some key notes and useful Tables; </b>
<b>• Duplicates </b>
<b>• Defining Classic & Non-Classic R#1 </b>
<b>• Wave Preference regarding Combination and range – One wave in each 30 minute bar • R#1 Combination and range Matrix with preference </b>
<b>• R#1 – R#2 – R#3 </b>
<b>• YH & YL relationship to R#1 • HOD & LOD Indicators • Time Teams </b>
</div><span class="text_page_counter">Trang 7</span><div class="page_container" data-page="7"><b>Duplicates , </b>
• when two prices match each other to within about 1.8 ES points (or equivalent 9% of DAR on all charts ) these are key Indicators; The most important duplicates are those of the four Dmic prices; Mn-Io-C1-Dy---What do we project will happen with these duplicates?
<b>• Dy-C Duplicates; </b>
These are obvious on the chart when the Magenta Line and the red lines are close. Dy-C duplicates are also noted under the Panel heading DMIC and under Panel heading ‘Vs Island’
<b>Dy-C - Mn ; Dy-C - Io ; Dy-C - C1 </b>
Each duplicate is projected to hold back the market, and for the market to REVERSE. This is best in a ‘Full’ R#1.
The strongest duplicate is when the AM Dy-C duplicate is at the HIGH OR LOW of any R#1-
<b>A new DY-C duplicate may form at the PM roll-over time, which is a significant Duplicate. </b>
<b>• R#1 Duplicates </b>
<b>MN – C1 Market projected to break past this duplicate, past C1 - may return in the PM. </b>
<b>Io-Mn Prefer hold & big & possibly quick push past C1 </b>
<b>Io-C1 Unpredictable, may return PM </b>
<b>• Another set of key duplicates form when the LOD or HOD signals register as Duplicates with any of the Dmic lines; or with specific price levels on the left side of the chart such as PANEL High + HOD </b>
<b>• Or with the YH (prior day high)or YL(prior day low) yellow lines </b>
<b>Part of the Manual list contains “Compilations’ with most charts from September 2021 on. There is a ’Compilation’ file titled ‘Duplicates’ for more details. Similarly a ‘Compilation’ file ‘Dy-C-RXX provides additional analysis of the Dy-C Magenta line. </b>
</div><span class="text_page_counter">Trang 10</span><div class="page_container" data-page="10"><b>• Only one wave break is counted in each 30 Minute Bar </b>
In the Matrix chart below, the preferred Trend & Non-Trend Days are color coded. Red = Prefer Sell
Green = Prefer Buy
Blue = a C1 Mid format ; or a Doji Day ;
More details in relative Manual & Compilation Files.
</div><span class="text_page_counter">Trang 11</span><div class="page_container" data-page="11">Daily Matric Island Combination Table; • Ranges across the top;
• R#1 Combinations on the side • Thicker lines = stronger projections
</div><span class="text_page_counter">Trang 12</span><div class="page_container" data-page="12"><b>• The three key rectangles that form on the chart are; </b>
<b>R#1 Mn-Io-C1 rectangle engulfs the full range of any combination </b>
<b>R#2 Engulfs the 1.30pmet to 2.30pmet high and low </b>
<b> R#3 Rectangle only appears when recognized action happens in the first hour of trading. </b>
<b>• A break-out of these rectangles is indicated by a close of a 5 min bar above the </b>
<b>high(low) of the rectangle. Generally the first close above Rectangle #1 will result in a test back to the high(low) of R#1. </b>
<b>• A first 5 min bar close above R#2 is also likely to see a reverse back to the next major </b>
<b>support line, or to the new pm Dy-C line. </b>
<b>• Time momentum is preferred to support a break-out of R#2, example is a new 30 min </b>
<b>bar open, or an orange or grey time team bar pushing past R#2 high or low. Context is relevant in the over-view of this possibility. </b>
<b>• R#3 pushing out of only one end of the R#1 indicates a preference for the market to </b>
<b>break-out on the end outside of R#1; In addition in (for example) a Classic Up signal, the market may be supported at the low end of R#3. </b>
<b>• Context, out-standing objectives & GPS Market position, is always relevant </b>
</div><span class="text_page_counter">Trang 13</span><div class="page_container" data-page="13"><b>• Watch for two HOD or LOD signals within 30 Minutes of each other; the two key Time </b>
<b>Teams for this are; (Refer to Compilation- ‘2 x Consecutive LOD HOD ‘ for more detail) </b>
<b>i)HOD/LOD at 1.05pmnet Orange Bar plus the new 1.30pmet Magenta Bar </b>
<b>• In reviewing this particular set-up questions are </b>
<b>a) have the Panel high(low)objectives been met </b>
<b>b) Are the Orange and Magenta Line Dy-C above YH(below YL) </b>
<b>c) Safest, if uncomfortable, to wait for a close below(above) the Dy-C after </b>
<b>1.40pmet+ if comfortable, or wait for a new 5 minute bar open below (above)Dy-C after 2.05pmet. </b>
<b>ii)The Second key Time Team is the </b>
<b> 3.05pmet Orange Bar plus the 3.30pmet Grey Bar… </b>
<b>• if these both signal HOD(LOD) … at the high….it is </b>
<b>a) Projected to be safest NOT to buy again…..if long at this high, suggestion is to bring your Stop loss up quickly to protect buy gains. </b>
<b>b) HOD Projects Sell at 3.30pmet Grey bar </b>
<b>• Mirror this projection at the low end -LOD </b>
<b>a) Safest to abandon bearish intentions and not ‘sell’ again, suggest you bring stop loss down quickly to protect sell gains. </b>
<b>b) Projected to Buy at 3.30pmet Grey bar </b>
<b>c) Entering the 3.30pmet time zone the market can accelerate and whip-saw (particularly if Neutral-BremR ‘Ranges’ signal in play - a late whip projected) </b>
<b>• The ‘Late Trade’ is a close above(below) the Orange + Grey bar highs/lows- best if </b>
<b>coalesces with 2 x HOD or 2 x LOD signals. Be extra careful in this late Time Zone. </b>
</div><span class="text_page_counter">Trang 14</span><div class="page_container" data-page="14"><b> </b>
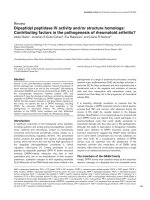
<b>Chart example below- HOD signals </b>
<b>• Depending on context a Sell (Buy) reverse is preferred. Keep a tight stop </b>
</div><span class="text_page_counter">Trang 15</span><div class="page_container" data-page="15">Notes;
• <b><sub>100% above YH ‘Ranges’ </sub></b><sub>signal ‘ projects looking for ‘buy positions – </sub>
• <b><sub>100% below YL projects looking for Sell positions.. </sub></b>
<b>• Dy-C ; the </b>
<b>‘FIRST TEST’ </b>
of the AM Dy-C is likely to result in a reverse bounce.• As with the Dy-C above, the
<b>‘FIRST TEST’</b>
<b> of DMIC 3 red lines , YH & YL, Prior week (W) & other major chart lines(detailed in Express Manuals) are likely to result in a FIRST TEST reverse. </b>The second test of these lines may or may not give way depending on the DMIC/Range signals.
• The market will often check back to the prior day R#1
<b>• Classic Up - buy times and Classic Down sell times are reviewed in ‘Matrix Chart Compilations’ • Where objectives are met in the am session, the pm session may reverse. </b>
• The key objective is for each trader to recognize & prioritize their preferred Day type Set-ups- & the Time & Price Signals within each day’s indicators, R#1 patterns and set-ups;
• & to become an expert in your own ‘Play-book’ choices
<b>• Please have patience to wait for Defensible Lines, (Compilation </b>
’Overview & Defensive Line Theory’)
• let the market come to you - prefer not to chase - there is always another trade, another Time Team signal
• Protect your capital
</div><span class="text_page_counter">Trang 16</span><div class="page_container" data-page="16">Over-view of chart lines and labels.
A) The 3 red lines that form R#1 or Rectangle one, are the Structure or Scaffold for the day B) The Dy-C is an existential part of the Structure, we need to know it’s relationship to R#1 C) The Prior day High(YH) or low(YL) is also an important part of the new day
<b>D) The market will gravitate around this Structure/Scaffold </b>
E) Under Panel Headings Dmic & Ranges; The projected ‘Logic’ of the day is defined; the preferred direction of the main movement of the day projected.
<b>F) Time & Price Momentum is based on the ‘Logic’ of DMIC, R#1 & Ranges </b>
<b>G) Time Teams are the on-going checks and balances through the day. Where are the ‘Time Teams’ in relation to the Structure/Scaffold. </b>
<b>H) What is the GPS market position? Are there outstanding objectives? </b>
I) Patience may be required for the market to fall into sync; At times a ‘break-out’ held back - is ‘later & longer & fast’ (chart example below)
J) An end of day audit check may often find the analytical signals of ‘DMIC & Ranges’ played out; (Compilation ‘GPS-Critical Path Objectives’)
<b>K) USE DEFENSIBLE LINES; The Structure/Scaffold of R#1(Rectangle#1) ; & Dy-C- are major </b>
defensible lines, as are YH-YL yellow lines; Make sure you have a Defensive Position – a stop loss in place – when entering a trade.
<b>L) Defensive lines include the following lines and any key DUPLICATE; such as </b>
i) red line duplicates from R#1 or ii) Dy-C Duplicate with any Red line
iii) HOD-LOD duplicate with any key line or price
iv) YH/YL duplicate with any key line or Time Team signal
v) High-Low of initial a.m Orange Time Team bar (Tan High or Tan Low)
</div><span class="text_page_counter">Trang 17</span><div class="page_container" data-page="17"><b>M) Context is always key; be in touch with the character of each day’s market; </b>
<b>N) what has happened-what has not yet happened- follow the checks & balances of the Time </b>
Teams.
The Time Team signals are the latest information. Is the ‘latest’ Time Team Signal a short term counter wave signal or
<b> Given the Structure and Logic of the day Is the current Time Team signal </b>
•
<b>The Last High of the Day HOD or the last low of the Day LOD –</b>
is the signal ‘in sync’ – does it fit Structure/Scaffold, DMIC & Ranges Logic?O)
<b>Cross Market Signals; If all charts (ES-NQ-RTY) are signaling HOD =reverse </b>
down(LOD-Reverse Up) it’s best not to ignore this signal .
P) There is a tendency for the market to check back to the prior Orange bar, prior to moving on.
Q) DMIC Up/Down notes the relationship between, for example, the red Sell price L1 and the Support level for the L1 Sell price. Similarly for L2
R) Daily Range Meter shows prior day range and average ranges over more days
<b>Chart below shows a ‘Prefer Down’ DMIC , but it was not until an HOD signal after 1pmet,this objective was fast filled. </b>