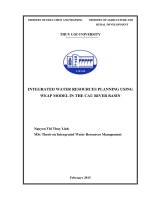
Thesis of master degree: Water balance in the Huong river basin in context of climate change
Bạn đang xem bản rút gọn của tài liệu. Xem và tải ngay bản đầy đủ của tài liệu tại đây (4.81 MB, 98 trang )
<span class="text_page_counter">Trang 1</span><div class="page_container" data-page="1">
THUY LOI UNIVERSITY
ý" % | L\Ê ĐÀ (&tukv
WATER BALANCE IN THE HUONG RIVER BASIN IN CONTEXT OF CLIMATE CHANGE
NONG BAO ANH
MSc Thesis on Integrated Water Resources Management
May 2015
</div><span class="text_page_counter">Trang 2</span><div class="page_container" data-page="2">WATER BALANCE IN THE HUONG RIVER BASI
CONTEXT OF CLIMATE CHANGE
‘Major: Integrated Water Resources Management
THESIS OF MASTER DEGREE
1. Assoc. Prof, Nguyen Thu Hien 2. Dr. Ngo Le An
This reseacrch is done for the partial fulfilment of requitement for Master of Science Degree at Thuy Loi University
(This Mater Programme is supported by NICHE ~ VNM 106 Project)
May 2015
</div><span class="text_page_counter">Trang 4</span><div class="page_container" data-page="4">1.5, Structure ofthe thesis 18 (CHAPTER 2: LITERATURE REVIEW. 19
2.1, Water allocation: An overview. 19 2.2 Integrated Water Resources Management 20
2.3. Climate change impacts on water resources. 2 2.4, Climate change scenarios. 24 2.5, Models for IVRM 26
(CHAPTER 3: DESCRIPTION OF STUDY SITE 32 3.1, Geographical location and topography 32
</div><span class="text_page_counter">Trang 5</span><div class="page_container" data-page="5">CHAPTER 4: WATER BALANCE SIMULATION FOR THE HUONG RIVER BASIN
4.1, Schematization of the Huong River Basi,
4.3. The computation of scenarios.
CHAPTER 5: RESULTS ANALYSIS
5.1, Water supply and water requirement results.
</div><span class="text_page_counter">Trang 6</span><div class="page_container" data-page="6">Water is essential for human, however, is finite and vulnerable (ICWE, 1992). In recent years, water crisis has been singled out as a major worldwide concem. World-wide water demand has been reported to increase by over six times during, the last century (Gourbesville, 2008). It is claimed to be the consequence of growth ăn world population, which has been tripled during the last century, and speedy industry enlargement as well as agriculture development. As a result, developing countries are those who mostly have to face with water scarcity. Moreover, in recent years, the impacts of climate change on water scarcity have become an emerging concerned. Extreme weather events, increasing uneven distribution of seasonal water leading to drought, floods and, for example, are some negative impacts of climate change, which has been alarmingly threatening the water balance
in developing countries.
‘This research investigates the water availability and water demand in Huong River Basin in order to find out appropriate management measure to mitigate the water shortage problem in dry season.
Huong River Basin which lies within Thu Thien Hue province, located in the specific monsoon climate area of Central Part of Vietnam with severe hydrological regime: very long dry season, short rain season but often with very large runoff. This area usually witn season, Bearing the stress water shortage in the long dr
of explosive inc se of water demand from excessive population growth and blossoming economic development, combined with the decrease of water supply in dry season as a result of climate change impacts, the Huong River Basin’s water ‘management need to be exquisitely investigated
‘The water use activities in this basin inelude domest livestockinrigation, industr and aquaculture, The purposes of this study are to analyze the water balance of Huong River Basin in three scenarios, the current scenario in 2010 and the future scenario in the future with the projected socio-economic development as well as
</div><span class="text_page_counter">Trang 7</span><div class="page_container" data-page="7">‘changes in the climate system characteristic according to B2 scenario. To complete this task, the WEAP model is implemented to simulate the water balance in the basin with the help of MIKE-NAM model to calculate the water inflow to river basin from rainfall data and CROPWAT to compute the water requirement for crop.
‘The research shows there are currently imbalances between water supply and water ‘demand in the dry season especially in March and April. In 200, the system cannot supply sufficient water quantity for the projected growing demand of socio-‘economic development scenario in June and July which are in dry season, right after the periodic flood, The unmet demand is slightly go up compared to the current scenario, However, the situation is much more severe in the scenario in which the climate change impacts are considered. The water deficit is about four times bigger than it was in the scenario which only reflects the socio-economic development. Moreover, it appears from February to July within different areas.
After analyzing the results of simulation models, several structure and non-structure solutions are proposed,
</div><span class="text_page_counter">Trang 8</span><div class="page_container" data-page="8">Thereby certify that the work which is being presented in this thesis entitled, “Water balance in the Huong River Basin in context of climate change” in partial fulfillment of the requirement for the award of the Master of Science in Integrated Water Resource Management, is an authentic record of my own work carried out
‘The matter embodied in this thesis has not been submitted by me for the award of any other degree or diploma
Date:
</div><span class="text_page_counter">Trang 9</span><div class="page_container" data-page="9">| would like to express my deep gratitude to many people who helped to complete this Thesis at its best.
First and foremost I wish to thank to my supervisor, Associate Professor Nguyen ‘Thu Hien, Dean of Thuyloi University's Water Resources Engineering Faculty, for her instruction, understanding and also, patience during the time I conducted this ‘Thesis. With her considerable guidance and shared experience from many year of being water resources expert, I am able to bring this research into fruition However, it is not only just during this time she is supporting me, but also forall the way long of seven years I have leamt in this University from my Bachelor Degree to this Master course, she always be there willing to instruct me about professional researching skills, turning me into an independence thinker which assists me to
grow as a lecturer, a researcher and a better learner.
1 would also wish to express my deeply gratefulness to my second supervisor, Doctor Ngo Le An, who is the Deputy Head of Thuyloi University's Hydrology and Water Resources Division for his tutor and corrections in the application of simulation models, the field which I had very few experience. His mentorship was
paramount in providing a well rounded experience consistent my long-term career
goals. He was the one to point out for me the importance of balancing thetheoretical knowledge and ability to mastering in models use in Water Engineering
and Water Management, at the same time, was the one enable me to do so. He ‘encourages me to run all the models used in my thesis on my own but was always there as a blanket to help me to learn from mistakes, I am not sure many postgraduate students are given such treasured opportunity like mine.
For everything you have done for me, Assoc. Prof. Hien and Dr. An, I thank you.
1 would especially like to thank the Management Board including members from ‘Thuyloi University, Hanoi University of Natural Resources and Environment
</div><span class="text_page_counter">Trang 10</span><div class="page_container" data-page="10">University and UNESCO-IHE for organizing this wonderful Master course and
providing me a chance to sharpen my professional knowledge,
Many thanks to my colleagues in the Department of Climate Change and Sustainable Development, HUNRE where Ï am working for supporting me in many way during the time I am busy with my Thesis.
1 would also like to acknowledge my friends from Thuyloi University including Ms. Dao Thi Xuyen, Mr. Nguyen Son Tung and many others for t ir help with the preparing input for models.
Finally, words cannot express how grateful T am to my parents and my girlfriend ho is currently staying in England for theirs unwavering support and continuous ‘encouragement throughout my year of study and through the process of researching and writing this Thesis. This achievement would not be possible without them, thank you.
</div><span class="text_page_counter">Trang 11</span><div class="page_container" data-page="11">ABBREVIATIONS
CMS Cubic Meter per SecondDARD _ Department of Agriculture and Rural Development HRB Huong River Basin
FAO Food and Agriculture Organization
Gwe bại Water Partnership
HUNRE Hanoi University of Natural Resources and Environment
IMHEN Institute of Meteorology, Hydrology and Environment
IWRM —— Integrated Water Resources Management
MONRE Ministry of Natural Resources and Environment
MARD Ministry of Agriculture and Rural Development
MCM Million Cubie Meter
Mw MegaWate
NCAP the Netherlands Climate Assistance Program
NWC National Water Commission
TLU ——ThuyLoi University
uN United Nation
VNCID Vietnam National Commission on Irigation and Drainage
WRS Water Resources System
</div><span class="text_page_counter">Trang 12</span><div class="page_container" data-page="12">LIST OF FIGURES
Figure 1.1: The location of Huong River Basin, B
Figure 2.1: Cycle diagram of climate change impacts. 2B
Figure 2.2: The Schematization of Huong River Basin, 28
Figure 2.3: The general structure of NAM model (Nielsen & Hansen, 1973)... 30
Figure 3.1: Huong River Basin 3
Figure 32: The annual average rainfall of observe stations 36
Figure 3.3: Monthly average rainfall of observed stations a7
Figure 34: The annual runoff in the petiod from 1977 to 2010 38
Figure 35: Monthly inflow to the basin in the period 1977-2010, 39
Figure 3.5: Map of cultivated area ane)
Figure 41: Schematization of Huong River Network as
Figure 4.2: Map of 9 sub-basins in the Huong River Basin 49
Figure 4.3: The variance between observed and simulated discharge in Thuong,
Figure 8.1: The inflow to branches in 2010, 68
Figure 52: Water roqutements by sectors in 2010, SCI scenario. «
Figure 5.8: Unmet demand by months in 2010, SC1 scenario. 70
Figure 5.4: The monthly inflow to the upstream area of Bo River in SCI scenario n
</div><span class="text_page_counter">Trang 13</span><div class="page_container" data-page="13">FigureS.5: The monthly water requirement of upstream Bo River Agriculture area in SCI seenario... : 7
Figure 5.6: Ta Trach Reservoirs Hydropower turbine flow and power generation, 73
Figure 5.7: BinhDien Reservoir hydropower turbine flow and power generation.74
Figure %8: Huong Dien Reservoir hydropower turbine flow and power
generation. kì
Figure 59: The total inflow in 2010 in SC2 scenario. 16
Figure 5.10: The unmet demand in 2010 in SC2 scensrio... _.
Figure 511: Monthly inflow lo region in 2010 in SC2 scenario 1
Figure 5.12: Monthly unmet demand in 2030, SC3 scenari.... số
Figure 5.13: The changes in the inflow of SCA scenario compared to SC3 scenario,
Figure $.14: Monthly unmet demand in 2030, SC4 scenario, 82
Figure $.15: Monthly inflow to the area. 82
</div><span class="text_page_counter">Trang 14</span><div class="page_container" data-page="14">LIST OF TABLES
Table 2.1: The changes in average temperature (°C) compared to the period
1980-1999 in Thua Thien Hue province by seasons in B2 scenario, 25
Table 2.2: The changes in average rainfall compared to the period 1980-1999 in ‘Thua Thien Hue province by seasons in B2 scenario 26
Table 3.1: Monthly average temperature in Huong River Basin from 2009 to 2012 34
‘Table 3.2: Average humidity in Huong River Basin from 2009 to 2012 3
‘Table 3.4: Mean evaporation in Huong River Basin from 2009 to 2012...34
Table 3.5: Hydrological and hydro-metcorological stations network in the Huong
River Basin 38
Table 36: Average population by Gender and by District in 2010, 40
Table 3.7: Average population by Distt from 2009.2012. 40
Table 3.8: Location and area of industial zones 4
Table 41: Description of sub-basins so
Table 4.2: NAM parameters explanation and boundaries (Shamsudin & Hashin
2002) sĩ
Table 4.3: The reliability of Nash coefficient 2
Table 44: Calibrated parameters. 32
Table 45: Nash coefficient 33
Table 46: Vietnamese standatd for domestic water use. 56
Table 47: Vietnamese standard for livestock consumption 37
Table 4.8: Water requirement for aquacultare 58
Table 4.9: The scenarios development 59
</div><span class="text_page_counter">Trang 15</span><div class="page_container" data-page="15">‘Table 8.1: Population by District in 2030 64
‘Table 5.2: The increasing rate of the amount of livestock
"_-Table 5.3: Monthly water requirement of nodes in SCI and SC2 scenario. 67
‘Table 5.4: Monthly water requirement of nodes in SC3scenatio... 67
Table 5.5: Monthly water requirement of nodes in SC4 scenario... 67
‘Table 5.6: Comparison of water requirement by sectors between SC2 and §C3 79
‘Table 5.7: Comparison of water requirement by sectors between SCI, SC3 and SC4 —-... ¬..- 81
</div><span class="text_page_counter">Trang 16</span><div class="page_container" data-page="16">CHAPTER 1: INTRODUCTION
1.1, Background
Huong River, with its length of 128 km, is the largest river system in Thua Thien Hue province. The river lies within the province and covers 3/5 of the total area which is the consist of Nam Dong, Huong Thuy, Huong Tra, Phong Dien District, part of A luoi, Quang Dien, Phu Vang, Phu Loc District and Hue city. The drainage
area is 3000 kh, In 2010, the population of Huong River Basin is about 1,137,962
people, most of them are living in the rural area which accounted for 92% of the
population. The topography of the river basin is complex including mountainous
area, hills, lagoon, coastal plain and coastal sand dune. Huong River is the main water source in this province which supplies water for almost all domestic usage and economic development activities.
5 = =F
Figure 1.1: The location of Huong River Basin
</div><span class="text_page_counter">Trang 17</span><div class="page_container" data-page="17">1.2. Problem statement
Huong River basin lies in ‘Thua Thien Hue Province, which located in the specific monsoon climate area of Central Part of Vietnam with severe hydrological regime: very long dry season, short rain season but often with very big flow and discharge. Every year, this area has to bear number of extreme weather events such as typhoons, tropical cyclones which bring heavy rain with high density. Moreover, the topography of the basin changes rapidly from the upstream high mountain zone down to the plain and large lagoon system, with hardly any transition area. This results in a high runoff in the rainy season, and large floods and inundations downstream. The annual average rainfall of this basin is 2800-3200 mm; however, nearly 80% of rainfall concentrates in the 4 months of rainy season causing uneven water distribution in the research area, Additionally, the high temperature in dry season also increases the chance of losing water through evaporation. Many reservoirs had been built to mitigate the water shortage in dry season by storing water from the rainy season, Nevertheless, water shortage in dry season is still appeared as an emerging issue.
Besides, the population growth and the development of water demand in every sector in this area leading to extremely high competing requirements of different stakeholder which exaggerate the water shortage status and intensify the pressure on water management tasks. Also, Tran Thục (2010) proved in his project “Impact of climate change on water resources in the Huong River basin and adaptation measures” that the decrease of rainfall results in the decline of river flow in dry season and the increase of evapotranspiration due to higher temperature is appeared in most of the climate change scenarios,
All of the water use activities in Thua Thien Hue province, consisting irrigation, aquaculture, domestic, livestock, and industry as well as power generation depend
mainly on Huong River. There are currently large between water availability and water demand in this region as the existing system cannot supply
</div><span class="text_page_counter">Trang 18</span><div class="page_container" data-page="18">sufficient water for all stakeholders in dry season; as well as the exaggerated situation might appear in the future under the pressure of inereasing demand and negatively influences on water supply due to climate change impacts. To deal with this set of troubles and moving toward a sustainable society, there is a new paradigm which was proved ils effectiveness in many regions with the similar situation such as South Africa, Myanmar, ete... with s own holistic approach, Integrated Water Resources Management (TWRM). As there are inter-links between all sectors to the Water Resources System (WRS) (Armell, 1999), as well as the lose interaction from the three components of WRS itself, the holistic approach of IWRM offers an ultimate solution to ease the increasing water scarcity for developing countries. However, before drawing any optimal solutions and specific strategy for planning, IWRM requires huge numbers of exquisite analysis of WRS ‘components. Therefore, this study was brought out in order to contribute to IVRM planning with an insight of the balance between water availability and water ‘demand among different stakeholder at the present as well as in projected future scenarios under climate change context, Then, management measures will be proposed after considering changes within problems. To achieve this goal, hydrological model MIKEII-NAM, Crop water requitement simulation model CROPWAT 8.0 and river basin simulation model (WEAP) are employed to address the impacts of changing water availability and water demands under different
1.3, Research questions
Several main questions have to be answered in order to clarify the issue for the purpose of bringing out water management measures
1, What is the water shortage in each region of the river basin currently and
2. How social-economic development can affect water shortage status in the river basin?
</div><span class="text_page_counter">Trang 19</span><div class="page_container" data-page="19">3. How climate change impacts can affect the water shortage status in the river basin?
4, What are the recommended solutions to mitigate the water shortage in dry
season with the consideration of climate change scenario in 2030? 1.4, Methodology
In order to carry out this research, relevant data and information in the study area
must be collected, analyzed and simulated, Basically, the data collection comprises
(1) time series of the river discharge; (2) water demands of all water use activities in
each region, including agriculture, aquaculture, domestic, livestock, industry and
‘environment in the present and the forecast of those water use activities inthe future ‘under Climate Change Scenarios; (3) the characteristics of the infrastructures in the basin such as reservoirs (initial water level, operational rule curves, stage-area-volume curve, time series of rainfall and evaporation, linkages to users, priority of
delivery, linkages to upstream). The set of information included the potential
‘proposed measures that can be implemented to mitigate water shortage status in dry
season of research area. The methodology applied to conduet the Thesis can be
summary in the following framework
Data analysis. Devoloping.
and simulation scenarios
Proposing management
measure
</div><span class="text_page_counter">Trang 20</span><div class="page_container" data-page="20">‘The approach of the study is using models to simulate the water status in Huong River Basin, therefore, a conceptual framework of basic step (0 apply models was developed.
The focus is on WEAP model” simulation; however, itis possible only when the input data of water supply and water demand are carefully evaluated. The water supply input is the runoff calculated by MIKE-NAM. The water demand input isthe ‘combination of the requirement of five main water use sectors, including irigation
mputed by CROPWAT 8.0 as well
requirement which wa s domestic, livestoc! industry, aquaculture which were evaluated based on Vietnamese statistic yearbook and Vietnam standard. After that, WEAP was applied to examine the current water status in 2010 as well as alternative projected situation in 2030 based on developed scenarios both with and without the changes of climate system.
</div><span class="text_page_counter">Trang 21</span><div class="page_container" data-page="21">1.5. Structure of the thesis
‘This thesis is divided into six main chapters including the introduction, literature review, the description of study a the simulation of water balance in Huong, River Basin, the result analysis, and finally, the conclusions and recommendations.
Chapter I: The chapter provides a brief overview of the physical characteristic of Huong River Basin as well as brings out the problem statement about water resources management in the basin. In addition, a set of research questions which objectify the purpose of the research and the methodology are also mentioned,
Chapter 2: The literature review shows an overview of “water allocation”, “Integrated water resources management”, “climate change impacts on water
“Climate change scenarios” and “Models for IVRM""
Chapter 3: This chapter gives a closer look into the characteristics of Huong River Basin with regard to the Geographical location and topography, the climate
conditions, the socio-economic development, the illustration of river networ
<small>‘current water tu</small> e activities, and the water storage.
Chapter 4: In this chapter, the simulation of models in Huong River Basin is described, The s‘chematization of the basin is brought out; the data requirements for applying WEAP model are demonstrated. Moreover, this chapter also defines three
<small>main scenarios,</small>
Chapter 5: The results of the three scenarios with respect to the water supply and Water requirement will be brought out and analyzed in this chapter. It illustrates and ‘compares the water shortage in of each water user node corresponding to each
Chapter 6: Conclusions and recommendations will b shown in this chapter.
</div><span class="text_page_counter">Trang 22</span><div class="page_container" data-page="22">CHAPTER 2: LITERATURE REVIEW
2.1. Water allocation: An overview
Water access entitlement was defined under the National Water Initiative as the ‘exclusive right to access an amount of water from the executive water supplier, Which fitted in water master plan (National water commission, 2011). The water access entitlement is determined through an allocation process which basically aims fying the needs of different individual consumers. The requirement for achieving an effective water allocation plan in any country all over the world
initiated from the 1992 UN Conference on Environment and Development where
water was asserted as a vulnerable resource that can be vanished over time by the excessive use without conservation of human’s activities,
Water allocation plan is created based on the water allocation system which is the set of policies and rules for maintaining the equilibrium between water availability and water demand without disrupting the sustainable development process of 4 ‘country and its environment. Fundamentally, there are two approaches of water allocation system, the non-volumetic systems and volumetric systems (NWC, 2011). The non-volumetric systems control the use of water based on the input and output of water rather than the particular amount of water for each sectors. On the ‘ther hand, the volumetric systems, which are the mostly used one, relied on ‘quantity of water used through some methods such as block tariff, market-based 1002), Recently, it is proved that the water allocation process shows its highest efficiency when it is
pricing, single rate or multi rates (Tsur, Dinar and Doukkali
‘evolved in basin level. However, allocation focuses on basin level still need to take in to account the national level water allocation plan and variety of stake-holders" agreements (Speed, 2013), The objective of water allocation lies under the umbrella term “balancing water supply and demand”, within this concept, there are four main focus including equity, environment protection, development priorities and
promoting efficiency use of water (Speed, 2013)
</div><span class="text_page_counter">Trang 23</span><div class="page_container" data-page="23">According to the National Report on Water Resources in 2012, Vietnam has rick sources of water considering the total amount of surface water, However, among, ‘eight main basins over the country, only four of them have enough water to satisfy ‘demands in dry season, That fact raises a challenge for water resources planning task to balancing the uneven seasonal rainfall, then to achieve maximum efficient water use, Water allocation systems in Vietnam are created based on volumetric systems varies within sectors. The institutional arrangement in Vietnam is referred to a hierarchi al organization structure, with the centralized Government. Therefore, the water resource are managed by the Government, at highest level, then, at the lower level, the Ministry of Natural Resources and Environment and the Ministry of Agriculture and Rural Development are cooperated to building the overall water resources planning to propose to the Government. The subordinate level of Ministry is the provincial local authorities including provincial People’s committees, the Departments which are directly under Ministries (VNCID, 2010). The overlay of authorities is also a challenge while applying Integrated water resources
2.2. Integrated Water Resources Management
Date back to the past, where the water mana; sment approaches only consider about separate Sectors such as water supply, itrigation, sanitation, and energy generation In 1977, attention of international experts was still pay in the water supply and sanitation in UN Conference in Mar de Plata; the water related issue was pronounced in Brundtland Report of the World Commission on Environment and Development in 1987 is about pollution and water supply (Savenije& Van Der Zang, 2008. Until 1992, when the UN Conference on Environment and Development was held in Rio de Janerio and the International Conference on Water and Environment was held in Dublin, the concepts of IWRM as well as its key principles were widely discussed. The principles of IWRM are based on the Dublin Principles which emphasized that water is finite, vulnerable, and essential for inable development and affirmed the vital role of woman in water
</div><span class="text_page_counter">Trang 24</span><div class="page_container" data-page="24">management. Moreover, itis stated that participatory approach is eructal in water management as well asthe consideration of water as social economic good has to be added in water management plans. The prevalent use of term “Integrated Water Resources Management” was appeared in the late 1990s by the promotion of it uses by the Global Water Partnership (Biwas, 2008). In 2002, a the Johannesburg World Summit on Sustainable Development (WSSD), The Technical Advisory Committee of the Global Water Partnership defined Integrated Water Resources Management “as a process, which promotes the coordinated development and management of water, land and related resources in order to maximize the resultant economic and social welfare in an equitable manner without compromising the sustainability of vital ecosystems” (GWP, 2000).
As the new challenges in the new era put pressure on every aspects of water resources, IWRM with it holistic system view approach is widely accepted by many scholars and practitioners due to several reasons: it provide a comprehensive eross-‘cutting approach through all types of resources and sectors; it creates a connection between livelihood of the catchment and resources perspective; it also focus on the collaboration between elements of good government as well as stakeholders (Gain
& Schwab, 2012). From that perspective, IWRM itself specifically enhances the
traditional water resources management in three ways: cross-sectoral of goals and objectives, the spatial focus on river basin instead of on administrative boundary, the participation of stakeholders in decision-making process (Cap-net, 2009). In Particular, Gooch and Stalnacke (2003) indicated that the distinction between
IWRM or Integrated River Basin Management (IRBM) and “Traditional” Water
Resources Management relies on the scope and sphere of operation of the two. The
traditional” one only focused on sa fying the perceived demand with
sector-‘oriented approach while the “integrated” one attempts to bring out water resource management on the demand, supply, and use of water with a cross-sectoral approach, This new paradigm was applied to many river basins in South Africa, Australia, Europe, and Mozambique.
</div><span class="text_page_counter">Trang 25</span><div class="page_container" data-page="25">However, the concept of integrated water management considering climate change has not been well discussed and reported in literature (Lin et al, 2010). Further, due atention has not been given to such practices in developing countries (Qin and Xu, 2011). A few attempts have been made to address the water resources management issues considering one or another issue of climate change (Ragab and Prudhomme, 2002; Mitchell et al., 2007). However, integrated water management considering Integration of various possible water sources (0 sa isfy the demands of different users, environment protection, land and urban planning have not been considered
2.3. Climate change impacts on water resources
On the Global scale, among various environment factors influenced by climate change, water resources are of the major concern (Frederick and Major, 1997) Global warming due to the increase of greenhouse concentration is likely to have significant effects on the hydrological cycle (IPCC, 1996). Inthe researching of the relationship between climate change and water resources, especially the impacts of climate change, Yang Nan, Bao-Hui and Chun-Kun emphasized that the hydrological cycle is the theoretical basis; they also sum up the relationship into a cycle diagram of climate change impacts:
</div><span class="text_page_counter">Trang 26</span><div class="page_container" data-page="26">‘The hydrological cycle will be intensified and changed in time and space. It will be more precipitation and more evaporation, but the extra precipitation will be unevenly distributed all over the world, as a result, some parts in the world may witness the đecline in precipitation or major alteration in the timing of rainy and dry season (Amell, 1999). The threat from the Second As
Intergovernment Panel on Climate Change was about the growing trend of floods sment Report of
and droughts. There are numerous of study on water resources negatively influenced by global climatic change, espectally in arid area and semi-arid area such 4 United States, Australia, Canada, South Africa, Greece, South Asia or Mediterranean (Dawadi& Ahmad, 2012; Amell, 1999; Beck &Bemauer, 2011; Mefarlanede Stone ef al., 2012). In Vietnam, one of the most vulnerable countries exposed to climate change impacts, especially in water resources sectors, there are several studies about this problem, however, these are mostly the assessment in the general impacts without holistic approach. In 2010, thes \was one prominent project
</div><span class="text_page_counter">Trang 27</span><div class="page_container" data-page="27">in Huong River Basin which was done by the cooperation between Vietnamese Institute of Meteorological, Hydrological and Environment (IMHEN) and The Netherlands Climate Assistance Program (NCAP) called “Climate Change Impacts in Huong River Basin and Adaptation in its Coastal District PhuVang, ThuaThien Hue province”. Another separated research was brought out by Tran Thục (2010) Which is contributed to NCAP's Project. The two projects share the same ideal is that climate change causes high river flow resulted inthe appearance of more floods ‘due to the intensive rainfall in rainy season and the decline in rainfall a long with the rise of evapotrans ration causing more droughts in dry season under most scenarios. However, specific management measures still remain unrevealed.
2.4. Climate change scenarios
‘Climate change scenarios are Special Report on Emissions Scenarios (SRES) which have been developing and updating by IPCC since 2000 (IPCC, 2000). The changes of green house gases emissions were approved to be used as the references for the major changes in natural factors such as physical characteristic of hydrological systems, temperature, sea level ...ct6.SRES is the set of projections of future green house gases emission with considering the changes of population, economies, politcal structure and lifestyle in the next few decades (Amell, 1999). Each scenario stats with a storyline which describes the way these factors change, The storylines were gathered into four scenario families which contained six scenarios.
these four families can be characterized as follow:
AI: intensive population growth, very rapid economic development, increase in general wealth with convergence between regions and reduced differences in regional per capita income, Materialist-consumerist predominant with rapid technological change. AI family was sub-divided into three assumption about sources of energy: focusing on fossil fuel (AIFD), non-fossil fuel (AIT), and balance between these resources (A1B)
</div><span class="text_page_counter">Trang 28</span><div class="page_container" data-page="28">BỊ: same population growth as Al, however, economic development focuses on environmentally sustainability with cooperation and regulation within global scale. Green and efficient technologies are developed.
‘A2: the economic is heterogeneous, market-led, less rapid growth than AI but faster population growth, The underlying theme is self-reliance and preservation of local identities. Economic growth is regionally oriented, and hence both income growth and technological change are regionally diverse.
B2: Population increases at lower rate than A2 but at higher rate than Al and BỊ, the general development follows environmentally, economically and socially sustainable locally oriented pathways.
Due to these characteri 3, the scenarios can be classified into three groups; the high emission group contains AIFI and A2, the medium one is B2 and the least ‘emission is BI
Based on the IPCC’s global sale database about SRES, The MONRE developed the Greenhouse gases emission scenarios for Vietnam in 2009 and updated it in 2012. Itis appeared that the B2 scenario is the most suitable with the orientation of socio-economic development as well as the current conditions of Huong River
therefore, this study will reveal the i
sight of the balance between water
availability and water demand at the present as well as in projected future circumstances considering B2 scenario physical characteristics as the primary influence factors. These factors are shown in the following tables:
Table 2.1: The changes in average temperature (°C) compared to the period 1980:
1999 in Thua Thien Hue province by seasons in B2 scenario“The time mark in XXT century
2020 | 2030 | 2040 | 2050 | 2060 | 2070 | 2080 | 2090 | 2100 Winter ffom XIIoII | 05 | 08 | 11 | 14 | 17 | 20 | 23 | 25 | 28
Spring from HItoV— | 06 | 09 | 12 | 16 19 | 22 [as [30
05 | 07 10/1215 | 18 | 20) 22 24
Autumn tromIXtoXI | 05 | 07 | 10 | là l6 | 19 | 21) 23) 25
<small>Trin</small>
</div><span class="text_page_counter">Trang 29</span><div class="page_container" data-page="29">Table 2.2: The changes in average rainfall compared to the period 1980-1999 in Thua Thien Hue province by seasons in B2 scenario
“The time mark in XXT century
2020 | 2030 | 2040 | 2050 | 2060 | 2070 | 2080 | 2090 | 2100 Winter fom XIIolI | -09 | 12) 17| 22 27|-32| 36) 39) 43
Spring from HIteV | -L7 | 24 | 34 | 44) 34 | 63 | T1 | 78) 85
Summer from VIto vit | 14 | 20 | 28 | 36 44 | 51 | 58 | 64 69
Autumn tom IXtoXI | 24 | 35 | 49 | 64) 78 | 91 | 102] 113 122
2.5. Models for IWRM.
In a river basin, there are numerous factors which influent water resources, however, it can be classi «into two major kinds of factors, namely Internal factors and external factors. The internal factors are the direct influences to the water amount in supply side and demand side ineluding hydrological conditions, demand of different stakeholders or sectors. These factors are always changing in time and space. Besides, the extemal factors such as economic growth, policy orientation,
production prices, ete. constrain internal factors and it changes so fast that pose
urgent threats of developing tools to respond to variety circumstances. Moreover, there must be tools to fill the gap between watershed hydrology and water ‘management through combining physical components of hydrological process and integrated water management context (Yates et al, 2009). Throughout the last decade, along with the excessively growth of technology, simulation model progressively developed to support decision making process with the approach of Integrated water resources managementMIKE BASIN is an integrated water resource management and planning computer model which is fully integrated into the ArcGIS environment (DHI, 2006) Basically, this model represents mathematically the simulation of water availability and water demand. In the working environment, a network model is created with
</div><span class="text_page_counter">Trang 30</span><div class="page_container" data-page="30">the river and their tributaries are represented by a network containing branches and nodes. The branches represent individual tributary sections and the nodes represent confluence, locations where certain water activities may occur and important locations where model results are required. MIKE BASIN model calculates a mass balance equation in every node and branch of river basin where multi-sectoral allocation and environmental issues can be schematized (Seppelt &Voinov et al, 2012)
‘The WEAP system model has been developed by Stockholm Environment Institute
(SED since 1988.
The WEAP is repre ented as a decision supporting tool that can cover the simulation of hydrologic, water quality, economic, and social factors that control the availability of water and influence the priorities set for its use (Hoff et al., 2007). It calculates water allocation problems by applying the basic principle of ‘mass balance formulated as a Linear Program following a monthly time step (Yate ct al, 2009). The system is represented in terms of its various sources of supply (e.g.
rivers, groundwater, and reservoirs), withdrawals, transmission, wastewater
treatment facilities, water demands (e, user-defined sectors but typically
‘comprising industry, mines, irrigation, domestic supply, etc), and ecosystem
WEAP model has two primary functions (Sieber etal. 2004):
+ Simulation of natural hydrological processes (e.g, evapotranspiration, runoff and infiltration) to determine the availability of water in catchment.
+ Simulation of human activites that have effect on the natural system to influence water resources and their allocation (ic, consumptive and non-‘consumptive water demands) to evaluate these impacts.
</div><span class="text_page_counter">Trang 31</span><div class="page_container" data-page="31">WEAP represents a water system in a schematization of main supply, demand nodes and their reaches. The data layer and level of data can be customized (e.g, by ‘combining demand sites) to fit with the particular purpose of analysis, and minimize
data shortage issues. The physical characteristics of the network are visualized by
graphical boundary which can highly cooperate with ArcGIS environment.
One of the most important tools in WEAP is the developing altemative scenarios tool which can be applied by adjusting parameters such as reservoir operation ‘curves, hydropower generation capacity, ete. and the hydrology characteristics such as rainfall, runoff, evaporation, ete as well as the impact of different development scheme and management practices.
By setting priorities and supplying references for each node, the allocation rules ean
be created or changed following scenarios, The priorities of all demand sites are between 1 and 99, where 1 is the highest priority and 99 the lowest.
</div><span class="text_page_counter">Trang 32</span><div class="page_container" data-page="32">WEAP is being applied in a number of international projects such as the Jordan River basin, study of the hydrologic, economic, ecological, health, and institutional ‘dimensions of small reservoir ensemble planning and management in the Volta (Ghana), Limpopo (Southern Africa), and Sao Francisco (Brazil) basins. It can be applied in data-rich basin such as Neckar basin, Germany and data-scarce basin in Oueme, Benin (Hoff et al., 2007)
In order (o provide input for WEAP in water allocation proves:
‘were used in this thesis such as MIKE 11-NAM (Nedbør Affstromnings Model) to calculate inflow in supply side and CROPWAT to compute water requirement for inrigation in demand side
MIKE H1 - M
Due to its ability to simulate the hydrological process in detail, NAM was chosen to apply in this project. NAM is “a deterministic, lumped conceptual rainfall-runoff model which is originally developed by the Technical University of Denmark” (Nielsen & Hansen, 1973). Particularly, hydrological cycle is considered as the basis of quantitative simulation of the runoff in watershed and the evaluation of parameters is the average value of the whole watershed based on physical process
(Shamsudin and Hashim, 2002). The general structure of NAM comprises 4
storages, including snow storage, surface storage, lower zone storage and underground storage that shown in Figure 2.3
</div><span class="text_page_counter">Trang 33</span><div class="page_container" data-page="33">However, within the scope of this thesis, only the surface storage was taken into account sinee there is no snow in the research area and the thesis is only about surface water balancing. Basically, the input data required in this model are daily
rainfall and potential evaporation, and then the outcome of the model is the basin
runoff over time.
CROPWAT FOR WINDOW 8.0 is a decision supporting tool developed by the Land and Water Development Division of FAO. The model helps developing
inrigation scheme under various management and water supply scenarios by
providing result of the calculations with regard to evapotranspiration, crop water requirement, and irrigation requirement (NaZeer, 2009). The crop water requirement s the amount of water needed for various kinds of crops to grow optimally, and it depends mainly on the climate conditions, crop types, and the growth stage of crop. The potential evapotraspiration (ETO) was calculated by Penman-Monteith equation, the equation can be developed into direct calculation of any crop evapotraspiration (Ete) (Nazeer, 2009),
</div><span class="text_page_counter">Trang 34</span><div class="page_container" data-page="34">900 0.408.4(R, ~ G)+ y 200.
“ =O 7 Mir<sub>° a+ rs 0:34,</sub><sup>(,-«.)</sup>
ETo = reference evapotranspiration [mm day-1] Rn = net radiation at the crop surface (MJ m-2 day-1]
G= soil heat flux density (MJ m-2 day-1]
‘T= mean daily air temperature at 2 m height (°C] [U2 = wind speed at 2 m height [m s-1]
saturation vapour pressure [kPa] ‘ea = actual vapour pressure [kPa]
68 - ea = saturation vapour pressure deficit [kPa]
plone vapour pressure curve {kPa C1]
= psychrometric constant [kPa °C-1}
To carry out this thesis, WEAP was chosen to calculate water balance in Huong
River Basin, Additionally, to provide input for WEAP, MIKE-NAM was employed to define the inflow from the rainfall data and CROPWAT was adopted to compute
the water requirement for irrigation,
</div><span class="text_page_counter">Trang 35</span><div class="page_container" data-page="35">CHAPTER 3: DESCRIPTION OF STUDY SITE
3.1. Geographical location and topography
Huong River Basin totally fits in Thua Thien Hue province, which is located in ‘coastal area of Northern Central Vietnam, The area of Huong River basin is about
3000 km", occupied nearly 3/5 of province's area, It is situated between 15059"—
16036°N and 107009" - 107051°E, Huong River Basin is adjacent to the lagoon system Tam Giang Cau Hai to the North, Da Nang City, Quang Nam Province to the South, Asap~A Luoi River Catchments and O Lau River Catchment to the West and Nong River Catchment to the East, including all or a part of districts: Nam
<small>Source: VACNE, 2012</small>
Figure 3.1: Huong River Basin
‘The topography of Huong River Basin is mostly mountainous area oceupied 70% of,
the area, the distance from the mountainous area to the plain is short resulting in a
</div><span class="text_page_counter">Trang 36</span><div class="page_container" data-page="36">steep slope. The West and South-Western part of the province is the location of ‘Truong Son Mountain with the average elevation of 100m, The direction of the ‘mountain's peak combines with the South-East circulation created one of the highest rainfalls among other area,
“The elevation of mountainous area in the West and South-Western part of the province varies from 250 ~ 750 m in the low area and 750 ~ 1800 m in the high area. The mountains form a curvy shape surrounding the plain, plus, the degree of the cliff's slope is about 35 degree and the length of the river here is short. ‘Therefore, itis not only causes the increase in the inflow, it also creates flood to the downstream area
The hilly region which separated into 3 typical types, the low area with the clevation of 10 ~ 50 m, the medium area with 50-125 m and the high area with 125 250 m. The direction of this region is vague and the hydrology regime is complicated then, it is hard to determine the sub-basin, However, this kind of topography creates many valleys which are extremely important for building
multi-purposes reservoirs such as Binh Dien reservoir, Duong Hoa reservoir, ete
“The coastal plain concentrated in the North and North-Eastern part of the province,
adjacent to the lagoon system. The sand dune which the elevation is 20-30 m
surrounds the Tam Giang- Cau Hai lagoon to the East and protect the lagoon from the ocean circulation impacts.
3.2. Climate
3.2.1. Temperature
The temperature in Huong River Basin varies from 19-29°C. January has the lowest
average temperature of about 21°C in the plain and 19°C in the mountainous arca
“The highest monthly average temperature usually appears in June or December of
25°C in the mountainous area and 28°C in the coastal plain since the South-West
wind strikes
</div><span class="text_page_counter">Trang 37</span><div class="page_container" data-page="37">Table 3.1: Monthly average temperature in Huong River Basin from 2009 to 2012
Sve T1 [n fa W fv [vr [vm vailax |x ft J ver
Mus 2i |312|337.261|393 [204 [ae 4l5i41213|2361313 [ea
Mam Doug [26338 [34-1967 [395 [288383 273|209/315) 29 [a3 [ae ‘tan [iso[a19 [at 935 [as3 aer[asr[aei[3s9 arena) ies ans
‘Source: Viemomese Sait yearbook 2012
<small>hit 5%</small>
3.2.2, Humidity
Huong River Basin is one of the areas which has highest humidity in Vietnam, The
average humidity varies from 84% to 87%.
Table 3.2: Average humidity in Huong River Basin from 2009 to 2012
sae fe fw fm w| v |v [val oc] x | xt [var
His J9R0)906/s02 m0 ia] 778 ar ayaa a | Nam Doag_|92. |e 82] sh 1...1...
‘ta eo} ou 90s [soe | sa [Reo 3 0121916 908 [7
<small>‘Source: Vietwomese Sitti Yearbook 2012‘nit 5%</small>
3.2.3. Evaporation
‘The average annual evaporation in the coastal area is about 900-1000mm and in the ‘mountainous area is about 800-900mm, equivalent to 30-40% of the total annual
</div><span class="text_page_counter">Trang 38</span><div class="page_container" data-page="38">3.2.4, Rainfall
‘There are 10 gauge stations and 8 hydrological stations in this basin, Among these 8 hydrological stations, there are 5 stations that observed the water elevation and
runoff, the others 3 station only collected data of water elevation,
Table 3.5: Hydrological and hydro-meteorological stations network in the Huong
yelogical sation m Hour oe
Source: National center for documentation, Ministry of Natural Resources and Environment, 2014
‘Thua Thien Hue province has one of the largest amounts of rainfall in Vietnam with
annual average rainfall of 2800-3800mm in the period 1977-2010. However, the
</div><span class="text_page_counter">Trang 39</span><div class="page_container" data-page="39">rainfall slightly varies different parts ofthis province. The highest annual rainfall of
approximately 3800 mnva which had been recorded concentrated in the south-west
part including Aluoi, Nam Dong and Phu loc District. The least exprerienced annual
rainfall of about 2741 mnva_are in the Norther Part consisting Co bi and Phu Oc
stations which are located in Phong Dien and Quang Dien District, respectively
‘The central part received the annual rainfall of nearly 2980 mưa
Figure 3.2: The annual average rainfall of observe stations
In this province, there are two typical seasons including rainy seasons and dry season, The rainy season starts from September to December, and the rest of the
year is dry season. This area witnesses the tremendous unevenly distribution of
monthly rainfall since the amount of rainfall concentrate mostly in the four months
‘of rainy season, oceuping 70% of total monthly average which is 2232 mm, During
the rest 8 months of the year which belongs to dry season, the total monthly average
rainfall is 958 mm, take the other 30% of total amount. The average number of
rainy day in the plain region is 200-220 days and in mountainous area is 150-170
days,
</div><span class="text_page_counter">Trang 40</span><div class="page_container" data-page="40">Monthly Average Rainfall (mm/month)
“The average annual runoff of Bo River is approximately S6.0m3/s and Huw Trach River has annual discharge of 41.1mi/s. The runoff is unevenly distributed during ‘months in the year, itis divided into floods season from September to November and low flow season from January to September. Often, in flood season, the average annual runoff occupies about 69.1% in Bo River, 66% in Huu Trach River and 649 in Ta Trach River ofthe total annual inflow. In low flow season, the average annual discharge is about 30% in Bo River, 34% in Huu Trach River and 36% in Ta Trach River ofthe (otal annual runoff
‘The annual average surface water inflow of the basin is approximately 6258
MCM/a in the period of 1977-2010. Overall, the total annual inflow of this area
witnesses a significant increase,
</div>