Simulation of Ground-Water Flow and Evaluation of Water-Management Alternatives in the Assabet River Basin, Eastern Massachusetts pptx
Bạn đang xem bản rút gọn của tài liệu. Xem và tải ngay bản đầy đủ của tài liệu tại đây (10.49 MB, 142 trang )
Simulation of Ground-Water Flow and
Evaluation of Water-Management
Alternatives in the Assabet River Basin,
Eastern Massachusetts
By Leslie A. DeSimone
In cooperation with the
Massachusetts Department of Conservation and Recreation
Scientific Investigations Report 2004-5114
U.S. Department of the Interior
U.S. Geological Survey
U.S. Department of the Interior
Gale A. Norton, Secretary
U.S. Geological Survey
Charles G. Groat, Director
U.S. Geological Survey, Reston, Virginia: 2004
For sale by U.S. Geological Survey, Information Services
Box 25286, Denver Federal Center
Denver, CO 80225
For more information about the USGS and its products:
Telephone: 1-888-ASK-USGS
World Wide Web: />Any use of trade, product, or firm names in this publication is for descriptive purposes only and does not imply
endorsement by the U.S. Government.
Although this report is in the public domain, permission must be secured from the individual copyright owners to
reproduce any copyrighted materials contained within this report.
Suggested citation:
DeSimone, L.A., 2004, Simulation of ground-water flow and evaluation of water-management alternatives in the
Assabet River Basin, eastern Massachusetts: U.S. Geological Survey Scientific Investigations Report 2004-5114, 133 p.
iii
Contents
Abstract . . . . . . . . . . . . . . . . . . . . . . . . . . . . . . . . . . . . . . . . . . . . . . . . . . . . . . . . . . . . . . . . . . . . . . . . . . . . . . . . . . . . 1
Introduction . . . . . . . . . . . . . . . . . . . . . . . . . . . . . . . . . . . . . . . . . . . . . . . . . . . . . . . . . . . . . . . . . . . . . . . . . . . . . . . . . 2
Purpose and Scope . . . . . . . . . . . . . . . . . . . . . . . . . . . . . . . . . . . . . . . . . . . . . . . . . . . . . . . . . . . . . . . . . . . . . 4
Description of the Study Area. . . . . . . . . . . . . . . . . . . . . . . . . . . . . . . . . . . . . . . . . . . . . . . . . . . . . . . . . . . . 4
Previous Studies. . . . . . . . . . . . . . . . . . . . . . . . . . . . . . . . . . . . . . . . . . . . . . . . . . . . . . . . . . . . . . . . . . . . . . . . 4
Ground- and Surface-Water Resources. . . . . . . . . . . . . . . . . . . . . . . . . . . . . . . . . . . . . . . . . . . . . . . . . . . . . . . . 5
Geologic Setting . . . . . . . . . . . . . . . . . . . . . . . . . . . . . . . . . . . . . . . . . . . . . . . . . . . . . . . . . . . . . . . . . . . . . . . . 5
Hydraulic Properties . . . . . . . . . . . . . . . . . . . . . . . . . . . . . . . . . . . . . . . . . . . . . . . . . . . . . . . . . . . . . . . . . . . . 7
Ground-Water Flow . . . . . . . . . . . . . . . . . . . . . . . . . . . . . . . . . . . . . . . . . . . . . . . . . . . . . . . . . . . . . . . . . . . . 10
Recharge. . . . . . . . . . . . . . . . . . . . . . . . . . . . . . . . . . . . . . . . . . . . . . . . . . . . . . . . . . . . . . . . . . . . . . . . . 10
Water Levels . . . . . . . . . . . . . . . . . . . . . . . . . . . . . . . . . . . . . . . . . . . . . . . . . . . . . . . . . . . . . . . . . . . . . 11
Surface Water. . . . . . . . . . . . . . . . . . . . . . . . . . . . . . . . . . . . . . . . . . . . . . . . . . . . . . . . . . . . . . . . . . . . . . . . . 17
Streamflow . . . . . . . . . . . . . . . . . . . . . . . . . . . . . . . . . . . . . . . . . . . . . . . . . . . . . . . . . . . . . . . . . . . . . . . 17
Ponds and Wetlands . . . . . . . . . . . . . . . . . . . . . . . . . . . . . . . . . . . . . . . . . . . . . . . . . . . . . . . . . . . . . . 20
Water Use and Management . . . . . . . . . . . . . . . . . . . . . . . . . . . . . . . . . . . . . . . . . . . . . . . . . . . . . . . . . . . 22
Water Supply and Consumptive Use . . . . . . . . . . . . . . . . . . . . . . . . . . . . . . . . . . . . . . . . . . . . . . . . 24
Wastewater Discharge and Return Flow . . . . . . . . . . . . . . . . . . . . . . . . . . . . . . . . . . . . . . . . . . . . 32
Simulation of Ground-Water Flow . . . . . . . . . . . . . . . . . . . . . . . . . . . . . . . . . . . . . . . . . . . . . . . . . . . . . . . . . . . . 33
Steady-State Numerical Model . . . . . . . . . . . . . . . . . . . . . . . . . . . . . . . . . . . . . . . . . . . . . . . . . . . . . . . . . 33
Spatial Discretization. . . . . . . . . . . . . . . . . . . . . . . . . . . . . . . . . . . . . . . . . . . . . . . . . . . . . . . . . . . . . . 33
Boundary Conditions . . . . . . . . . . . . . . . . . . . . . . . . . . . . . . . . . . . . . . . . . . . . . . . . . . . . . . . . . . . . . . 33
Stresses. . . . . . . . . . . . . . . . . . . . . . . . . . . . . . . . . . . . . . . . . . . . . . . . . . . . . . . . . . . . . . . . . . . . . . . . . . 36
Recharge and Evapotranspiration . . . . . . . . . . . . . . . . . . . . . . . . . . . . . . . . . . . . . . . . . . . . . 36
Water Withdrawals and Discharges . . . . . . . . . . . . . . . . . . . . . . . . . . . . . . . . . . . . . . . . . . . 37
Hydraulic Properties . . . . . . . . . . . . . . . . . . . . . . . . . . . . . . . . . . . . . . . . . . . . . . . . . . . . . . . . . . . . . . 37
Model Calibration . . . . . . . . . . . . . . . . . . . . . . . . . . . . . . . . . . . . . . . . . . . . . . . . . . . . . . . . . . . . . . . . . 40
Model-Calculated Water Budgets and Flows . . . . . . . . . . . . . . . . . . . . . . . . . . . . . . . . . . . . . . . . 45
Transient Numerical Model. . . . . . . . . . . . . . . . . . . . . . . . . . . . . . . . . . . . . . . . . . . . . . . . . . . . . . . . . . . . . 46
Temporal Discretization and Initial Conditions . . . . . . . . . . . . . . . . . . . . . . . . . . . . . . . . . . . . . . . 46
Boundary Conditions and Stresses . . . . . . . . . . . . . . . . . . . . . . . . . . . . . . . . . . . . . . . . . . . . . . . . . 49
Hydraulic Properties . . . . . . . . . . . . . . . . . . . . . . . . . . . . . . . . . . . . . . . . . . . . . . . . . . . . . . . . . . . . . . 50
Model Calibration . . . . . . . . . . . . . . . . . . . . . . . . . . . . . . . . . . . . . . . . . . . . . . . . . . . . . . . . . . . . . . . . . 50
Model-Calculated Water Budgets and Flows . . . . . . . . . . . . . . . . . . . . . . . . . . . . . . . . . . . . . . . . 58
Model Limitations. . . . . . . . . . . . . . . . . . . . . . . . . . . . . . . . . . . . . . . . . . . . . . . . . . . . . . . . . . . . . . . . . . . . . . 65
Evaluation of Ground-Water-Management Alternatives . . . . . . . . . . . . . . . . . . . . . . . . . . . . . . . . . . . . . . . . 66
Simulation of Altered Withdrawals and Discharges. . . . . . . . . . . . . . . . . . . . . . . . . . . . . . . . . . . . . . . 66
Simulation of No Water Management. . . . . . . . . . . . . . . . . . . . . . . . . . . . . . . . . . . . . . . . . . . . . . . 66
Simulation of Increased Withdrawals and Discharges . . . . . . . . . . . . . . . . . . . . . . . . . . . . . . . 69
Simulation of Ground-Water Discharge of Wastewater. . . . . . . . . . . . . . . . . . . . . . . . . . . . . . . 72
Hypothetical Discharge Site in the Fort Meadow Brook Subbasin . . . . . . . . . . . . . . . . 76
Hypothetical Discharge Site in the Taylor Brook Subbasin . . . . . . . . . . . . . . . . . . . . . . . 77
Hypothetical Discharge Site in the Cold Harbor and Howard Brooks Subbasins. . . . 77
iv
Hypothetical Discharge Site in the Stirrup Brook Subbasin . . . . . . . . . . . . . . . . . . . . . . . 78
Summary of Scenarios of Ground-Water Discharge of Wastewater. . . . . . . . . . . . . . . 78
Simulation-Optimization of Withdrawals, Discharges, and Streamflow Depletion . . . . . . . . . . . . 78
Methods. . . . . . . . . . . . . . . . . . . . . . . . . . . . . . . . . . . . . . . . . . . . . . . . . . . . . . . . . . . . . . . . . . . . . . . . . . 79
Simulation-Optimization of Withdrawals and Discharges in Westborough. . . . . . . . . . . . . . 79
Response Coefficients . . . . . . . . . . . . . . . . . . . . . . . . . . . . . . . . . . . . . . . . . . . . . . . . . . . . . . . . 79
Management-Model Application. . . . . . . . . . . . . . . . . . . . . . . . . . . . . . . . . . . . . . . . . . . . . . . 81
Summary . . . . . . . . . . . . . . . . . . . . . . . . . . . . . . . . . . . . . . . . . . . . . . . . . . . . . . . . . . . . . . . . . . . . . . . . . . . . . . . . . . . 85
Acknowledgments . . . . . . . . . . . . . . . . . . . . . . . . . . . . . . . . . . . . . . . . . . . . . . . . . . . . . . . . . . . . . . . . . . . . . . . . . . 88
References . . . . . . . . . . . . . . . . . . . . . . . . . . . . . . . . . . . . . . . . . . . . . . . . . . . . . . . . . . . . . . . . . . . . . . . . . . . . . . . . . 88
Appendix 1: Estimated Average Monthly Streamflow, Nonstorm Streamflow, and
Model-Calculated Average Monthly Nonstorm Streamflow at Measurement
Sites in the Assabet River Basin, Eastern Massachusetts . . . . . . . . . . . . . . . . . . . . . . . . . . . . . . . 95
Appendix 2: Model-Calculated Average Annual, March, and September Hydrologic
Budgets for Subbasins in the Assabet River Basin, Eastern Massachusetts. . . . . . . . . . . . . . 105
Appendix 3: Average Monthly Withdrawals and Discharges at Permitted Municipal
and Nonmunicipal Water-Supply Sources and Wastewater-Treatment
Facilities used in the Calibrated Transient Model to Simulate Average 1997–2001
Conditions and in a Scenario of Increased Withdrawals and Discharges in the
Assabet River Basin, Eastern Massachusetts . . . . . . . . . . . . . . . . . . . . . . . . . . . . . . . . . . . . . . . . . 125
Figures
1–3. Maps showing:
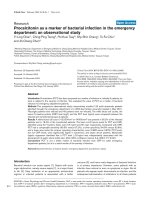
1. The Assabet River Basin, subbasins, streamflow-gaging stations, and
long-term observation well, eastern Massachusetts . . . . . . . . . . . . . . . . . . . . . . . . . . . . . . . 3
2. Surficial geology of the Assabet River Basin . . . . . . . . . . . . . . . . . . . . . . . . . . . . . . . . . . . . . . 6
3. Depth-weighted hydraulic conductivity from well logs and transmissivity
zones in stratified glacial deposits in the Assabet River Basin. . . . . . . . . . . . . . . . . . . . . . . 9
4, 5. Graphs showing:
4. Monthly mean precipitation for long-term average conditions and for
1997–2002 at National Oceanic and Atmospheric Administration weather
stations in Bedford and West Medway . . . . . . . . . . . . . . . . . . . . . . . . . . . . . . . . . . . . . . . . . . 12
5. Monthly recharge rates estimated from A, streamflow records at the Assabet
River streamflow-gaging station in Maynard; B, streamflow records at the
Nashoba Brook streamflow-gaging station; and C, climate data from Bedford
and West Medway weather stations, for long-term average conditions and
1997–2001 . . . . . . . . . . . . . . . . . . . . . . . . . . . . . . . . . . . . . . . . . . . . . . . . . . . . . . . . . . . . . . . . . . . . . 12
6. Map showing streamflow-measurement sites, observation wells, and pond-
measurement sites in the Assabet River Basin . . . . . . . . . . . . . . . . . . . . . . . . . . . . . . . . . . . . . . . . 13
7–12. Graphs showing:
7. Monthly and daily average water levels at long-term observation well ACW158,
Assabet River Basin . . . . . . . . . . . . . . . . . . . . . . . . . . . . . . . . . . . . . . . . . . . . . . . . . . . . . . . . . . . 15
8. Measured water levels, September 2001 through December 2002, and estimated
average monthly water levels, 1997–2001, at selected observation wells in the
Assabet River Basin . . . . . . . . . . . . . . . . . . . . . . . . . . . . . . . . . . . . . . . . . . . . . . . . . . . . . . . . . . . 16
9. Monthly mean streamflow for long-term average conditions and daily mean
streamflow, 1997–2001: A, Assabet River streamflow-gaging station at
Maynard; B, Nashoba Brook streamflow-gaging station near Acton . . . . . . . . . . . . . . . 20
v
10. Instantaneous streamflow measurements, June 2001 through December 2002,
and estimated mean monthly streamflow and nonstorm streamflow at selected
flow-measurement sites in the Assabet River Basin . . . . . . . . . . . . . . . . . . . . . . . . . . . . . . .21
11. Measured water levels, September 2001 through December 2002, at selected
ponds and impoundments in the Assabet River Basin. . . . . . . . . . . . . . . . . . . . . . . . . . . . . .22
12. Schematic diagram showing water use and return flows in the Assabet River
Basin. . . . . . . . . . . . . . . . . . . . . . . . . . . . . . . . . . . . . . . . . . . . . . . . . . . . . . . . . . . . . . . . . . . . . . . . . .23
13, 14. Maps showing:
13. Public-water and sewer systems in the Assabet River Basin . . . . . . . . . . . . . . . . . . . . . . .26
14. Permitted water-supply withdrawals and wastewater discharges in the
Assabet River Basin . . . . . . . . . . . . . . . . . . . . . . . . . . . . . . . . . . . . . . . . . . . . . . . . . . . . . . . . . . . .29
15. Graph showing monthly average permitted withdrawals, wastewater discharges,
and imported water for public supply, 1997–2001, in the Assabet River Basin . . . . . . . . . . . . .30
16, 17. Maps showing:
16. Areas of private-water supply with consumptive water use and areas of
public-water supply with septic-system return flow in the Assabet River
Basin. . . . . . . . . . . . . . . . . . . . . . . . . . . . . . . . . . . . . . . . . . . . . . . . . . . . . . . . . . . . . . . . . . . . . . . . . .31
17. Model area, grid, hydraulic conductivity zones, and simulated ponds, streams,
water withdrawals and surface-water inflows for ground-water-flow models
of the Assabet River Basin . . . . . . . . . . . . . . . . . . . . . . . . . . . . . . . . . . . . . . . . . . . . . . . . . . . . . .34
18. Diagram showing vertical discretization for ground-water-flow models of the
Assabet River Basin . . . . . . . . . . . . . . . . . . . . . . . . . . . . . . . . . . . . . . . . . . . . . . . . . . . . . . . . . . . . . . . . .35
19. Relation between observed and model-calculated A, ground-water levels; and
B, nonstorm streamflow for average conditions, 1997–2001, for the steady-state
ground-water-flow model of the Assabet River Basin. . . . . . . . . . . . . . . . . . . . . . . . . . . . . . . . . . .43
20. Map showing model-calculated steady-state water table in the Assabet River
Basin . . . . . . . . . . . . . . . . . . . . . . . . . . . . . . . . . . . . . . . . . . . . . . . . . . . . . . . . . . . . . . . . . . . . . . . . . . . . . . .44
21. Graph showing model-calculated average annual inflows to and outflows from
the surficial layer of the simulated ground-water-flow system in subbasins of the
Assabet River Main Stem and tributary subbasins, 1997–2001, Assabet River Basin . . . . . . .46
22. Map showing anthropogenic outflows relative to total model-calculated average
A, annual; and B, September outflows from the simulated ground-water-flow
system in subbasins of the Assabet River Basin . . . . . . . . . . . . . . . . . . . . . . . . . . . . . . . . . . . . . . . .47
23, 34. Graphs showing:
23. Model-calculated components of average annual nonstorm streamflow in
subbasins of the Assabet River Main Stem, 1997–2001. . . . . . . . . . . . . . . . . . . . . . . . . . . . .48
24. Model-calculated average annual total nonstorm streamflow and the
component of flow that originated as wastewater, for existing conditions
and two hypothetical scenarios of altered withdrawals and discharges in
the Assabet River Basin. . . . . . . . . . . . . . . . . . . . . . . . . . . . . . . . . . . . . . . . . . . . . . . . . . . . . . . . .48
25. Monthly average recharge rates and rates of evaporative loss of ground
water for the transient ground-water-flow model of the Assabet River Basin . . . . . . . .49
26. Model-calculated and observed water-level fluctuations during the average annual
cycle for selected observation wells and ponds in the Assabet River Basin. . . . . . . . . . . . . . .51
27. Model-calculated and observed mean monthly nonstorm streamflow at the
A, Assabet River at Maynard; and B, Nashoba Brook near Acton streamflow-gaging
stations on the Assabet River, Assabet River Basin. . . . . . . . . . . . . . . . . . . . . . . . . . . . . . . . . . . . .52
28. Model-calculated and observed mean monthly nonstorm streamflow at flow-
measurement sites on the A, Assabet River; and B, tributaries, Assabet River
Basin . . . . . . . . . . . . . . . . . . . . . . . . . . . . . . . . . . . . . . . . . . . . . . . . . . . . . . . . . . . . . . . . . . . . . . . . . . . . . . .53
vi
29. Observed and model-calculated monthly nonstorm streamflow for the calibrated
transient model and for several alternative model parameters at the Assabet River
at Maynard and a selected tributary site in the Assabet River Basin. Horizontal and
vertical hydraulic conductivity of stratified glacial deposits multiplied and divided
by 2 for the A, Assabet River at Maynard and B, Cold Harbor Brook; horizontal and
vertical hydraulic conductivity of till multiplied and divided by 2 for the C, Assabet
River at Maynard and D, Cold Harbor Brook; storage property of stratified glacial
deposits increased and decreased by 50 percent for the E, Assabet River at
Maynard and F, Cold Harbor Brook; recharge fluctuations during the annual cycle
and evapotranspiration rate in wetlands and nonwetland areas decreased by
50 percent for the G, Assabet River at Maynard and H, Cold Harbor Brook . . . . . . . . . . . . . . . 56
30. Model-calculated average A, March; and B, September inflows to and outflows
from the surficial layer of the simulated ground-water-flow system in subbasins
of the Assabet River Main Stem and tributary subbasins, 1997–2001, Assabet
River Basin. . . . . . . . . . . . . . . . . . . . . . . . . . . . . . . . . . . . . . . . . . . . . . . . . . . . . . . . . . . . . . . . . . . . . . . . . 60
31. Model-calculated components of average A, March; and B, September nonstorm
streamflow in subbasins of the Assabet River Main Stem . . . . . . . . . . . . . . . . . . . . . . . . . . . . . . 61
32. Model-calculated average A, March and B, September total nonstorm streamflow
and the component of streamflow that originated as wastewater, for existing
conditions and two hypothetical scenarios of altered withdrawals and discharges
in the Assabet River Basin. . . . . . . . . . . . . . . . . . . . . . . . . . . . . . . . . . . . . . . . . . . . . . . . . . . . . . . . . . . 62
33. Model-calculated average A, annual; B, March; and C, September nonstorm
streamflow from subbasins of the Assabet River Main Stem and tributaries for
comparison with minimum streamflow requirements for the protection of aquatic
habitat . . . . . . . . . . . . . . . . . . . . . . . . . . . . . . . . . . . . . . . . . . . . . . . . . . . . . . . . . . . . . . . . . . . . . . . . . . . . . 63
34. Model-calculated changes, relative to simulated 1997–2001 conditions, in average
annual inflows to and outflows from the surficial layer of the simulated ground-
water-flow system in subbasins of the A, Assabet River Main Stem; and B, tributary
subbasins, in a hypothetical scenario of no anthropogenic water management in the
Assabet River Basin. . . . . . . . . . . . . . . . . . . . . . . . . . . . . . . . . . . . . . . . . . . . . . . . . . . . . . . . . . . . . . . . . 68
35. Map showing changes in sewer lines and areas of septic-system return flow
simulated in a hypothetical scenario of increased withdrawals and discharges
in the Assabet River Basin. . . . . . . . . . . . . . . . . . . . . . . . . . . . . . . . . . . . . . . . . . . . . . . . . . . . . . . . . . . 70
36, 37. Graphs showing:
36. Model-calculated changes, relative to simulated 1997–2001 conditions, in
average annual inflows to and outflows from the surficial layer of the simulated
ground-water-flow system in subbasins of the A, Assabet River Main Stem; and
B, tributary subbasins, in a hypothetical scenario of increased withdrawals
and discharges in the Assabet River Basin. . . . . . . . . . . . . . . . . . . . . . . . . . . . . . . . . . . . . . . 71
37. Model-calculated components of average A, March; and B, September
nonstorm streamflow in subbasins of the Assabet River Main Stem, in a
hypothetical scenario of increased withdrawals and discharges in the
Assabet River Basin . . . . . . . . . . . . . . . . . . . . . . . . . . . . . . . . . . . . . . . . . . . . . . . . . . . . . . . . . . . 72
38. Map showing hypothetical ground-water discharge sites for wastewater used in
simulations in the Assabet River Basin: A, Fort Meadow Brook subbasin in Hudson;
B, Taylor Brook subbasin in Maynard; C, Cold Harbor and Howard Brooks subbasin
in Northborough; and D, Stirrup Brook subbasin in Westborough . . . . . . . . . . . . . . . . . . . . . . . 73
vii
39, 40. Graphs showing:
39. Model-calculated average annual, March, and September nonstorm
streamflow in tributaries to the Assabet River for existing conditions and
scenarios of hypothetical ground-water discharge of wastewater at four
sites in the Assabet River Basin: A, Fort Meadow Brook ; B, Taylor Brook;
C, Cold Harbor Brook; and D, Stirrup Brook . . . . . . . . . . . . . . . . . . . . . . . . . . . . . . . . . . . . . . .76
40. Monthly withdrawal and discharge rates for 1997–2001 and for the
management-model applications for decreased streamflow depletion in the
Assabet River and tributaries in low-flow months in the upper part of the
Assabet River Basin: A. OPT1; B, OPT2; C, OPT3; D, OPT4; E, OPT5; F, OPT6;
and G, 1997–2001 . . . . . . . . . . . . . . . . . . . . . . . . . . . . . . . . . . . . . . . . . . . . . . . . . . . . . . . . . . . . . . .84
Tables
1. Hydraulic properties of stratified glacial deposits as determined by analysis of
aquifer tests at public-supply wells in the Assabet River Basin, eastern
Massachusetts. . . . . . . . . . . . . . . . . . . . . . . . . . . . . . . . . . . . . . . . . . . . . . . . . . . . . . . . . . . . . . . . . . . . . . .8
2. Average annual recharge rates and precipitation for the Assabet River Basin . . . . . . . . . . . .11
3. Characteristics and water levels at observation wells and ponds in the Assabet
River Basin. . . . . . . . . . . . . . . . . . . . . . . . . . . . . . . . . . . . . . . . . . . . . . . . . . . . . . . . . . . . . . . . . . . . . . . . . .14
4. Characteristics and water levels at long-term observation wells near the Assabet
River Basin. . . . . . . . . . . . . . . . . . . . . . . . . . . . . . . . . . . . . . . . . . . . . . . . . . . . . . . . . . . . . . . . . . . . . . . . . .15
5. Drainage-area characteristics and mean annual flows at streamflow-gaging stations
in and near the Assabet River Basin. . . . . . . . . . . . . . . . . . . . . . . . . . . . . . . . . . . . . . . . . . . . . . . . . . .18
6. Drainage-area characteristics and mean annual flows at streamflow-measurement
sites in the Assabet River Basin. . . . . . . . . . . . . . . . . . . . . . . . . . . . . . . . . . . . . . . . . . . . . . . . . . . . . . .19
7. Population on public water and sewer and per capita water use in the Assabet
River Basin, 2000 . . . . . . . . . . . . . . . . . . . . . . . . . . . . . . . . . . . . . . . . . . . . . . . . . . . . . . . . . . . . . . . . . . . .25
8. Permitted water-supply withdrawals and wastewater discharges in the Assabet
River Basin. . . . . . . . . . . . . . . . . . . . . . . . . . . . . . . . . . . . . . . . . . . . . . . . . . . . . . . . . . . . . . . . . . . . . . . . . .27
9. Existing (1997-2001) and permitted withdrawals for municipal public-water systems
in the Assabet, Sudbury, and Concord River Basins. . . . . . . . . . . . . . . . . . . . . . . . . . . . . . . . . . . . .30
10. Simulated water withdrawals and discharges in calibrated models (1997–2001) and
in scenario 2 for permitted withdrawals and wastewater discharges and unpermitted
golf-course withdrawals in the Assabet River Basin . . . . . . . . . . . . . . . . . . . . . . . . . . . . . . . . . . . .38
11. Steady-state model-calculated average annual water levels and observed water
levels at observation wells and ponds in the Assabet River Basin. . . . . . . . . . . . . . . . . . . . . . . .41
12. Steady-state model-calculated average annual nonstorm streamflow and observed
nonstorm streamflow at measurement sites in the Assabet River Basin . . . . . . . . . . . . . . . . . .42
13. Steady-state model-calculated average annual water budget for the Assabet
River Basin. . . . . . . . . . . . . . . . . . . . . . . . . . . . . . . . . . . . . . . . . . . . . . . . . . . . . . . . . . . . . . . . . . . . . . . . . .45
14. Water-level-fluctuation residuals and mean absolute-flow residuals for the calibrated
transient model and model runs that use alternative model parameters, Assabet River
Basin . . . . . . . . . . . . . . . . . . . . . . . . . . . . . . . . . . . . . . . . . . . . . . . . . . . . . . . . . . . . . . . . . . . . . . . . . . . . . . .57
15. Transient model-calculated average March and September water budgets for the
Assabet River Basin . . . . . . . . . . . . . . . . . . . . . . . . . . . . . . . . . . . . . . . . . . . . . . . . . . . . . . . . . . . . . . . . .59
16. Model-calculated mean monthly nonstorm streamflows for August and September
at sites for comparison with minimum streamflow requirements for habitat protection,
Assabet River Basin . . . . . . . . . . . . . . . . . . . . . . . . . . . . . . . . . . . . . . . . . . . . . . . . . . . . . . . . . . . . . . . . .64
viii
17. Model-calculated nonstorm streamflow from subbasins in the Assabet River Basin
for existing conditions (1997-2001) and two scenarios of altered water-management
practices. . . . . . . . . . . . . . . . . . . . . . . . . . . . . . . . . . . . . . . . . . . . . . . . . . . . . . . . . . . . . . . . . . . . . . . . . . . 67
18. Hypothetical ground-water discharge sites for wastewater used in simulations in
the Assabet River Basin . . . . . . . . . . . . . . . . . . . . . . . . . . . . . . . . . . . . . . . . . . . . . . . . . . . . . . . . . . . . . 75
19. Hydrologic response coefficients for the public-supply wells and a hypothetical
ground-water-discharge site in the upper Assabet River Basin . . . . . . . . . . . . . . . . . . . . . . . . . 80
20. Model-calculated average monthly nonstorm streamflow, 1997-2001, and changes
in monthly average nonstorm streamflow determined by solutions to management
models in the upper Assabet River Basin . . . . . . . . . . . . . . . . . . . . . . . . . . . . . . . . . . . . . . . . . . . . . 83
Conversion Factors, Datums, and Abbreviations
Multiply By To obtain
cubic foot per day (ft
3
/d) 0.02832 cubic meter per day (m
3
/d)
cubic foot per second (ft
3
/s) 0.02832 cubic meter per second (m
3
/s)
cubic foot per second per square mile (ft
3
/s/mi
2
) 0.01093 cubic meter per second per square kilometer
(m
3
/s/km
2
)
foot (ft) 0.3048 meter (m)
foot per day (ft/d) 0.3048 meter per day (m/d)
gallon per person per day (gal/person/d) 0.00378 cubic meter per person per day(m
3
/person/d)
inch (in.) 25.4 millimeter (mm)
inch per month (in/mo) 25.4 millimeter per month (mm/mo)
inch per year (in/yr) 25.4 millimeter per year (mm/yr)
mile (mi) 1.609 kilometer (km)
million gallons per day (Mgal/d) 0.04381 cubic meter per second (m
3
/s)
square foot per day (ft
2
/d) 0.0929 square meter per day (m
2
/d)
square mile (mi
2
) 2.590 square kilometer (km
2
)
Temperature in degrees Fahrenheit (°F) can be converted to degrees Celsius (°C) as follows:
°C = (°F - 32) x 0.5555
In this report, vertical coordinate information is referenced to the National Geodetic Vertical
Datum of 1929 (NGVD 29), and horizontal coordinate information is referenced to the North
American Datum of 1983 (NAD 83). Altitude above the vertical datum is referred to as elevation.
ABF Aquatic Base Flow
GIS Geographic Information System
MADCR Massachusetts Department of Conservation and Recreation
MADEP Massachusetts Department of Environmental Protection
MWRA Massachusetts Water Resources Authority
NPDES National Pollution Discharge Elimination System
TMDL Total Maximum Daily Load
USGS U.S. Geological Survey
WMA Water Management Act
Simulation of Ground-Water Flow and Evaluation of
Water-Management Alternatives in the Assabet
River Basin, Eastern Massachusetts
By Leslie A. DeSimone
Abstract
Water-supply withdrawals and wastewater disposal in the
Assabet River Basin in eastern Massachusetts alter the flow and
water quality in the basin. Wastewater discharges and stream-
flow depletion from ground-water withdrawals adversely affect
water quality in the Assabet River, especially during low-flow
months (late summer) and in headwater areas. Streamflow
depletion also contributes to loss of aquatic habitat in tributaries
to the river. In 1997–2001, water-supply withdrawals averaged
9.9 million gallons per day (Mgal/d). Wastewater discharges
to the Assabet River averaged 11 Mgal/d and included about
5.4 Mgal/d that originated from sources outside of the basin.
The effects of current (2004) and future withdrawals and
discharges on water resources in the basin were investigated in
this study.
Steady-state and transient ground-water-flow models were
developed, by using MODFLOW-2000, to simulate flow in the
surficial glacial deposits and underlying crystalline bedrock in
the basin. The transient model simulated the average annual
cycle at dynamic equilibrium in monthly intervals. The models
were calibrated to 1997–2001 conditions of water withdrawals,
wastewater discharges, water levels, and nonstorm streamflow
(base flow plus wastewater discharges). Total flow through the
simulated hydrologic system averaged 195 Mgal/d annually.
Recharge from precipitation and ground-water discharge to
streams were the dominant inflow and outflow, respectively.
Evapotranspiration of ground water from wetlands and non-
wetland areas also were important losses from the hydrologic
system. Water-supply withdrawals and infiltration to sewers
averaged 5 and 1.3 percent, respectively, of total annual out-
flows and were larger components (12 percent in September) of
the hydrologic system during low-flow months. Water budgets
for individual tributary and main stem subbasins identified
areas, such as the Fort Meadow Brook and the Assabet Main
Stem Upper subbasins, where flows resulting from anthropo-
genic activities were relatively large percentages, compared to
other subbasins, (more than 20 percent in September) of total
out-flows. Wastewater flows in the Assabet River accounted for
55, 32, and 20 percent of total nonstorm streamflow (base flow
plus wastewater discharge) out of the Assabet Main Stem
Upper, Middle, and Lower subbasins, respectively, in an
average September.
The ground-water-flow models were used to evaluate
water-management alternatives by simulating hypothetical
scenarios of altered withdrawals and discharges. A scenario that
included no water management quantified nonstorm stream-
flows that would result without withdrawals, discharges, septic-
system return flow, or consumptive use. Tributary flows in this
scenario increased in most subbasins by 2 to 44 percent relative
to 1997–2001 conditions. The increases resulted mostly from
variable combinations of decreased withdrawals and decreased
infiltration to sewers. Average annual nonstorm streamflow in
the Assabet River decreased slightly in this scenario, by 2 to 3
percent annually, because gains in ground-water discharge were
offset by the elimination of wastewater discharges.
A second scenario quantified the effects of increasing
withdrawals and discharges to currently permitted levels. In this
simulation, average annual tributary flows decreased in most
subbasins, by less than 1 to 10 percent relative to 1997–2001
conditions. In the Assabet River, flows increased slightly, 1 to
5 percent annually, and the percentage of wastewater in the
river increased to 69, 42, and 27 percent of total nonstorm
streamflow out of the Assabet Main Stem Upper, Middle, and
Lower subbasins, respectively, in an average September.
A third set of scenarios quantified the effects of ground-
water discharge of wastewater at four hypothetical sites, while
maintaining 1997–2000 wastewater discharges to the Assabet
River. Wastewater, discharged at a constant rate that varied
among sites from 0.3 to 1.5 Mgal/d, increased nonstorm
streamflow in the tributaries adjacent to the sites and in down-
stream reaches of the Assabet River. During low-flow months,
flow increases in tributaries were less than the constant dis-
charge rate because of storage effects and increased ground-
water evapotranspiration. Average September flows, however,
more than doubled in these scenarios relative to simulated
1997–2001 conditions in Fort Meadow, Taylor, Cold Harbor,
and Stirrup Brooks. Increases in Assabet River flows were
small, with reductions in the wastewater component of flow in
September of 5 percent or less.
2 Simulation of Ground-Water Flow and Evaluation of Water-Management Alternatives in the Assabet River Basin, Eastern MA
Simulation-optimization analysis was applied to the upper
part of the basin to determine whether streamflow depletion
could be reduced, relative to 1997–2001 conditions, by
management of monthly withdrawals, with and without ground-
water discharge. The analysis included existing supply wells,
one new well (in use since 2001), and a hypothetical discharge
site in the town of Westborough. Without ground-water
discharge, simulated nonstorm streamflow in September in the
Assabet River about doubled at the outlet of the Main Stem
Headwaters subbasin and increased by about 4 percent at the
outlet of the Main Stem Upper subbasin. These increases were
obtained by using water-supply sources upstream of lakes,
which appeared to buffer the temporal effect of withdrawals, in
low-flow months, and by using water-supply sources adjacent
to streams, which immediately affected flows, in high-flow
months. With ground-water discharge, simulated flows nearly
tripled at the outlet of the Assabet Main Stem Headwaters
subbasin, increased by 18 percent at the outlet of the main stem
Upper subbasin, and more than doubled in a tributary stream.
The general principles illustrated in the simulation-optimization
analysis could be applied in other areas of the basin where
streamflow depletion is of concern.
Introduction
Water-supply withdrawals and wastewater disposal in
the Assabet River Basin, an area of about 177 mi
2
in eastern
Massachusetts (fig. 1), have altered the flow and quality of
ground- and surface water in the basin. Ground water is with-
drawn for municipal supply from the discontinuous glacial
aquifers along the tributaries and main stem of the Assabet
River. Because these aquifers are in direct hydraulic connection
with surface waters, the withdrawals typically reduce ground-
water discharge to streams and wetlands and deplete stream-
flow (Winter and others, 1998; Randall, 2001). Along with
water imported from outside the basin, private wells, and a few
water-supply reservoirs, these ground-water sources supply a
growing population of about 130,000 in the basin. Publicly
supplied water typically is transferred within or outside of the
basin after use to downstream treatment facilities, where it is
discharged to the main stem of the Assabet River. These water
withdrawals, transfers, and discharges adversely affect water
resources by reducing flows required to maintain aquatic
habitat, degrading water quality, and altering wetlands.
Currently (2004), the Assabet River is eutrophic during
the summer and fails to meet most applicable water-quality
standards (Massachusetts Department of Environmental
Protection, 2003). These conditions result from discharges from
the four municipal wastewater-treatment facilities along the
river, from nonpoint sources, and from past waste-disposal
practices (Richardson, 1964; ENSR International, 2001; Earth
Tech, 2002a; Organization for the Assabet River, 2003b).
Ground-water withdrawals also affect water quality and
quantity. Natural ground-water discharge to streams, either to
tributaries or directly to the main stem river, provides high-
quality base flow that dilutes wastewater discharges. Reduced
ground-water discharge to streams resulting from withdrawals
for water supply may exacerbate the poor water-quality
conditions common during low-flow periods. Reductions
in current waste loads to the river are planned, primarily
through the TMDL (Total Maximum Daily Load) process
(Massachusetts Department of Environmental Protection,
2003). Actions to achieve waste-load reductions are costly,
however, and alternative approaches to improving water quality
in the river that involve ground-water management also are
being considered (Earth Tech, 2002a).
Demands on water resources in the Assabet River
Basin for water supply and wastewater disposal are likely to
increase. The basin is along the rapidly developing Interstate
495 corridor, where a growing technology industry has
spurred residential, commercial, and industrial development
(Massachusetts Technology Collaborative, 1998). Between
1985 and 1999, 7.5 percent of the total basin area was converted
from forested or agricultural uses to developed uses, with areas
of residential and commercial or industrial land use increasing
by 27 and 22 percent, respectively (MassGIS, 2001). Average
population growth between 1990 and 2000 in towns in the
basin, at 15 percent, was nearly 3 times the statewide average,
and exceeded 30 percent in some towns (U.S. Census Bureau,
2003). These trends are likely to continue, resulting in the need
for additional water supplies and wastewater discharges beyond
current conditions (Massachusetts Technology Collaborative,
1999).
A better understanding of the effects of current and
future water withdrawals and discharges on streamflows in
the Assabet River and its tributaries will help water-resource
managers make decisions about water supply, wastewater
disposal, and waste-load reduction. Evaluating the effects of
water-management practices on streamflows in a regional
context also will aid management decisions, because these
effects accumulate downstream. Recognition of this need
by State agencies and others prompted a study by the
U.S. Geological Survey (USGS), in cooperation with the
Massachusetts Department of Conservation and Recreation
(MADCR). The objective was to evaluate the effects on
streamflows in the basin of withdrawals, discharges, and water-
management alternatives, such as ground-water disposal of
wastewater. Ground-water-flow models were developed to
meet this objective because of the important role of ground-
water discharge to streams and because most water withdrawals
in the basin are from ground water. To ensure that the investi-
gation adequately addressed issues of concern in the basin,
representatives from Federal and State agencies, towns, a
watershed association, and other organizations participated
in a Technical Advisory Committee (TAC) for the study. The
water-use and management issues of concern in the Assabet
River Basin are common to many other basins in eastern
Massachusetts and adjacent States, where communities are
striving to balance growth and the available water resources.
The methods and results of this study provide tools that can be
used to address these issues.
Introduction 3
BOYLSTON
MARLBOROUGH
NORTH
BROOK
SUBBASIN
COLD
HARBOR
AND
HOWARD
BROOKS
SUBBASIN
HOP
BROOK
SUBBASIN
ASSABET MAIN STEM
HEADWATERS
SUBBASIN
ASSABET MAIN STEM
MIDDLE SUBBASIN
DANFORTH
BROOK
SUBBASIN
ELIZABETH
BROOK
SUBBASIN
FORT POND
BROOK
SUBBASIN
TAYLOR BROOK
SUBBASIN
SPENCER
BROOK
SUBBASIN
NASHOBA
BROOK
SUBBASIN
ASSABET MAIN STEM
LOWER SUBBASIN
ASSABET MAIN STEM
UPPER SUBBASIN
STIRRUP BROOK SUBBASIN
EXPLANATION
012345 MILES
0
2 KILOMETERS
4
135
From USGS and MassGIS data sources, Massachusetts State Plane
Coordinate System, Mainland Zone.
01097000
ACW158
POND
WETLAND
BASIN AND SUBBASIN BOUNDAR
Y
TOWN BOUNDARY
STREAM-GAGING STATION AND
NUMBER
LONG-TERM OBSERVATION WELL
AND IDENTIFIER
DAM
FORT MEADOW BROOK
SUBBASIN
495
290
495
2
01097000
01097300
ACW158
A1
A1
Impoundmnet
Impoundmnet
Chauncy Lake
Chauncy Lake
Lake
Lake
Boon
Boon
White
White
Pond
Pond
Warner
Warner
Pond
Pond
Nagog
Nagog
Pond
Pond
Little Chauncy Lake
Little Chauncy Lake
Bartlett Pond
Bartlett Pond
Lake
Lake
Williams
Williams
Fort Meadow
Fort Meadow
Resevoir
Resevoir
Millham
Millham
Resevoir
Resevoir
Rocky
Rocky
Pond
Pond
Delaney
Delaney
Pond
Pond
Long
Long
Pond
Pond
Fort
Fort
Pond
Pond
Gates
Gates
Pond
Pond
Hop Brook
Hop Brook
Cold Harbor
Cold Harbor
Brook
Brook
Howard Brook
Howard Brook
North Brook
North Brook
Stirrup Brook
Stirrup Brook
Fort Pond Brook
Fort Pond Brook
S
p
e
n
c
e
r
B
r
o
o
k
D
a
n
f
o
r
t
h
B
r
o
o
k
A
s
s
a
b
e
t
R
i
v
e
r
A
s
s
a
b
e
t
R
i
v
e
r
N
a
s
h
o
b
a
B
r
o
o
k
A1
Impoundment
Chauncy Lake
Lake
Boon
White
Pond
Warner
Pond
Nagog
Pond
Little Chauncy Lake
Bartlett Pond
Lake
Williams
Fort Meadow
Reservoir
Millham
Reservoir
Rocky
Pond
Delaney
Pond
Long
Pond
Fort
Pond
Gates
Pond
Hop Brook
Cold Harbor
Brook
Howard Brook
North Brook
Stirrup Brook
Fort Pond Brook
S
p
e
n
c
e
r
B
r
o
o
k
D
a
n
f
o
r
t
h
B
r
o
o
k
A
s
s
a
b
e
t
R
i
v
e
r
A
s
s
a
b
e
t
R
i
v
e
r
N
a
s
h
o
b
a
B
r
o
o
k
E
l
i
z
a
b
e
t
h
B
r
o
o
k
71
o
36'
71
o
24'
42
o
18'
42
o
24'
42
o
30'
42
o
30'
73
o
00'
72
o
00'
71
o
00'
70
o
00'
41
o
30'
STUDY
BASIN
0
10 20
30
40
50 KILOMETERS
0
10
20
30
40
50 MILES
BASIN BOUNDARIES
MASSACHUSETTS
BAY
A
T
L
A
N
T
I
C
O
C
E
A
N
EXPLANATION
MASSACHUSETTS
Figure 1. The Assabet River Basin, subbasins, streamflow-gaging stations, and long-term observation well, eastern
Massachusetts.
4 Simulation of Ground-Water Flow and Evaluation of Water-Management Alternatives in the Assabet River Basin, Eastern MA
Purpose and Scope
This report describes current water-resource conditions in
the Assabet River Basin, the development, calibration, and
limitations of numerical ground-water-flow models for the
basin, and simulations made with the models to evaluate the
effects of water withdrawals and discharges on streamflows. It
also presents the data collected to define water resources in the
basin, and upon which the steady-state and transient models
were developed. The models include average water with-
drawals and discharges for a 5-year period, 1997–2001, which
was near long-term average hydrologic conditions. Simulation
results of several scenarios of altered withdrawals, discharges,
or other water-management practices also are described.
Finally, the report describes the use of optimization techniques
to investigate the potential for reduced streamflow depletion
through altered water-management practices in the upper part
of the basin.
Description of the Study Area
The Assabet River Basin (fig. 1) encompasses an area
of 177 mi
2
within the Merrimack River Basin in eastern
Massachusetts. The study area includes all or part of 20 towns.
The basin is elongate in the northeast-southwest direction,
parallel to regional geologic features (Zen and others, 1983).
Topography varies from gently rolling to hilly, with elevations
ranging from about 100 to 750 ft above NGVD 29. Higher
elevations and steeper slopes are along the northwestern
boundaries of the basin. The Assabet River flows northeastward
from Westborough, through lowlands near the eastern basin
boundary, about 31 mi to its confluence with the Sudbury River
in Concord, MA. The climate is humid and temperate. Precipi-
tation averages 47 in/yr, and average temperature ranges from
25°F in January to 71°F in July, according to records from
nearby weather stations (National Oceanic and Atmospheric
Administration, 2002).
Land use in the Assabet River Basin in 1999 was primarily
forested or open (51 percent) and residential (28 percent, mostly
low and medium density), with agricultural (8 percent),
commercial or industrial (5 percent), water and wetlands (5
percent) representing small fractions of the basin area
(MassGIS, 2001). Land use and population density varied
widely among towns. Population density ranged from about 200
to nearly 2,000 people/mi
2
in 2000 (U.S. Census Bureau, 2003).
Towns varied in residential land use from 13 to 39 percent, and
in commercial or industrial land use and in agricultural land use
from less than 1 to 14 percent each (1999 data; MassGIS, 2001).
Forest cover varied from 34 to 66 percent, in 1999. Densely
developed areas clustered along the main stem Assabet River
and near the southeastern boundary of the basin. The most
rapidly growing towns, however, were in the headwaters and
along the northwestern upland parts of the basin; these include
Bolton, Boxborough, Shrewsbury, Westborough, and Westford
(fig. 1). Population increased in these towns from 27 to 46
percent between 1990 and 2000 (U.S. Census Bureau, 2003).
Previous Studies
Information on the hydrogeology and water resources
of the Assabet River Basin is available from many sources.
Several publications describe the surficial geology of parts of
the study area (Campbell, 1925; Jahns, 1953; Hansen, 1956;
Perlmutter, 1962; Koteff, 1966; and Shaw, 1969). Basic hydro-
geologic data, including well and boring logs, water levels, and
the locations of high transmissivity zones, are described in
Pollock and Fleck (1964), Pollock and others (1969), and
Brackley and Hansen (1985). An analysis of aquifer yields
developed on the basis of streamflow data was completed by
Bratton and Parker (1995). Continuous-record streamflow data
for the Assabet River and for Nashoba Brook, a tributary of
the Assabet River, are available from two long-term USGS
streamflow-gaging stations (fig. 1; Socolow and others, 2003).
Historical streamflow data also were collected at partial-record
stations in the basin that were used for USGS low-flow studies
(Ries, 1993, 1994, and 1999; Ries and Friesz, 2000). Stream-
flow and other hydrologic data for the Assabet River and its
tributaries were collected for a recently completed TMDL
study, in support of a surface-water model of the basin (ENSR
International, 2001, 2004). Data also were being collected at the
time of this study by the Organization for the Assabet River
(2003a), as part of a stream monitoring and public-outreach
program. Streamflow requirements for the protection of aquatic
habitat were recently assessed by Parker and others (2004) at six
sites in the basin. A water-use investigation of the Assabet,
Concord, and Sudbury River Basins (L.K. Barlow, U.S.
Geological Survey, oral commun., 2003) was ongoing at the
time of this study. Information on existing conditions of water
use and disposal for communities in the Assabet Consortium
were available in the Comprehensive Wastewater Management
Plans for these towns (Camp, Dresser, & McKee, 2001; 2002;
Dufresne-Henry, 2001, 2002; Earth Tech 2001a, 2001b, 2001c,
2001d, 2001e, 2002b, 2002c, 2002d; Fay, Spofford, and
Thorndike, 2001a, 2001b, 2002a, 2002b). The Assabet River
Consortium includes the six towns (Hudson, Marlborough,
Maynard, Northborough, Shrewsbury, and Westborough) in
the basin that discharge wastewater to the river (Earth Tech,
2001a). Also, consultants to the towns have completed many
small-scale hydrogeologic investigations. These studies were
completed to locate water-supply sources, to determine well-
head protection areas for public-supply wells, to investigate
ground-water contamination, or to support specific develop-
ment projects. Information available from these reports include
well and boring logs, hydrogeologic maps and sections, and
Ground- and Surface-Water Resources 5
results of aquifer tests and numerical simulations. Consultant
reports used in this study include ABB Environmental Services
(1996), Camp, Dresser, & McKee (1990), Dufresne-Henry
(1981, 1989, 1993, 1996, 1999), Earth Tech (2000a, 2000b,
2000c, 2000d, 2000e), Ecology and Environment (1994),
Epsilon Associates (2000, 2002a, 2002b), Geologic Services
Corporation (1984, 1985, 1987, 1989, 1995a, 1995b, 1996,
2000), GeoScience Consultants (1988), GeoTrans (2001),
Goldberg-Zoino & Associates (1985), Goldberg, Zoino,
Dunnicliff & Associates (1980a, 1980b), HMM Associates
(1987), Keystone Environmental Resources (1991), McCulley,
Frick, & Gilman (1997), Metcalf & Eddy (1994), Rizzo
Associates (1990), Sasaki Associates (1989), Weston &
Sampson Engineers (1997), and Whitman & Howard (1986,
1987a, 1987b, 1987c).
Ground- and Surface-Water
Resources
Many factors affect water resources in the Assabet River
Basin. Ground-water flow is influenced by the hydraulic
properties of the geologic units in which it occurs and the timing
and quantity of recharge. Impoundments, ponds, and wetlands,
as well as climate and topography, affect surface-water flow.
Ground-water- and surface-water-flow systems are in close
hydraulic connection, especially in the surficial geologic
materials.
Geologic Setting
Ground water occurs in three major geologic units in the
Assabet River Basin—stratified glacial deposits, glacial till, and
bedrock (fig. 2). The stratified glacial deposits consist of sorted
and layered sand, gravel, silt, and clay deposited by meltwater
in streams or lakes in valleys and lowlands during the last
glacial period. The till is generally an unsorted, unstratified
mixture of clay, silt, sand, gravel, cobbles, and boulders,
deposited directly by the glacial ice. Locally, till forms thick
deposits in uplands or in areas of stratified glacial deposits and
covers uplands in a thin layer. Crystalline bedrock underlies the
stratified glacial deposits and till, and consists primarily of
metasedimentary, metavolcanic, and metaintrusive rocks (Zen
and others, 1983). Alluvium and swamp deposits are relatively
minor components of the hydrogeologic system in the basin,
and are not areally extensive and (or) form relatively thin
surficial layers.
Although the stratified glacial deposits are discontinuous
and heterogeneous, they are the most productive aquifers in
the basin. They occur along the Assabet River and its major
tributaries and cover about 43 percent of the study area (fig. 2).
The areal extent of stratified glacial deposits in the basin was
determined from published and unpublished surficial geologic
maps (J.R. Stone, U.S. Geological Survey, written commun.,
2002). The thickness of the stratified glacial deposits was
mapped by contouring the elevation of the underlying bedrock
or till surface (J.R. Stone, U.S. Geological Survey, written
commun., 2002) and subtracting that elevation from the land-
surface elevation. Data on depth to bedrock, till, or drilling
refusal were obtained from about 830 well logs or borings,
available from USGS files, from the reports by private
consultants cited previously, and from wells installed during
this study. The thickness of the stratified glacial deposits ranges
from 0 at its edges to about 160 ft (fig. 2). Typically, the
deposits are less than 75 ft thick, and average only about 35 ft
thick throughout the mapped area. Stratified glacial deposits are
relatively thick in southeastern Stow, where a bedrock valley
may represent the preglacial route of the Assabet River
(Hansen, 1956; Perlmutter, 1962), and in Concord and
southeastern Acton (fig. 2).
The stratified glacial deposits in the Assabet River Basin
were deposited during successive pauses of the retreating ice
margin in association with two meltwater lakes, glacial Lakes
Assabet and Sudbury (Campbell, 1925; Hansen, 1956; Koteff,
1966; J.R. Stone, U.S. Geological Survey, oral commun.,
2002). They include glacial stream, deltaic, and lake-bottom
deposits. Distinct sequences of these units, as have been
identified elsewhere in New England (Stone and others, 1998;
Randall, 2001), have not been identified in the Assabet River
Basin, and geologic mapping has not distinguished sediment
packages based on lithology or depositional setting. Ice-contact
deposits, variable in thickness, grain size, and sorting, are
common throughout the basin. These stratified glacial deposits
are characteristic of the low-relief, narrow valleys in southern
New England (Randall, 2001). The areas of thick stratified
glacial deposits in southeastern Stow and Concord, mapped as
outwash plain and delta deposits, include sediments that were
deposited farther from the ice margin and are better sorted than
the more proximal ice-contact deposits (Hansen, 1956; Koteff,
1963). Also, near the Assabet River from Stow to Concord,
thick layers of fine sand, silt, and clay underlie coarser-grained
sediments. Fine-grained sediments also occur at depth farther
south in Northborough and Westborough; fine-over-coarse
sequences also are common in Westborough. These fine-
grained sediments probably are lake-bottom sediments (Koteff,
1963); their distribution, however, is discontinuous. In areas of
coarse-grained deposits, depressions left by melting ice blocks
are common and often are occupied by kettle lakes or isolated
wetlands.
6 Simulation of Ground-Water Flow and Evaluation of Water-Management Alternatives in the Assabet River Basin, Eastern MA
EXPLANATION
STRATIFIED
GLACIAL
DEPOSITS
THICKNESS, IN FEET
0 40 80 120 160
THIN TILL AND BEDROCK
THICK TILL
BASIN BOUNDARY
TOWN BOUNDARY
012345 MILES
0 2 KILOMETERS4
135
From USGS and MassGIS data sources, Massachusetts State Plane
Coordinate System, Mainland Zone.
71
o
36'
71
o
24'
42
o
18'
42
o
24'
42
o
30'
Figure 2. Surficial geology of the Assabet River Basin, eastern Massachusetts.
Ground- and Surface-Water Resources 7
Till in the Assabet River Basin consists of a thin upper till
and a discontinuous, thick lower till. The upper or younger till
forms a thin surficial layer over bedrock throughout the basin.
The till is loosely consolidated, relatively permeable, character-
ized by abundant boulders, and typically 10 to 15 ft thick or less
(Campbell, 1925; Jahns, 1953; Hansen, 1956; Koteff, 1966).
The lower or older till forms hills with deposits that often are 50
to 80 ft thick, and may exceed 100 or 200 ft thick. The thick
lower till is compacted tightly and relatively impermeable. Hills
of thick till (drumlins) are rounded and commonly elongate in
the north-south direction, parallel to the direction of regional ice
flow. Because of its low transmissivity, till rarely is used for
water supply in the basin, even by domestic water users.
Bedrock consists of Proterozoic or Lower Paleozoic
metasedimentary, metavolcanic, and intrusive igneous rocks,
including the Nashoba Formation, Andover Granite, and
Marlboro Formation (Zen and others, 1983; Goldsmith, 1991a).
Typical rock types are mica schist and gneiss, granite, diorite,
and amphibolite. The basin lies in a structural zone between two
major fault zones, which trend northeast-southwest across
the State. Within this zone, beds dip steeply and faulting is
pervasive and complex (Goldsmith, 1991b; Walsh, 2001). Two
regional faults within the basin, the Assabet River and Spencer
Brook faults, extend northeast-southwest from Northborough to
West Concord. Faults and joints are important hydrologically,
because most water in bedrock is stored and flows in these
openings; the unbroken rock is nearly impermeable.
Hydraulic Properties
Information about the hydraulic properties of hydrogeo-
logic units in the basin is most readily available for the stratified
glacial deposits than for the other geologic units, because large
water supplies commonly are developed in these deposits.
Horizontal hydraulic conductivity values at public-supply
wells, determined from analysis of aquifer tests, averaged about
190 ft/d (median value equal to 140 ft/d) and ranged from 80
to 675 ft/d (table 1). These values likely represent the most
permeable and most productive deposits in the basin. Well logs,
distributed throughout the stratified glacial deposits, are another
source of information about hydraulic properties of sediments.
Brackley and Hansen (1985) used horizontal hydraulic conduc-
tivity values estimated from well logs, along with other data,
to map transmissivity (hydraulic conductivity multiplied by
aquifer thickness) in the basin. The estimates were based on
values for sediments of various grain size and sorting in New
England, compiled from aquifer tests and other sources (B.P.
Hansen, U.S. Geological Survey, oral commun., 2002). The
values determined by Brackley and Hansen (1985), and similar
values calculated for well logs inventoried in this study, were
used to characterize horizontal hydraulic conductivity in the
stratified glacial deposits (fig. 3). Spatially, hydraulic conduc-
tivity values from well logs and aquifer tests are variable, which
reflects the vertical and horizontal heterogeneity of sediment
characteristics (for well logs) because the values are depth-
weighted averages. Hydraulic conductivity values, however,
were significantly different among the mapped transmissivity
zones, with geometric mean values of 46, 72, and 108 ft/d for
low-, medium-, and high-transmissivity zones, respectively.
Little information about vertical hydraulic conductivity is
available for stratified glacial deposits in the study area, but
values can be estimated from reported ratios of vertical to
horizontal conductivity. Reported ratios range from 1:3 to 1:5,
for coarse-grained stratified glacial deposits, and from 1:30 to
1:100, for fine-grained deposits (Dickerman and others, 1990;
Masterson and Barlow, 1997; Masterson and others, 1998;
Stone and Dickerman, 2002). Reported values of specific yield,
or unconfined storage coefficient, of stratified glacial deposits
ranges from 0.16 to 0.47, with typical values of 0.25 to 0.33 for
medium to coarse sand and gravel, 0.21 to 0.33 for fine sand,
and 0.02 to 0.08 for silt and clay (Johnson, 1967; Morris and
Johnson, 1967; Moench and others, 2000; Kontis and others, in
press). Storage coefficients from aquifer tests in coarse-grained
deposits in the basin range from 0.07 to 0.14 (table 1); these
values may be representative of short-term aquifer responses to
stress. Less information is available for confined storage coeffi-
cient for stratified glacial deposits than for specific yield.
Typical values of specific storage are 1×10
-4
ft
-1
for fine-
grained deposits and 1×10
-6
ft
-1
for coarse-grained deposits in
the glaciated northeastern United States (Kontis and others, in
press); these values would need to be multiplied by aquifer
thickness to determine the storage coefficient.
Hydraulic properties of till are not well known. Horizontal
hydraulic conductivity of till in the study area probably ranges
from 0.01 to 10 ft/d (Allen and others, 1963; Randall and others,
1988; Melvin and others, 1992; Tiedeman and others, 1997;
Lyford and others, 2003; Kontis and others, in press), with the
thin till at the upper end of the reported range. The ratio of
vertical to horizontal hydraulic conductivity may range from
1:1 to 1:100. The vertical hydraulic conductivity of thin
surficial deposits, consisting of lake-bottom silt, fine sand, and
thin till, as determined from an aquifer test for municipal supply
wells in Maynard, ranges from 0.13 to 1.35 ft/d, averaging 0.48
ft/d (Lyford and others, 2003). Specific yield values of 0.06 to
0.26 have been reported for silty and sandy till (Allen and
others, 1963; Morris and Johnson, 1967).
8 Simulation of Ground-Water Flow and Evaluation of Water-Management Alternatives in the Assabet River Basin, Eastern MA
1
Bay State Circuits, Northborough, MA; test well location at 42°19′09″ latitude and 71°36′38″ longitude. This well was installed for remediation, not public supply.
2
Assabet Valley National Wildlife Refuge, Sudbury, MA; test well location at 42°24′40″ latitude and 71°29′15″ longitude.
3
Marlboro Corporate Center, Marlborough, MA; test well location at 42°22′01″ latitude and 71°35′47″ longitude.
Table 1. Hydraulic properties of stratified glacial deposits as determined by analysis of aquifer tests at public-supply wells in the Assabet River Basin, eastern Massachusetts.
[Well site: See table 8 for additional identification information; site locations shown on figure 16 unless otherwise indicated. Transmissivity: Mean of reported values or a value otherwise considered
representative; ft, foot; ft/d, foot per day; ft
2
/d, square foot per day; gal/min, gallons per minute; , not available]
Well site
Predominant
grain size of
tested interval
Year of
test
Length
of test
(days)
Well
discharge
(gal/min)
Transmis-
sivity
(ft
2
/d)
Saturated
thickness
(ft)
Hydraulic
conduc-
tivity
(ft/d)
Storage
coeffi-
cient
Reference
AN-06G Fine to coarse sand and gravel 1970 19 500 5,290 85 0.14 Goldberg, Zoino, Dunnicliff & Associates, 1980a,b
AN-05G Fine to coarse sand and gravel 1970 13 265 6,220 110 .07 Goldberg, Zoino, Dunnicliff & Associates, 1980a,b
AN-09G Sand and gravel 1980 5 171 4,390 40 110 Dufresne-Henry, 1996
AN-10G Sand and gravel 1979
1980
10
7
365
269
5,610 40 140 Dufresne-Henry, 1996
AN-11G Fine to coarse sand and gravel 1991 9 395 7,730 30 258 Dufresne-Henry, 1993
BSC
1
Silt and clay 1989 3 1.75 53 40 1.3 .001 Rizzo Associates, 1990
ARNWR
2
Sand and gravel 1955 2 603 4,500 45 101 .2 Perlmutter, 1962
CN-01G Medium to coarse sand and gravel 1966 1.5 4,400 70–90 80 Weston and Sampson, 1997
HD-01G Sand and gravel 1967 2 710 23,600 35 675 Earth Tech, 2000c
MCC
3
Fine to coarse sand and gravel 1989 1 229 8,300 51 163 Sasaki Associates, 1989
NB-01G Medium to coarse sand and gravel 1955 7 350 8,600 60 140 Earth Tech, 2000b
NB-03G Sand and gravel 1969 5,050 53 95 Earth Tech, 2000b
WB-05G and
WB-06G
Fine to coarse sand and gravel 1984 7 450 9,210 50 184 Geologic Services Corporation, 1985
WB-07G Coarse sand and gravel 1994 8 393 9,700 50 194 .10 Geologic Services Corporation, 1995
WB-03G Sand and gravel 1981 2 600 11,200 35 320 Earth Tech, 2000e
Ground- and Surface-Water Resources 9
EXPLANATION
012345 MILES
0 2 KILOMETERS4
135
From USGS and MassGIS data sources, Massachusetts State Plane
Coordinate S
y
stem, Mainland Zone.
TRANSMISSIVITY OF
STRATIFIED GLACIAL
DEPOSITS, IN FEET
SQUARED PER DAY
Less than 1,350
1,350–4,000
Greater than 4,000
TILL AND BEDROCK
BASIN BOUNDARY
TOWN BOUNDARY
HYDRAULIC CONDUCTIVITY—
Water-supply wells shown in blue.
Symbol size is proportional to value,
in feet per day
10
50
150
250
350
71
o
36'
71
o
24'
42
o
18'
42
o
24'
42
o
30'
Figure 3. Depth-weighted hydraulic conductivity from well logs and transmissivity zones in stratified glacial deposits in the
Assabet River Basin, eastern Massachusetts. Transmissivity zones from Brackley and Hansen (1985).
10 Simulation of Ground-Water Flow and Evaluation of Water-Management Alternatives in the Assabet River Basin, Eastern MA
Hydraulic properties of bedrock generally are low but
variable. Median values of hydraulic conductivity of crystalline
bedrock for large and small supply wells in New England and
adjacent areas range from 0.45 to 0.9 ft/d (Randall and others,
1966; Randall and others, 1988). Hydraulic conductivity in
fractured crystalline bedrock in the Mirror Lake area, New
Hampshire, varies over 6 orders of magnitude; representative
values determined through model calibration were 0.02 and
0.09 ft/d (Tiedeman and others, 1997). Aquifer tests of four
industrial supply wells in Acton and Hudson yielded hydraulic
conductivity values of 0.18, 0.24, 0.97, and 2.8 ft/d (Epsilon
Associates, 2000, 2002a, 2002b). The values for supply wells in
bedrock, in the study area and elsewhere, likely represent the
more permeable bedrock zones. Little information is available
on vertical conductivity or storage properties of bedrock, which
are likely to be highly variable. Vertical conductivity at the
Maynard supply-well site ranged from 0.13 to 1.35 ft/d (Lyford
and others, 2003). Storage coefficients for the industrial supply
wells in Hudson and Acton ranged from 3×10
-6
to 0.067
(Epsilon Associates, 2000, 2002a, 2002b), and a median value
for large supply wells in New England was about 2×10
-4
(Randall and others, 1988).
Ground-Water Flow
Ground water in the study area generally flows from
topographic highs in the uplands toward stream channels and
toward the stratified glacial deposits in valleys and lowlands.
The water table mimics topography, such that surface- and
ground-water divides typically coincide, especially in uplands.
Precipitation recharges ground water in till and bedrock upland
areas and in the stratified glacial deposits; surface runoff from
uplands also recharges the stratified glacial deposits at the edges
of valleys. Ground-water levels and flow directions, particu-
larly in the stratified glacial deposits, are strongly influenced by
the locations and elevations of streams, which, along with
wetlands and pumping wells, are the discharge points for the
ground-water-flow system (Winter and others, 1998; Randall
and others, 2001).
Recharge
Recharge rates for the Assabet River Basin were estimated
from two approaches and data sources—streamflow records
and climate data. The recharge estimates were made to charac-
terize the overall water budget for the basin and to guide
calibration of the ground-water-flow models. The recession-
curve displacement method was applied to mean daily stream-
flow records from the two continuous-record streamflow-
gaging stations (fig. 1) in the basin. The computer program
RORA, developed by Rutledge (1993, 1998) on theory by
Rorabaugh (1964), was used to estimate recharge rates. In this
method, recharge is quantified from the upward displacement of
the streamflow-recession hydrograph after streamflow peaks.
Individual recharge events are summed over yearly and
monthly intervals. Several simplifying assumptions about the
flow system are made, including the assumption of uniform
aquifer properties and an instantaneous and uniform aquifer
response to recharge events throughout the basin.
A water-balance method also was used to calculate daily
recharge from climate data as:
,(1)
where
Climate data from the nearby Bedford and West Medway, MA,
weather stations (about 5 and 15 mi, respectively, from the
basin) were used for this analysis because they were considered
most representative of conditions in the study area. Potential
evapotranspiration (PET) for use in the water-balance method
was calculated by using methods for estimating evaporation in
settings where actual evaporation equals PET. The Hamon
(1961) method (Lumb and Kittle, 1995) and the available
climate data (mean daily temperature and hours of sunlight)
initially were used. Because the Hamon method underestimates
actual evaporation (Winter and others, 1995), values from this
method were adjusted upward based on a comparison of
monthly PET values calculated by Hamon and Penman methods
for a basin in southern Rhode Island (P.J. Zarriello, U.S.
Geological Survey, written commun., 2003). The Penman
equation (Penman, 1948) more completely characterizes the
driving forces of evaporation because it includes temperature,
solar radiation, and wind speed; therefore, it is considered a
better approximation of actual evaporation (Penman, 1948;
Veihmeyer, 1964; Winter and others, 1995). The difference
between mean daily streamflow and mean daily base flow
(estimated with the automated hydrograph-separation method,
PART; Rutledge, 1993, 1998) at the Assabet River streamflow-
gaging station (fig. 1) was used as an estimate of direct runoff.
Use of PART in an estimate of direct runoff assumes that
anthropogenic effects on streamflow (for example, increased
wastewater discharge to the river from storm inflow to sewers)
are negligible compared to those resulting directly from precip-
itation. The water-balance method was applied by using a
FORTRAN computer program (D.R. LeBlanc, U.S. Geological
Survey, written commun., 2002) that calculates ET, soil
R is recharge;
P is precipitation;
ET is evapotranspiration;
∆SM is change in soil moisture; and
DR is direct runoff.
RPET– ∆SM– DR–=
Ground- and Surface-Water Resources 11
moisture deficit, and recharge on a daily basis, as described by
Thornthwaite and Mather (1957). ET is set equal to PET when
precipitation exceeds PET and is equal to precipitation and
available soil moisture when precipitation is less than PET. The
remaining available water first goes to satisfy the soil moisture
deficit, then to recharge. A maximum soil storage capacity of
2 in. was assumed (Thornthwaite and Mather, 1957). No lag
time is applied between precipitation and recharge to the water
table, such that unsaturated-zone travel time is assumed
negligible. As with the results produced by the RORA method,
the water-balance method results in basin-wide recharge rates
that simplify and homogenize recharge, runoff, and ET
processes.
Recharge rates of about 20 in/yr were calculated from
streamflow records, for long-term conditions and for the 1997–
2001 period (table 2). The water-balance method yielded rates
of about 17 in/yr. These values are consistent with recharge
rates of 17.5 to 25.5 in/yr, estimated from streamflow records
and model calibration for basins in southern New England with
variable percentages of stratified glacial deposits and till-
covered uplands (Bent, 1995, 1999; Barlow, 1997; Barlow and
Dickerman, 2001; DeSimone and others, 2002). Although
average annual rates for 1997–2001 are similar to long-term
rates, this 5-year period was unusual in that it contained
relatively dry summers in 1997 and 1999 and an extended
period of dry weather that began in September 2001 (fig. 4).
Recharge rates of 17 to 20 in/yr for 1997–2001 correspond to
total inflow volumes to the basin of 143 to 169 Mgal/d (222 to
261 ft
3
/s).
1
Assabet River streamflow-gaging station, 1941–2002; Nashoba Brook
streamflow-gaging station, 1964–2002; water-balance method, 1958–2002.
The distribution of annual recharge among months from
both methods (fig. 5) is consistent with conceptual models in
which most aquifer recharge occurs during spring and winter
months. Results of the two methods differ in that recharge rates
from streamflow records have a distinct peak in the spring that
may reflect the effects of snowmelt or aquifer storage that are
not captured in the climate-based water-balance method. Unlike
the annual average rates, deviations of 1997–2001 conditions
from long-term average conditions are apparent in the monthly
average rates. Average rates in October, November, and
December for 1997–2001 are lower than long-term average
rates for both methods because of the extended dry period in
2001. Average March and June rates for 1997–2001 are higher
than the long-term average because of some unusually wet
months in that 5-year period (figs. 4 and 5). Both methods,
however, are more accurate for estimating long-term average
rates than for estimating rates at shorter time scales, such as
months (Rutledge, 1998, 2000).
Water Levels
Ground-water levels throughout the basin are strongly
influenced by the locations and elevations of streams, ponds,
and wetlands. Water-level fluctuations also are influenced by
proximity to surface water. Annual fluctuations are smallest
near streams and ponds, and are largest in the uplands, where
thin surficial layers of till may dry out in summer (Randall and
others, 1988). In this study, ground-water levels were measured
only in the stratified glacial deposits; water levels and fluctua-
tions in the till and bedrock upland areas were considered too
variable to be characterized by the data-collection program.
Water levels were measured in 19 wells at about monthly
intervals from September 2001 through December 2002 (fig. 6
and table 3). Data also were available from a long-term
observation well, ACW158, with a continuous record since July
2001 and a 40-year record of intermittent measurements
(Socolow and others, 2003). The wells all were screened in the
stratified glacial deposits. Water levels throughout eastern
Massachusetts during the measurement period were lower than
normal, as shown by records at ACW158 (fig. 7) and at other
long-term observation wells (table 4; Socolow and others, 2002,
2003). Measured annual fluctuations in observation wells
generally ranged from less than 2 to more than 4 ft. Fluctuations
generally were largest in wells near boundaries of stratified
glacial deposits with uplands, such as ACW257 and WRW150,
and smallest in wells near streams, such as HZW147 and
WRW149 (fig. 8).
Table 2. Average annual recharge rates and precipitation for the
Assabet River Basin, eastern Massachusetts.
[in/yr, inches per year]
Period
Precip-
itation
(in/yr)
Recharge (in/yr)
Streamflow hydrograph
displacement method
Water-
balance
method
Assabet
River
station
(01097000)
Nashoba
Brook
station
(01097300)
Data source period
of record
1
46.4 20.6 19.8 17.3
1964–2002 46.4 20.6 19.8 17.2
1997–2001 47.1 20.3 16.4 17.1
12 Simulation of Ground-Water Flow and Evaluation of Water-Management Alternatives in the Assabet River Basin, Eastern MA
JFMAMJJASOND
MONTHLY MEAN,
1997-2002
LONG-TERM
MONTHLY MEAN
J FMAMJ J ASONDJ FMAMJ J A SONDJ FMAMJ J ASOND J FMAMJ J ASONDJ FMAMJ J A SOND
1997 1998 1999 2000 2001 2002
WATER YEAR 2002
PRECIPITATION, IN INCHES
0
2
4
6
8
10
12
Figure 4. Monthly mean precipitation for long-term average conditions (1958–2002) and for 1997–2002 at National
Oceanic and Atmospheric Administration weather stations in Bedford and West Medway, Massachusetts. Data shown
are averages of daily values at the two stations.
JFMAM SJJA OND
MONTH
5
4
2
0
3
1
RECHARGE RATE, IN INCHES
JFMAM SJJA OND
MONTH
JFMAM SJJA OND
MONTH
LONG-TERM AVERAGE
1997–2001
EXPLANATION
A.
B.
C.
Figure 5. Monthly recharge rates estimated from A, streamflow records at the Assabet River streamflow-gaging
station in Maynard; B, streamflow records at the Nashoba Brook streamflow-gaging station; and C, climate data from
Bedford and West Medway weather stations, for long-term average conditions (period of record of data sources) and
1997–2001, Massachusetts.
Ground- and Surface-Water Resources 13
NUW127
A9W53
WRW149
NUW128
WRW150
NUW130
NUW129
01096615
01096600
01096630
01096705
01096700
01096710
01096730
01096805
Wheeler Pond
A1 Impoundment
HZW147
HZW148
HZW149
01096840
01096838
01096853
01096898
01096945
01097000
01097095
01097270
01097048
01097380
01097412
01097300
ACW256
ACW257
ACW255
S3W184
S3W183
MKW165
Warner
Pond
Delaney
Pond
White
Pond
Lake
Boon
Assabet River at Hudson
Assabet River at Maynard
West Pond
WWW160
WWW158
WWW159
ACW158
01096880
Chauncy Lake
Bartlett Pond
Smith Pond
EXPLANATION
012345 MILES
0 2 KILOMETERS4
135
From USGS and MassGIS data sources, Massachusetts State Plane
Coordinate S
y
stem, Mainland Zone.
01096840
Wheeler Pond
A9W53
TILL OR BEDROCK
STRATIFIED GLACIAL
DEPOSITS
BASIN BOUNDARY
STREAMFLOW-
MEASUREMENT
SITE OR GAGING STATION
AND IDENTIFIER
OBSERVATION WELL AND
IDENTIFIER
MEASUREMENT SITE FOR
POND OR IMPOUNDMENT
AND IDENTIFIER
71
o
36'
71
o
24'
42
o
18'
42
o
24'
42
o
30'
Figure 6. Streamflow-measurement sites, observation wells, and pond-measurement sites in the Assabet River Basin,
eastern Massachusetts.
14 Simulation of Ground-Water Flow and Evaluation of Water-Management Alternatives in the Assabet River Basin, Eastern MA
1
Screened interval equal to 9.7 feet. Mean depth to water and mean water-level elevation for water year 2002 are averages of interpolated daily values.
2
No data for June 2002.
3
No data for April 2002.
4
Missing data for winter 2002 because of ice.
Table 3. Characteristics and water levels at observation wells and ponds in the Assabet River Basin, eastern Massachusetts.
[Site locations shown in figure 6. Wells are screened at bottom, with screened interval equal to 5 feet, unless otherwise indicated. Latitude and longitude: In
degrees, minutes, and seconds. NGVD, National Geodetic Vertical Datum; not applicable or not known;
+, plus or minus]
Well identifier
or pond name
Town
Latitude
° ′ ″
Longitude
° ′ ″
Well
depth
(feet below
land surface)
Mean depth
to water
(feet below
land surface)
Mean water-level elevation
(feet above NGVD 29)
Water year
2000
Estimated, 1997–2001
Water
level
90-percent
confidence
limits
Observation wells
A9W53 Berlin 42 21 27 071 37 25 20.3 12.84 227.84 230.09 +0.62
ACW255 Acton 42 27 51 071 28 33 47.7 23.85 195.72 196.19 +.24
ACW256 Acton 42 28 55 071 25 22 21.1 7.74 150.33 150.88 +.29
ACW257 Acton 42 28 29 071 26 16 19.8 11.46 157.84 159.78 +.76
HZW147 Hudson 42 23 20 071 31 00 27.6 19.75 181.89 182.57 +.22
HZW148 Hudson 42 23 56 071 32 33 18.0 10.72 200.43 201.48 +.28
HZW149 Hudson 42 24 01 071 32 38 19.5 12.08 191.37 192.18 +.30
MKW165 Maynard 42 25 24 071 27 06 18.7 7.31 194.53 195.55 +.36
NUW127 Northborough 42 19 07 071 39 32 21.7 6.78 296.96 298.44 +.43
NUW128 Northborough 42 17 59 071 38 13 52.6 23.82 272.60 273.40 +.23
NUW129 Northborough 42 19 32 071 38 44 17.5 8.19 285.37 285.97 +.34
NUW130
1
Northborough 42 20 36 071 37 31 19.6 12.44 225.56 227.15 +.65
S3W183 Stow 42 24 49 071 32 23 30.5 12.22 193.29 194.01 +.26
S3W184 Stow 42 25 49 071 29 25 32.4 13.53 188.42 189.05 +.19
WRW149 Westborough 42 18 16 071 36 45 11.4 5.01 275.92 276.50 +.21
WRW150 Westborough 42 17 36 071 38 10 34.0 16.24 276.01 277.28 +.38
WWW158 Westford 43 32 31 071 26 16 16.4 11.62 188.22 189.74 +.57
WWW159 Westford 42 33 14 071 27 09 25.4 11.56 203.69 204.93 +.27
WWW160 Westford 42 32 57 071 24 37 25.5 13.90 207.08 207.80 +.05
Ponds or impoundments
A1 Impoundment
2
Westborough 42 16 01 071 38 08 309.54
Assabet River
3
Hudson 42 23 11 071 34 34 206.42 206.68 +.05
Assabet River Maynard 42 25 29 071 28 10 176.12 176.45 +.12
Bartlett Pond
2
Northborough 42 19 14 071 36 55 273.04 273.22 +.18
Chauncy Lake
2
Westborough 42 17 26 071 36 47 280.44 280.81 +.18
Delaney Pond
4
Stow 42 27 04 071 32 39 229.45 229.75 +.15
Lake Boon Stow 42 24 21 071 31 23 186.60
Smith Pond
4
Northborough 42 17 31 071 39 28 288.79 289.41 +.40
Warner Pond Concord 42 27 32 071 23 51 120.29
West Pond
4
Bolton 42 25 49 071 34 48 311.79 312.20 +.08
Wheeler Pond
4
Berlin 42 21 27 071 37 47 224.25 224.88 +.31
White Pond Stow 42 23 38 071 28 50 189.22 190.25 +.19
Ground- and Surface-Water Resources 15
Average water levels for 1997–2001 at observation wells
in the basin were estimated by relating the measured monthly
values to water levels at nearby long-term observation wells.
Water levels at study sites initially were compared using
scatterplots with same-day water levels at 17 long-term wells
(table 4; only wells used are listed). Same-day water levels at
long-term wells were interpolated between measured values, if
necessary, by using the EXPAND procedure of SAS (SAS
Institute, 1993). For each study site, one to six long-term wells
were identified that correlated closely (R
2
values of linear
regressions greater than 0.8) with the site. Relations between
water levels at each study site and each long-term well were
developed by using the Maintenance of Variance Extension,
Type 1 (MOVE.1) method (Hirsch, 1982). The MOVE.1
equations were used to generate multiple estimates of mean
annual and monthly water level during 1997–2001 for each
study site, as described in DeSimone and others (2002); the
associated mean square error of each relation (MSE) was used
to combine the multiple estimates from each site into weighted
average estimates of mean annual and monthly water level for
1997–2001 (table 3). The MSE also was used to calculate 90-
percent confidence intervals for the estimates, as described in
DeSimone and others (2002). Estimated annual average water
levels for 1997–2001 at observation wells were about from 0.5
to 1.5 ft higher than the measured values for water year 2000
(table 3). Estimated average monthly water levels for 1997–
2001 peaked earlier and higher than measured water levels,
which is consistent with the trends shown at the long-term
continuous-record monitoring well ACW 158 (fig. 7).
136
135
134
133
132
131
JFMAM SJJA ONDSJA OND
2001 2002
LONG-TERM MONTHLY AVERAGE
DAILY AVERAGE, JULY 2001–
DECEMBER 2002
MONTHLY AVERAGE, 1997–2001
EXPLANATION
WATER LEVEL, IN FEET
ABOVE NGVD 29
Figure 7. Monthly and daily average water levels
at long-term observation well ACW158, Assabet
River Basin, eastern Massachusetts.
1
Open-end well, cased to depth listed.
2
Well screened in glacial till.
Table 4. Characteristics and water levels at long-term observation wells near the Assabet River Basin, eastern Massachusetts.
[Town : See Socolow and others (2003) for additional location information. Well-screen interval: Wells screened in stratified glacial deposits, unless otherwise
indicated. NGVD, National Geodetic Vertical Datum]
Well
identifier
Town
Period of
record
Well-screen
interval
(feet below
land surface)
Mean depth
to water
(feet below
land surface)
Mean water-level elevation
(feet above NGVD 29)
Period of
record
1997–2001
Water year
2002
ACW158 Acton 1965–present 32–34 18.94 134.06 134.24 132.73
CTW165 Concord 1965–present 65–67 41.52 157.74 158.48 155.40
CTW167 Concord 1965–present 22–25 7.38 127.62 127.21 124.82
DVW10 Dover 1965–present 52–54 33.37 126.63 126.59 126.54
FXW3 Foxborough 1965–present 30–32 19.12 270.88 271.02 270.03
HLW23 Haverhill 1960–present
1
15 12.15 92.80 92.97 91.71
LTW104 Lexington 1965–present 19–21 53.37 177.40 177.73 177.81
NNW27 Norfolk 1965–present 16–18 6.10 153.90 154.41 153.28
NXW54 Northbridge 1984–present 10–12 4.23 365.77 365.37 365.40
SSW12
2
Southborough 1990–present 18–20 6.95 443.05 442.63 440.18
SYW1
2
Sterling 1947–present
1
15 5.46 704.54 704.51 702.21
XMW78 Wilmington 1951–present
1
12 7.94 87.06 86.91 86.16
WKW2 Wayland 1965–present 31–33 16.25 141.50 141.53 140.69
16 Simulation of Ground-Water Flow and Evaluation of Water-Management Alternatives in the Assabet River Basin, Eastern MA
ACW256A9W53 ACW257
WRW149 WRW150 WWW158
S3W184NUW128HZW147
225
227
226
228
229
230
231
232
233
234
235
180
181
182
183
184
185
273
274
275
276
277
278
148
149
150
151
152
153
270
271
272
273
274
275
274
275
276
277
278
279
184
186
185
187
188
189
190
191
192
193
194
186
187
188
189
190
191
153
155
154
156
157
158
159
160
161
162
163
EXPLANATION
MEASURED, 2001–02
ESTIMATED MONTHLY AVERAGE,
1997–2001
WATER LEVEL, IN FEET ABOVE NGVD 29
JFMAM SJJA ONDSOND
2001 2002
JFMAM SJJA ONDSOND
2001 2002
JFMAM SJJA ONDSOND
2001 2002
Figure 8. Measured water levels, September 2001 through December 2002, and estimated average monthly water levels,
1997–2001, at selected observation wells in the Assabet River Basin, eastern Massachusetts.
Ground- and Surface-Water Resources 17
Surface Water
The Assabet River originates at a large flood-control dam
and impoundment at its headwaters in Westborough (the A1
Impoundment), and is impounded by six other mill dams before
joining the Sudbury River in Concord (fig. 1). Some of the
impoundments, such as that upstream of the Ben Smith Dam in
Maynard, extend for several miles. The total elevation change
along the length of the river is about 200 ft and occurs mostly
at the dams and near the headwaters of the river. Most major
tributaries in the basin flow from northwest to southeast and
include Hop, Cold Harbor, Howard, Stirrup, North, Danforth,
Elizabeth, Fort Pond, and Nashoba Brooks (fig. 1). Flood-
control or mill dams also are common along the major
tributaries, creating reservoirs, lakes, or wetlands and in some
cases affecting main stem flow. Examples include Millham
Reservoir, Fort Meadow Reservoir, Lake Boon, Delaney Pond
and surrounding wetlands, and the wetlands along Cold Harbor
and Hop Brooks (fig. 1). Wetlands along small perennial and
intermittent streams also are common throughout the basin.
Streamflow
Average flow in the Assabet River at the continuous
streamflow-gaging station in Maynard (0109700), with a
drainage area of about two-thirds of the basin (116 mi
2
), is
188 ft
3
/s (table 5). Average streamflow out of the basin is
an estimated 287 ft
3
/s (185 Mgal/d), as determined by the
drainage-area ratio method and flow at the Maynard station.
Average flow at the continuous streamflow-gaging station on
Nashoba Brook (01097300), a major tributary to the Assabet
River, is 20.2 ft
3
/s (table 5). In addition to measurements at
the two continuous streamflow-gaging stations in the basin,
streamflow was measured at 6 partial-record sites on the main
stem Assabet River and at 13 tributary sites at monthly intervals
from May or June 2001 through December 2002 (fig. 6 and
table 6; see Socolow and others, 2003, for measurement data).
Streamflow measurements were made after several days of dry
weather; therefore, they represented nonstorm streamflow.
Nonstorm streamflow in tributaries is defined here as base
flow minus any surface-water withdrawals; in the main stem
Assabet River, it is base flow minus withdrawals plus waste-
water discharges. Nonstorm streamflow excludes direct stream
(stormwater) runoff, which occurs immediately after a precipi-
tation event. Like water levels, streamflows in the basin during
the measurement period were lower than average, as indicated
by flows at streamflow-gaging stations in and near the basin
(fig. 9 and table 5).
For streamflow-gaging stations in the basin, mean annual
and monthly nonstorm streamflow for 1997–2001 was calcu-
lated directly from streamflow records by using the automated
hydrograph-separation method, PART (Rutledge, 1993). For
partial-record study sites, mean annual and monthly streamflow
and nonstorm streamflow for 1997–2001 (Appendix 1) were
estimated by using the MOVE.1 methods described previously
for water levels. The MOVE.1 analysis was done on logarithms
of flow, in the way that the method commonly is applied
to streamflow (Bent, 1995, 1999; Ries and Friesz, 2000).
Instantaneous streamflow at measurement sites was correlated
with same-day mean daily streamflow at up to eight nearby
long-term streamflow-gaging stations (table 5). Long-term
stations were on largely unregulated streams and represent
ranges of drainage areas and percentages of stratified glacial
deposits in drainage areas that were similar to the study sites.
Nonstorm streamflow, or base flow at long-term stations, was
estimated by using PART. The comparison between stream-
flows at largely unregulated, long-term stations and at study
sites assumes that flow components of nonstorm streamflow
other than base flow at the study sites are of negligible quantity,
or at least have insignificant effects on the temporal variation of
flows. For main stem Assabet River sites where wastewater is a
large and variable component of nonstorm streamflow, this
assumption may introduce error, especially during low-flow
months.
Mean annual flows for 1997–2001 at streamflow-gaging
stations were similar to long-term average flows, and much
higher than (about twice) flows in water year 2002 (table 5).
Estimated mean annual nonstorm streamflow was about 70 to
80 percent of total flow at all stations except for the Old Swamp
River station (01105600, 60 percent of total flow), which drains
a small basin with extensive wetlands. Nonstorm streamflow at
the Assabet River station (01097000), which would be expected
to include most of the wastewater discharged to the river in the
basin, was about 80 percent of total flow, one of the highest
percentages of total flow.