Customer loyality rating: A case of Kim Thanh Phat
Bạn đang xem bản rút gọn của tài liệu. Xem và tải ngay bản đầy đủ của tài liệu tại đây (1.68 MB, 76 trang )
<span class="text_page_counter">Trang 1</span><div class="page_container" data-page="1">
<b>DISSERTATION: </b>
<b>CUSTOMER LOYALTY RATING: A CASE OF KIM THANH PHAT </b>
Student’s name: HO LUONG HAI YEN Class: BAM6001
Program: Dissertation Student ID: 2124789
Supervisor: Ron Smith Words: 11.503
Ho Chi Minh City, May 2023
</div><span class="text_page_counter">Trang 2</span><div class="page_container" data-page="2"><b>DECLARATION </b>
I thus declare that the thesis that I am now working on with the topic "Customer loyalty rating: a case of Kim Thanh Phat" is an independent piece of research work that I have accomplished with the assistance of my advisor - Mr. Ron Smith and Ms. Pham Thi Tuyet Trinh. The report contains accurate and trustworthy figures along with all supporting documentation. Academic integrity violations have been explained to me, and I comprehend them. Therefore, I attest that the work contained in this report is my own, and I assume full responsibility for any issues that may arise.
</div><span class="text_page_counter">Trang 3</span><div class="page_container" data-page="3">The purpose of this thesis is to examine the factors that influence customer loyalty. Assess the extent of consumer loyalty at Kim Thanh Phat in the Vietnam market based on this information. Methods: Since the purpose of the thesis is to collect data, analyze, and evaluate variables, a quantitative method including EFA and regression analysis is employed in the thesis. In addition, the thesis will be founded on the data collection survey.
Examine and evaluate which factors affect loyalty as a result. Determine which factors have the greatest impact on consumer loyalty. Finally, provide suggestions and ideas for expanding and maintaining Kim Thanh Phat's customer loyalty.
<b>ACKNOWLEDGEMENT </b>
First, I would like to thank the management of Kim Thanh Phat Limited Liability Company for giving me the opportunity to gain real-world experience here. As a result, I was able to receive training and gain valuable experience, thereby expanding my knowledge base at the company. In addition, the company assisted me in sending 240 surveys to Kim Thanh Phat customers. I would like to thank everyone in customer service and consulting who assisted me during my investigation. Everyone in the organization took time out of their busy schedules to assist, guide, and support my research on customer loyalty at the company.
</div><span class="text_page_counter">Trang 4</span><div class="page_container" data-page="4">Mr. Ron Smith and Ms. Pham Thi Tuyet Trinh, as well as Mr. David Ratcliffe, the campus manager, deserve my sincere appreciation. Because they took the time to guide and assist me greatly during the research paper analysis process.
Finally, I am grateful to the University of Bolton for the chance to study, work, and research at the enterprise. This thesis research paper helped me learn and recognize my flaws.
My report could contain errors or omissions due to time and knowledge constraints. I anticipate obtaining the instruction and input of the instructors so that I can continue to develop.
<b> Author </b>
<i>(Signature, print name) </i>
</div><span class="text_page_counter">Trang 5</span><div class="page_container" data-page="5"><b>Chapter 2/ LITERATURE REVIEW ... 4 </b>
2.1. Definition of customer loyalty... 4
</div><span class="text_page_counter">Trang 6</span><div class="page_container" data-page="6"><b>Chapter 4/ FINDING ANALYSIS ... 22 </b>
4.1. Statistical research (Demographic) ... 23
4.2. Limitation of the Study ... 41
4.3. Exploratory Factor Analysis (EFA) ... 26
5.1. Analysis of the Most Significant Findings ... 41
5.2. The overall results and their implications ... 42
5.3 Recommendations ... 42
</div><span class="text_page_counter">Trang 7</span><div class="page_container" data-page="7">5.4. Implications for the direction of future research ... 44
<b>Appendix </b>
</div><span class="text_page_counter">Trang 8</span><div class="page_container" data-page="8"><b>List of Table </b>
Table 1/ Check the reliability of the scale ... 22
Table 2/Customer's Gender ... 23
Table 3/Customer’s Age ... 25
Table 4/How many times have you used our products ? ... 25
Table 5/Table of KMO and Bartlett's Test ... 26
Table 6/Communalities ... 27
Table 7/Total Variance Explained ... 28
Table 8/Rotated Component Matrix ... 29
Table 9/Table of KMO and Bartlett's Test ... 30
Table 10/Communalities of dependent variable ... 30
Table 11/Total Variance Explained ... 31
</div><span class="text_page_counter">Trang 9</span><div class="page_container" data-page="9"><b> List of Figures </b>
Figure 1/Conceptual Model and Hypotheses ... 7
Figure 2/Four factors affect of customer loyalty ... 9
Figure 3/ The Research Onion Framework ... 12
Figure 5/ Image of histogram graph ... 35
Figure 6/Normal P-P Plot of Regression Standardized Residual ... 37
</div><span class="text_page_counter">Trang 10</span><div class="page_container" data-page="10"><b>Chapter 1/ INTRODUCTION </b>
1.1. Background of the Study
The globalization of competition, the saturation of markets, and improvements in information technology have all led to an increase in consumer awareness and heightened the degree of competitiveness that exists among enterprises that engage in worldwide commercial marketplaces. This has resulted in an increase in the number of firms competing with one another. The level of demand now is far more than it was in the past. An organization's profitability, market position, growth, and long-term survival depend on its ability to attract and retain consumers. Without clients, an organization cannot be productive (Borishade, Ogunnaike, Kehinde, and Aka 2022). In order for organizations to have more competitive advantages in the market, their marketing strategy has to move from the conventional way such old method to a more current method of relationship marketing, as stated by Guillén (2019). One of these approaches is one that places an emphasis on maintaining loyal customers. In the current global corporate world, many organizations recognize the importance of client loyalty as a component of their marketing strategies (Duffy, 1998). As can be observed, the majority of firms in the modern world are either investigating, assessing, or putting into action various loyalty programs and initiatives in order to cultivate robust ties with their clientele. In the current climate of the market, maintaining a loyal customer base is of utmost importance for businesses. Customers are an organization's most valuable resource, and businesses can only generate further value from those consumers if they show genuine concern for those customers (Hughes, 2008). According to Roberts-Lombard and Tait research from (2018), one of the advantages of knowing customer loyalty is that it results in a connection that is both more robust and established between the firm and the consumer. Creating deep relationships with one's clientele is one of the most financially advantageous things a business can do since it enables the organization to get access to resources that cannot be bought or sold. Second, it makes it possible for businesses to collect more relevant information about their consumers. These include things like marketing and operational expenses, amongst others. Second, consumers have the ability to function as part-time workers by providing
</div><span class="text_page_counter">Trang 11</span><div class="page_container" data-page="11">information to their own circle of friends and family members. With that vantage point, organizations have the ability to grow into more client groups and classes.
1.2. Overview
This research focuses either on the theoretical development of tools or approaches to measure customer loyalty or on ways to experimentally establish the link between customer loyalty and key drivers or related factors. Earlier customer loyalty researchers had a tendency to concentrate on various sorts of definitions and in the context of customer attitudes and behaviors or their phases within a continuum or follow-up. level or extent, albeit not in the particular context of life cycle stages or continuums (Dierks and Christoph Burmann, 2017). In addition to describing the strategic benefits of a transforming organization, some researchers suggest that customer loyalty possesses customer lifetime-type characteristics such as lifetime value (Lee, 2018). This is in addition to the fact that customer loyalty can bring customer loyalty to the optimal level and the method of returning to a more favorable equilibrium (Oly Ndubisi, 2006). According to the findings of earlier studies, the idea of customer loyalty seems to have a number of parallels with the various phases of the product life cycle. Irma's book from 2015 provides a definition of the word as a strategy in which the management of interactions, connections, and networks is an essential component. In a similar vein, Butscher (2016) proposes that the objective of the corporation is to cultivate and sustain a mutually beneficial, long-term connection with its clientele in order to maximize profits for the business as a whole. To put it another way, the primary objective is to increase the level of client loyalty. According to the description presented above, client loyalty may be broken down into two categories: attitudes and behaviors. These two facets are intertwined in a very tight way. Attitudinal loyalty is often described as both a positive influence on relationship continuity as well as a desire to maintain the connection, while behavioral loyalty is characterized by repeated transactions. Behavioral loyalty may be shown via repeat business. In addition to this, consumer loyalty may be broken down into two distinct categories: passive loyalty and active loyalty (Ball, et al., 2004). When a consumer is actively devoted to your business, they are willing to try out new things, even paying more for your offerings. They tell their friends and family about your product and promote it to others. They have a positive perception of themselves and their
</div><span class="text_page_counter">Trang 12</span><div class="page_container" data-page="12">reputation as a result of identifying themselves with your business. They have faith in your honesty and in the work you are doing. In contrast, the concept of passive loyalty refers to clients who remain faithful to their favored brands and services regardless of whether or not the market circumstances have improved (Maria Pilar Martinez-Ruiz, et al, 2021). According to a different viewpoint presented by Leverin and Liljander (2006), in some circumstances, a person's loyal mentality may not necessarily be reflected in their loyal actions.
1.4. Objectives of the Study
Kim Thanh Phat Business has to determine the loyalty of its customers.
Do research to determine the extent to which various types of customers are loyal to a brand based on demographic factors.
An examination of the elements that influence the loyalty of Kim Thanh Phat Enterprise's customers.
Provide suggestions on how we might further increase the effectiveness of our efforts to foster client loyalty.
</div><span class="text_page_counter">Trang 13</span><div class="page_container" data-page="13">The information obtained from the customer loyalty survey and the interview with the customer care department at Kim Thanh Phat will be analyzed in this thesis using the quantitative approach including the EFA model and the regression model. Both of these models will be used in conjunction with one another. The SPSS will then be used to aggregate the results of the survey from approximately two-hundred people. These findings will be compared with the theory in order to determine the level of customer loyalty and potential solutions to improve customer loyalty and efficiency in fostering brand loyalty in customers. The conclusion of the thesis will be presented as the last part of this essay.
1.5. Research structure
The paper contains five chapters, each of which serves a distinct purpose. Chapter 1 functions as the report's introduction, outlining its primary purpose and objectives. This chapter also provides a summary of the research conducted and the methodology utilized. In Chapter 2, the literature review, the report describes the preceding research conducted to support the study's findings. In Chapter 3, the Research Method, the methodology used to conduct the study, including data acquisition and analysis, is described. The findings of the research are presented in Chapter 4 along with a thorough analysis of the results. Chapter 5, the conclusion, provides a summary of the report's key findings and recommendations for future research. Collectively, these chapters provide a comprehensive comprehension of the conducted research and the resulting findings.
<b>Chapter 2/ LITERATURE REVIEW </b>
2.1. Definition of customer loyalty
As was just indicated, the idea of a loyal consumer base didn't come into existence until the 1980s. According to Bhote (1996), "Customer Loyalty" refers to a continuing emotional connection that exists between you and your consumers. This relationship is shown in the form of a desire to engage with and purchase from you several times utilizing the products that you sell them in comparison to those of your rivals. Being your greatest proponents, sending people to you, and providing proactive (and reactive) good comments are all great ways to boost your business. The great experiences that a consumer has had with you may help to create trust,
</div><span class="text_page_counter">Trang 14</span><div class="page_container" data-page="14">which in turn can lead to loyalty from that customer. According to another paper published by Sachs (2013), customer loyalty is defined as the consumers' propensity to return to the organization on several occasions in order to do business. In most cases, this is because of the fascinating and unforgettable interactions they've had with that particular brand. Loyalty from customers occurs when they continue to purchase from a certain firm over an extended period of time. Customers that are loyal to a certain brand will always prefer to do business with that brand and will often protect that brand against other options. To build client loyalty, you need to first cultivate a customer base that is so committed to your company and its products that they are ready to purchase everything you sell, no matter the cost, even if there are other options available that are more affordable available for purchase. Customers who are happy with your goods and services and who are loyal to your company are more likely to become advocates for your brand, which means they will continue to support you even when things get tough.
One of the most valuable aspects of a brand is its loyal customer base. It signifies that the repeated purchase of a brand is founded on a strong inherent bias; to put it another way, the behavior of repeat purchasing stems from a liking for the brand in question. Customers that are emotionally connected and devoted to a brand are considered to be loyal to that brand, and as a result, they continue to purchase products from that brand over and over again. These are the consumers who are most resistant to being persuaded by the offerings of competitors, they are willing to pay a premium for the brand to which they are loyal. Gaining and keeping loyal clients is essential for success in today's industry (Yagüe and Rubio, 2019). According to Van Ruyter and Cox (2022), this research outlines two primary categories for assessing client loyalty: Attitude and Behavior, either real or intended, include transactional evaluations such as use intensity, purchase rate, buy frequency, purchase sequence, usage/retention rate, and RFM (Recent Hits, Frequency and Currency Value).
2.2. Research of study
The first reference study titled "Customer Satisfaction and Customer Loyalty" was done by Khadka and Maharjan (2017). The second reference study is titled "Customer Loyalty in Business" by Ranabhat (2018). These two essays, although the research objectives and research
</div><span class="text_page_counter">Trang 15</span><div class="page_container" data-page="15">process are not really the same as the research objectives of this paper, however, both have different advantages and disadvantages, helping the researcher to refer to and discuss support used in this study.
2.3. Research framework
According to research conducted by Moorman and colleagues (1993), trust can be defined as "the desire to depend on an exchange partner that the person trusts." According to Morgan and Hunt (1994), winning the trust of consumers is one of the most important things that can be done. Mosavi and Ghaedi (2012), discovered a clear link between customer trust and loyalty in their research. In service marketing, trust refers to customers' belief that a service provider will provide a product or experience that meets all of their requirements (Nastasoiu & Vandenbosch, 2019). When one party feels confident in the other's honesty and trustworthiness as a partner, this is an example of trust. Consumers are guided before, during after using the service by trust, which is an important intervention component that affects loyalty and strengthens the relationship between the consumer and the company (according to Singh & Sirdeshmukh, 2000). In some types of partnerships, trust is a unique mental state, comparable to loyalty (Bi, 2019). According to Bhote (1996), "Customer loyalty" refers to a continuing emotional connection that exists between you and your consumers. This relationship is shown in the form of a desire to engage with and purchase from you several times utilizing the products that you sell them in comparison to those of your rivals. Being your greatest proponents, sending people to you, and providing proactive (and reactive) good comments are all great ways to boost your business. The great experiences that a consumer has had with you may help to create trust, which in turn can lead to loyalty from that customer. According to another paper published by Sachs (2013), customer loyalty is defined as the consumers' propensity to return to the organization on several occasions in order to do business. In most cases, this is because of the fascinating and unforgettable interactions they've had with that particular brand. Loyalty from customers occurs when they continue to purchase from a certain firm over an extended period of time. Customers that are loyal to a certain brand will always prefer to do business with that brand and will often protect that brand against other options. To build client loyalty, you need to first cultivate a customer base that is so committed
</div><span class="text_page_counter">Trang 16</span><div class="page_container" data-page="16">to your company and its products that they are ready to purchase everything you sell, no matter the cost, even if there are other options available that are more affordable available for purchase. Customers who are happy with your goods and services and who are loyal to your company are more likely to become advocates for your brand, which means they will continue to support you even when things get tough. Therefore, organizations need to have a multi-faceted strategy to deal with each individual consumer. By understanding the factors that contribute to customer loyalty, organizations can save costs and increase profits. For example, the company can cut advertising-related costs to attract new customers, the cost of trying to personally sell to new leads, the cost of setting up a new account, and the cost of consulting and explaining to new customers. According to Hill and Alexander (2000), some firms with smaller market shares have higher profit margins than those with larger market shares. The rationale for this is that they believe that maintaining a loyal customer base is more profitable than increasing their market share. First, regular business from existing customers is a strong indicator of a company's future revenue. An initial transaction or two from a new customer can be considered risky, especially for smaller businesses with less established brands. As a result, they can control their spending and gradually increase as their relationship grows.
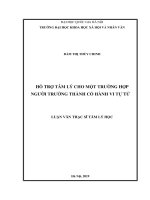
Figure 1/Conceptual Model and Hypotheses
</div><span class="text_page_counter">Trang 17</span><div class="page_container" data-page="17"><i><small>Source: Four-Phase Loyalty Model: Moderator Effects Analysis (Heiner Evanschitzky and Maren Wunderlich, 2016) </small></i>
Figure 1 depicts how customer loyalty is a process in the same sense that other processes are. According to a model of customer loyalty, characteristics that build customer loyalty include having an awareness of the client's requirements and preferences. In order for the firm to earn the loyalty of its customers, it must pay attention to the pricing, the promotion, the service, and the goods. At the same time, it is very important to cultivate an atmosphere of ease between the organization and the consumer. Investing cash into consumers who remain faithful to a company may result in positive outcomes for that company, like increased productivity and profits.
</div><span class="text_page_counter">Trang 18</span><div class="page_container" data-page="18">2.4. Determinants of customer loyalty
Figure 2/Four factors affect of customer loyalty
<i><small>Source: author </small></i>
2.4.1. Customer Satisfaction
Relationship marketing places a strong emphasis on ensuring both the happiness of the consumer as well as their continued patronage of the business. In modern marketing, ensuring the happiness of one's customers is an essential part of maintaining long-term relationships with those customers. Loyal customers boost the company's value and efficiency. Thus, managers' perspectives are shaped by customer satisfaction and loyalty (Wendy Gao and Lai, 2015). The decade of the 1980s saw an increase in the use of customer satisfaction ratings collected from surveys as a tool by businesses to monitor performance, determine staff compensation, and distribute scarce resources. However, throughout the 1990s, businesses started to become more worried about the financial ramifications of the efforts they were making to enhance the level of pleasure of their customers. The notion held by management that better levels of customer happiness would boost retention rates, drive consumption, and enable enterprises to charge higher service costs is at the heart of the financial argument for
<small>Customer Loyalty Customer Satisfaction </small>
<small>Trust </small>
<small>Reputation Service </small>
<small>Quality </small>
</div><span class="text_page_counter">Trang 19</span><div class="page_container" data-page="19">customer satisfaction. Regrettably, this notion has not been completely proved to be supported by the data to far (Stock and Zacharias, 2013). It has been established that making consumers happy increases customer loyalty and the likelihood that they would repurchase a product or service even if it does not ensure that the customer will remain a client. Nevertheless, the retention of customers is also dependent on a variety of other criteria, including choice, convenience, price and income, loyalty programs, and... (Pont and McQuilken, 2005).
2.4.2. Trust
The definition of trust is the disposition to place confidence in a transaction partner who is already trusted. The trust may also be described as the conviction that one's partner's word or promise can be relied upon and that the other party will live up to their commitments within the context of the relationship. (Leninkumar, 2017). There are also a few alternative definitions of trust, such as the notion that consumer trust is contingent on a company's capacity to capitalize on the value of the human experience and cultivate an emotional connection with customers via the act of expressing themselves. Show sensitivity, openness, honesty, and trustworthiness in your interactions with others. According to Martinez and Rodrguez del Bosque (2013), 83 percent of customers have said that they would not do business with businesses that they do not trust. It is vital to place primary emphasis on the development of services, the promotion of authenticity and transparency, the listening to customer thoughts and feedback, the investment in staff, and the connection of consumers in order to be able to establish customer trust (Fred, 2023).
2.4.3. Service Quality
Due to the fact that it is difficult to measure and describe service quality, it has drawn a great deal of interest from researchers and academics. Quality of service is an essential component of competitiveness (Naini et al, 2022). According to Ladhari's research from (2008), a firm that is having trouble setting itself apart from its other businesses should prioritize the quality of the services that it provides. Parasuraman et al (in 1986), created a gap analysis model to quantify the effect of service quality based on an integrated perspective of the connection between customers and businesses. This model was intended to measure the quality of the interaction between customers and businesses. This model outlines five broad aspects of service quality,
</div><span class="text_page_counter">Trang 20</span><div class="page_container" data-page="20">which are referred to as tangibles, dependability, responsiveness, assurance, and empathy respectively.
2.4.4. Reputation
Reputation is the assessment of how a thing or any person is usually regarded, as a name or good position, or in the manner that a specific person or thing is recognized, as stated by Islam et al (2020). Reputation is widely believed to be the evaluation in which a thing or any person is commonly held. A solution to the issue of experiencing products and services might be found in a company's reputation. As there are various subfields of study in academic research, there are also many different approaches to evaluating the reputation of an organization. There are a variety of rating scales that are determined by measurements (Gul, 2014). A company's reputation may also be defined as the beliefs of its stakeholders about the organization's capacity to produce value within the industry in comparison to its rivals. The reputation of the company is ultimately comprised of how it is seen by its many stakeholder groups inside the organization. This perception is contingent not only on the individuals who work for the firm but also on those who interact with the company in the outside world (Khan, Salamzadeh and Yang, 2020).
2.5. Research models
Based on the factors affecting customer loyalty for businesses, the following hypotheses are systematized, synthesized and developed to fit the theme and overall retail service industry in Vietnam. The proposed hypotheses will be based on theory and research on customer loyalty at different retail businesses at home and abroad.
Hypothesis for the study:
Hypothesis 1: Customer satisfaction helps develop and build a loyal customer system at Kim Thanh Phat.
Hypothesis 2: Customer trust positively affects the number of purchases / frequency of customers' purchases, showing customer loyalty at Kim Thanh Phat.
Hypothesis 3: Service quality at Kim Thanh Phat positively affects customer satisfaction, thereby building customer loyalty.
</div><span class="text_page_counter">Trang 21</span><div class="page_container" data-page="21">Hypothesis 4: Kim Thanh Phat's reputation positively affects customer loyalty and purchase choice.
<b>Chapter 3/ RESEARCH METHOD </b>
3.1. Introduction
In this part of the report, go through the research methodologies that were used, as well as the decisions that were taken to make the study goals more understandable. The researcher will first establish a study topic, and then discover and choose relevant components that influence that problem. According to Arthur Middleton Hughes (2004), the report highlights pertinent concepts, research difficulties, and the status quo. In addition, the point of view of the researcher is a key factor that influences research methods. It is critical for businesses to assess the loyalty of their consumers in order to comprehend the perspectives and ideas held by those clients and, as a result, establish objectives and priorities for the purpose of producing enhancements. Quantitative is one way that may be used to the task of measuring the loyalty of customers. In the work of Kumar and Shah (2004), the term "quantitative" refers to a method of evaluating customer loyalty that makes use of model analysis in conjunction with numerical data. This article will research the quantitative principle, and then the researcher will use this approach, together with the data acquired from the survey, to examine the elements that directly impact customer loyalty. In addition, the researcher will look at the correlations between the variables. The degree of client loyalty to Kim Thanh Phat's company will be evaluated in the research paper once the relevant elements have been analyzed and taken into consideration. In conclusion, steps will be done to strengthen consumer loyalty while preserving existing relationships. This paper uses the Onion Framework model for more in-depth research and analysis.
Figure 3/ The Research Onion Framework
</div><span class="text_page_counter">Trang 22</span><div class="page_container" data-page="22"><i><small>Source: Methodologies of Research for Students of Business Saunders, Lewis and Thornhill (2019) </small></i>
3.2. Research Philosophy
The research philosophy behind the integrated research strategies, techniques, and assumptions is an essential component of this integration. According to Saunders et al (2019), it gives the researcher a perspective of the topic they are studying, as well as the practical information linked to the research problem that may be gained via the research technique that has been created. In this investigation, our primary emphasis will be on an examination of three distinct approaches to philosophical inquiry: positivism, interpretivism, and kritisch realism. The research process, the underlying assumptions, and how one goes about solving the issue are all impacted differently by the various methods. As the figure below shows more clearly the research philosophy of Saunders et al (2019).
3.2.1. Positivism
According to research by Johannes Feichtinger et al (2019), positivism is a philosophical view based on the idea that the world is objective and can be studied through observable and measurable phenomena. Positivists believe that there is a single reality that can be understood through scientific methods and that this fact is independent of human consciousness. This perspective is often associated with the natural sciences, where researchers use quantitative
</div><span class="text_page_counter">Trang 23</span><div class="page_container" data-page="23">data and statistical analysis to study natural phenomena. According to positivists, research should be conducted in a systematic and objective manner. This means that researchers should use standardized methods for data collection and should not be biased or have personal opinions (Halfpenny, 2014).
3.2.2. Interpretivism
Interpretivism is a research approach that focuses on the subjective interpretations and meanings that people attach to social phenomena. One of the strengths of the interpretive approach is its emphasis on context and subjectivity. This approach contrasts with positivism, which assumes that social phenomena can be studied objectively through empirical observation and measurement (Sherry and Fischer, 2008). The interpretive approach can be traced back to the work of German philosopher, Wilhelm Dilthey, who argued that human behavior can not be studied in the same way as natural science. Dilthey believed that human behavior is shaped by cultural and historical context and that researchers should focus on understanding people's subjective experiences and interpretations of the world. This approach was later developed by other scholars, such as Max Weber and Alfred Schutz, who emphasized the importance of understanding the meaning behind human actions (Aaker and Moorman, 2018). Interpretivism is often used in qualitative research, such as interviews, focus groups, and ethnographic studies. These methods allow researchers to gain insights into people's attitudes, beliefs, and experiences, and to understand the social and cultural context in which they exist (Lynch, 1995). Interpretivist researchers often use open-ended questions and allow participants to provide detailed responses in their own words. They also pay close attention to nonverbal cues and the ways in which participants interact with each other (Williams, 2020).
3.2.3. Realism
Realism is characterized by a focus on the everyday lives of ordinary people and a rejection of romanticized and idealized portrayals of life. According to Khairawati (2019), realist writers and artists were interested in portraying the world as it truly existed, regardless of its faults and imperfections. Besides, Mattila (2001), also said that realism began as a reaction to the excesses of romanticism, which emphasized emotion, imagination, and idealism over reason and reality. It was characterized by a number of key themes and features. Realism also
</div><span class="text_page_counter">Trang 24</span><div class="page_container" data-page="24">emphasized the importance of accurate and objective observation, with writers and artists striving to depict the world as it really was, rather than as they wished it to be (Zikmund et al, 2013). The researcher selected and applied a comprehensive Positivism analysis to this research paper.
3.3. Research approach
In surveys, the deductive method and the inductive method are the two most common forms of research methods. Both approaches have their own particularities, strengths and weaknesses and can be used in different fields of research (St, 2015). This study chooses deductive approach to test the hypothesis.
3.3.1. Deductive approach
According to research by Aksel Tjora (2018), the deductive method is a method commonly used in research and reasoning to draw logical conclusions based on general principles or theories. In this method, researchers start with a general hypothesis and then make specific predictions based on that hypothesis. Deductive reasoning is commonly used in scientific research, but it can also be applied in many other fields, including mathematics, philosophy, and law. Deductive methods begin with a set of general principles, known as premises. These premises are then used to develop a hypothesis about a particular phenomenon. Researchers are given the opportunity to put their hypotheses to the test in an organized and managed fashion when they use a deductive approach, which is one of the method's primary advantages. This makes it easier to identify and control for potential confounders, which increases the reliability of the results (Vanover, Mihas and SaldañaJ, 2022).
3.3.2. Inductive approach
The inductive method involves collecting data without any preconceived ideas or theories, and then drawing conclusions based on observed patterns and trends in the data. This approach is useful when the researcher is exploring a new area of research and there are no theories or hypotheses available to guide the research (Sheppard, 2020). In addition to Sirisilla (2023), asserts that since the researcher begins with particular observations before developing a broad theory or hypothesis, the inductive technique is sometimes referred to as the bottom-up approach. Inductive method is a popular method in research, especially in quantitative
</div><span class="text_page_counter">Trang 25</span><div class="page_container" data-page="25">research. The researcher will collect data through interviews, observations or surveys and analyze it to develop a theory or hypothesis. This approach is useful for exploring new topics, understanding complex phenomena, or developing new ideas (Dudovskiy, 2011). The inductive technique has two benefits: it enables the researcher to investigate previously unstudied subjects or sectors and it fosters more flexibility and openness. The inductive technique may be time- and resource-intensive, which is one of its drawbacks. To establish a theory or hypothesis, the researcher must gather a sizable quantity of data (Goddard and Melville, 2014).
3.4. Quantification
Quantification refers to the practice of gauging the loyalty of customers via the use of numerical data. Collecting data from a wide range of sources, interpreting that data, and presenting the conclusions in a quantitative way are all required steps in this process. According to Rokes (2002), the purpose of quantification is to provide an evaluation that is transparent, objective, and quantifiable of customer loyalty. Quantitative information may be gathered via a number of methods, including polls, customer comments, past purchase records, and even analytics performed on social media platforms. After data has been gathered, it may be evaluated to look for patterns, trends, and places where there is room for improvement. After doing the study, one may utilize the findings to design strategies with the goal of increasing the amount of client loyalty (Morey, 2015). According to Streeterk (2023), quantitative research has the potential to result in research bias, which may take the form of information bias, omitted variable bias, sample bias, or selection bias, however, the error rate is not significant.
3.5. Research strategy
Building client loyalty is a difficult undertaking in today's cutthroat corporate climate. Research often uses qualitative and quantitative methods. These strategies are formed on the basis of research goals in order to explain the research issue (Brannen, 2017). However, the primary emphasis of this investigation is on the use and examination of in-depth quantitative methodologies, with the surveys of around 240 consumers serving as the data source. According to Peppers and Rogers (2016), the first stage in the process of building a customer loyalty research strategy is to identify the consumer segments that are most likely to remain loyal to the brand. For instance, companies could wish to focus their marketing efforts on
</div><span class="text_page_counter">Trang 26</span><div class="page_container" data-page="26">retaining long-term customers or appealing to consumers who make repeated purchases. This strategy may assist businesses in determining the requirements and preferences of their most devoted clients and in developing customer loyalty programs that are specifically designed to meet those requirements. After determining their target audience, firms are obligated to gather information on customer loyalty via the use of surveys and focus groups. Businesses may acquire quantifiable data on customer happiness, loyalty, and desire to suggest a product or service to others by asking customers to complete surveys. On the other hand, focus groups provide customers with a forum in which they may share their thoughts and comments in a way that is both more specific and all-encompassing (Mascarenhas et al, 2006). The results of polls and discussions with certain groups of people are useful in formulating efficient customer loyalty programs. The individual requirements of each client group should be taken into consideration when developing loyalty programs. According to Nazimudeen Saleem's research (2019), repeat consumers are more likely to value a points-based system that awards them benefits for their continued patronage, whereas one-time purchasers are more likely to value tailored discounts or special offers. Analysis of customer comments and grievances is another productive method for researching client loyalty that may be used. According to Keeling, Ruyter, and Cox (2022), this strategy may assist companies in determining which aspects of their operations need correction and enhancement.
3.6. Research methodlogies
Researchers need to use the appropriate research models and procedures to conduct a successful study. Primary data and secondary data are now the two most common types of data acquisition. Both of the aforementioned techniques of data collecting will be used by a researcher if they want their research paper to be as impartial and accurate as feasible. In order to effectively serve the study goal, it cannot be disputed that each data-gathering technique will represent a distinct facet of the study in order to fulfill the research aim in the most effective manner. To undertake an analysis of the data acquired from the survey, the study will only focus on primary data.
3.6.1. Primary data
</div><span class="text_page_counter">Trang 27</span><div class="page_container" data-page="27">Surveys, interviews, experiments, and observations acquire primary data. This data was obtained to answer research questions and may illuminate the issue. Primary data is personalized to the study issue, a major benefit. Researchers may create surveys, questionnaires, and interviews to acquire data related to their study issue (Sinha et al, 2021). Direct data collection gives researchers better control over data quality and accuracy. The researcher can gather data consistently and methodically (Rose et al, 2019). Primary data may also be tailored to the researcher. The researcher may pick the best data-gathering strategy depending on the study issue and target population. If the target population is large, a survey may be the most convenient and cost-effective data-gathering option. Interviews or observations may be better if the study issue demands specific information on a small group (based on Jones, 2010). Primary data collecting is costly and time-consuming. If the target population is hard to contact or the research topic demands a big sample, this might be problematic (Wagh, 2022).
3.6.2. Secondary data
It can be defined as data that is gathered from various sources such as books, journals, reports, websites, or any other source which has already been published. Unlike primary data, which is collected directly from the source, secondary data is already available and does not require any new research to be conducted (Riedel, 2000). Secondary data has several advantages over primary data. Firstly, it saves time and resources since the data is already collected and available. Secondly, secondary data is often more reliable and accurate than primary data. Thirdly, secondary data can provide a broader perspective on a topic (Watkins, 2022). However, there are also some disadvantages to using secondary data. It may not always be relevant to the research question being investigated and it may be outdated (Macinnes, 2017). As can be seen, the study will choose primary data because the study only uses the survey table to make statistics and relies on the data to run the results and analysis.
3.7. Data collection technique
A survey is a research technique that is used to gather data on people's attitudes, behaviors, views, and experiences (Bhat, 2018). Numerous disciplines, including the social sciences, market research, psychology, and health studies, employ this instrument. Questionnaires are
</div><span class="text_page_counter">Trang 28</span><div class="page_container" data-page="28">designed to be user-friendly, and they can collect data from a large number of individuals, making them an effective method to collect data (Mohamad Adam Bujang et al, 2022). Utilizing questionnaires has numerous benefits. They are simple to administer and can be completed at an individual's own pace. Questionnaires can be distributed to a large number of individuals, even in various locations, and can be completed quickly. This makes them a time- and cost-effective method of data collection (Humble, 2020). Second, questionnaires can be readily standardized, which ensures that all respondents receive the same questions and answer options, resulting in consistent and comparable data collection. It is simpler to perform data analysis and derive meaningful conclusions. Finally, it permits anonymity and privacy. Respondents can respond truthfully without fear of judgment (Kindley, 2016). However, the use of questionnaires also has some limitations. Respondents may not completely comprehend the inquiries, resulting in inaccurate or insufficient responses. This can be remedied by pre-testing the questionnaire with a small sample of individuals to identify any areas of ambiguity (Beatty, 2019).
Assessing the level of consumer loyalty for retail services at Kim Thanh Phat limited liability company is the topic of this paper. The questionnaire was devised and designed in such a way as to cover all important aspects of customer loyalty, including product quality, customer service, price, and convenience (Bradburn et al, 2004). Customers can communicate their agreement or disagreement with Kim Thanh Phat's retail services via these inquiries. To facilitate data collection, the questionnaire is designed in both English and Vietnamese with similar content. In order to obtain unbiased responses from consumers, 240 questionnaires were compared and sent directly to middle-aged and middle-class individuals. The researcher then synthesizes and statistically analyzes the responses. Before disseminating the survey questionnaire, a pilot test was conducted to assess the clarity of the questions (Saris and Gallhofer, 2014). This pilot test can aid researchers in overcoming content-related difficulties in survey and data collection (Presser, 2004). The pilot study lasted seven days and 200 responses were received.
In addition, participants were asked for suggestions on how to enhance the questionnaire. There were a few trivial errors that needed to be addressed, but the majority of the queries
</div><span class="text_page_counter">Trang 29</span><div class="page_container" data-page="29">reviewed were plain and straightforward. The survey was administered between April 20 and April 27, 2023. Each survey will be sent directly to customers who have purchased and used Kim Thanh Phat products. The content will be more detailed in Appendix 1.
3.8. Time horizon
According to Payne and Payne (2004), there are two different kinds of research: cross-sectional studies and longitudinal studies. Both of these types of studies take into account time. On the other hand, the cross-sectional analytic approach is going to be used for the article since it is appropriate for the research. According to Thomas (2020), a cross-sectional study is one in which the data is only gathered once and corresponds to a certain moment in time. In addition, a cross-sectional study is a kind of research design that involves gathering data from a large number of diverse people all at the same time. A cross-sectional study is one in which the variables being studied are only observed without any changes being made to them (Setia, 2016). In addition, a cross-sectional study is a kind of research design that involves the simultaneous collection of data from a number of different people by the researchers. Because of this, cross-sectional studies often use a survey methodology. Cherry (2019) claims that this approach may be used to define the frequency of events as well as explain relationships between different components in diverse organizations. Specifically, this study aims to look at the relationship between factors that affect job satisfaction and that satisfaction (T. Dalenius, 1982).
3.9. Ethics
Ethics is a branch of philosophy that deals with moral principles and human values. It is concerned with what is right and wrong, good and bad, and ethical and unethical behavior. Ethics plays an important role in actions and helps to make responsible. Ultimately, ethics is about doing what is right and acting with integrity, even in the face of difficult choices and challenges. Appendix 2 will contain specific ethics-related contents.
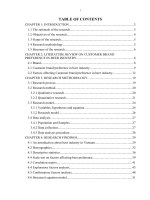
Figure 3/Cronbach's Alpha
</div><span class="text_page_counter">Trang 30</span><div class="page_container" data-page="30"><i><small>Source: A Straightforward Explanation of Its Definition, Application, and Interpretation. (Glen, 2023) </small></i>
Cronbach's alpha assesses the level of concordance on a scale from 0 to 1. Due to their compatibility, the results between 0.6 and 0.7 are deemed adequate when filtering the data index variables. To increase the likelihood that all data variables should be from 0.7 or above. According to George and Mallery's (2019) research, outcomes with a greater variable value will be more valuable to the company. According to Table 1, which was taken from SPSS, it demonstrates that 200 data of all 4 Factors are appropriate and have been thoroughly screened, and that all data are more than 0.6.
</div><span class="text_page_counter">Trang 31</span><div class="page_container" data-page="31">Table 1/ Check the reliability of the scale
<i><small>Source: Author </small></i>
<b>Chapter 4/ FINDING ANALYSIS </b>
In the next part of the article, processes for quantitative data analysis and evaluation will be used in order to test and build the scale, construct the survey sample, and assess the measurement of the data variables. The creation of measurement scales for each of the model's structures is accomplished by working through a set of procedures in sequential order. 4.1. Reliability Statistics
According to K. Muralidharan's research (2012), if the level of confidence in the relationship found via analysis is high, then the scale will provide consistent and hence dependable findings. In addition, Zacks (2012), asserts that reproducibility or reliability in statistics relates to
</div><span class="text_page_counter">Trang 32</span><div class="page_container" data-page="32">consistency in measurement, which is the capacity to get the same result for two states that are identical or in an active way. the similarity between the original estimates and later estimations, which is a more dynamic concept. The reliability of statistics and statistical indicators is an essential prerequisite for them to properly measure the reality that they are supposed to reflect. However, dependability alone is not sufficient. In order for the data, statistical data, to describe multiple scales, the items (factors) must be met between the parties in order for the reliability to be decided between different raters. This is necessary so that the data may describe different scales. Case count, item count, and confidence estimate are all included in the statistics that are presented by default.
Cronbach's alpha models are one of the most frequently employed methods, and the researcher employed them in this investigation. Analysts routinely utilize Cronbach's alpha as one of their go-to tools when planning and developing a new survey or assessment instrument. Before the tool is fully implemented, this statistic could be used to evaluate the quality of the tool during the design phase. According to Bonett and Wright (2014), it is a reliability measurement. Cronbach's alpha evaluates a group's internal consistency or interconnectedness. According to Jablonski (2019), it is a metric that can be used to assess the scale's dependability. Cronbach's alpha coefficient, as explained by Keengwe (2016), may be used to assess the trustworthiness of a questionnaire. You may use this metric to examine a set of things to see whether they all have the same quality.
4.2. Statistical research (Demographic)
Quantitative data, as opposed to numerical data, indicates the grade of the data elements. It is used to identify information, and it can be further subdivided into subcategories using four distinct metrics. The scale is used to classify and define the variables. Stanley Stevens, a psychologist, developed four commonly employed scales: nominal, ordinal, interval, and proportional. The appropriate method of data analysis depends on the characteristics of each instrument. According to the research of Kellstedt et al. (2022), the evaluative criteria include identity, measure, length equality, and a minimum value of zero. According to the study report, approximately 200 pieces of data are used to calculate samples based on customer evaluations of the firm's service, product quality, consumer comfort, and product value. These evaluations
</div><span class="text_page_counter">Trang 33</span><div class="page_container" data-page="33">are used to inform the business decisions of the company. After that, we conduct the scale analysis using the SPSS application. Customers older than 18 years old, particularly those with an average age between 26 and 45 years old, will be the focus of the survey, which will comprise of twenty questions related to measuring customer satisfaction and loyalty. On a 1 to 5 scale, respondents indicated their level of agreement with each survey question. This rating system is referred to as the Likert scale, after the social scientist who was responsible for its development (Hayes, 2008). The department of statistics requested 240 responses from consumers and received approximately 200 (a response rate of approximately 90%). If the company receives a high response rate from its loyal customers, it will be able to obtain useful information that will aid in the evaluation of its loyal customers. Scale Analyze returns a value greater than 0.6, indicating that the data is appropriate and usable; this is also known as "Value Labels" (Salcedo and McCormick, 2020). The data set contains four factors, and each factor contains five-minute variables. In addition, the data disclose a relatively high proportion of consumers who have used a service more than five times and are willing to purchase new product experiences. Two-thirds of all statistical findings are attributable to consumers who use the service more than five times. This is an achievable and encouraging target for the expansion of the company.
Table 2/Customer's Gender
According to statistics, the percentage of female customers is higher than the rate of male customers with 138 female customers and 62 male customers respectively (69% female, only 31% male).
</div><span class="text_page_counter">Trang 34</span><div class="page_container" data-page="34">Table 3/Customer’s Age
In terms of age, out of 200 survey results, the highest proportion of customers aged 36-45 years old was 84 with 42%. Customers from the age after 45 years accounted for 51 people (25.5%). Next is customers aged from 26 to 35, accounting for 46 people (23%). Most customers buy and use the product more than 10 times, accounting for 90 people, about 45%. This is a good number because it is quite high and reflects the level of customer loyalty to the business.
Table 4/How many times have you used our products ?
Survey results for customers who return to buy more than 10 times account for the highest percentage (45%). Next are customers who buy from 5 to 10 times, accounting for 76 people
</div><span class="text_page_counter">Trang 35</span><div class="page_container" data-page="35">(38%). This survey result is very good because it shows that the likelihood of customers coming back next time is very high, it will be one of the variables affecting customer loyalty results.
4.3. Exploratory Factor Analysis (EFA)
After effectively testing and running the reliability of the Cronbach Alpha scale and determining that all variables are sufficient and meet their requirements, the researcher will conduct Exploratory Factor Analysis (or EFA, for short). According to Fabricigar et al (2012), exploratory factor analysis (EFA) is a multivariate statistical instrument that can be used to identify correlations between variables and arrange similar variables into factors. EFA is classified as one of the interdependence approaches, which indicates that the analysis does not differentiate between dependent and independent variables, but rather concentrates on the correlations (interrelationships) between the variables. EFA is utilized to reduce a collection of k observations to a set of F (Fk) factors that are more significant. According to research conducted by W. Holmes Finch (2019), the linear relationship between the components and the primitive variables (observed variables) is the basis for this reduction.
Table 5/Table of KMO and Bartlett's Test
<i><small>Source: Author </small></i>
The KMO coefficient, also known as the Kaiser Meyer Olkin index, is a measure that determines whether or not factor analysis is acceptable. The value of KMO has to be between 0.5 and 1 in order to meet the requirements. If this number is higher, then the factor analysis is a better fit
</div><span class="text_page_counter">Trang 36</span><div class="page_container" data-page="36">for the study data set that was collected (Child, 2006). As can be seen, the first KMO result has a value of 0.780 more than 0.5, while the Bartlett test result has a value of Sig that is less than 0.05. As a result, Exploratory Factor Analysis (also known as EFA) is an appropriate method for analyzing the study data.
Table 6/Communalities
<i><small>Source: Author </small></i>
The communities indicate the quantity of variation in each variable that is taken into account. An estimate of the variance in each variable that has been computed using all of the components or factors constitutes the initial community. If a variable's Communalities value has a low value, between 0.0 and 0.4, it will be deleted, and you will need to examine the pattern matrix or the rotated component matrix once again. According to Denis (2018), an appropriate threshold requirement for the value of Communalities is more than 0.4. The
</div><span class="text_page_counter">Trang 37</span><div class="page_container" data-page="37">findings of the research are shown in the following table. The Extraction coefficient is the variable with the lowest data of the 20 contributing factors, with a value of 0.528. However, in general, all of the variables have a value more than 0.5. Therefore, none of the 20 data variables should be excluded since they satisfy the criteria for the study.
Table 7/Total Variance Explained
<i><small>Source: Author </small></i>
The Total Variation Explained column provides the ratio, stated as a percentage, of the variation accounted for by each component to the total of the variances in all variables. This information is presented in the context of the Total Variance column. If the Total Variance Explained is more than or equal to 50%, then the EFA model is suitable. In order for the elements to be included in the analytical model, the total of all of their Eigenvalues > 1. The results of the research on customer loyalty are shown in the table, and they reveal that the total variance retrieved is
</div><span class="text_page_counter">Trang 38</span><div class="page_container" data-page="38">more than 50%. As a result, the extracted factor accounts for 62.832% of the total variance in the data among the 20 observable variables that took part in the EFA. In addition, the data demonstrate that there are already four variables that have a total Eigenvalue that is more than one. If one more component was to be extracted, it would have a value that is less than one, which would make it ineffective in the process of model analysis. Therefore, the information contained within the 20 observed variables that are a part of the EFA may be best summarized by these four elements.
<i>Table 8/Rotated Component Matrix </i>
<i><small>Source: Author </small></i>
The fundamental result of the principal component analysis is the rotation component matrix, which is also referred to as the payload in certain contexts. It includes estimates of the
</div>