are age weight and height related to body fat percentage
Bạn đang xem bản rút gọn của tài liệu. Xem và tải ngay bản đầy đủ của tài liệu tại đây (1.85 MB, 16 trang )
<span class="text_page_counter">Trang 1</span><div class="page_container" data-page="1">
PROJECT REPORTSubject: MAS202Teacher: Phạm Thanh Hiếu
Group: 2---
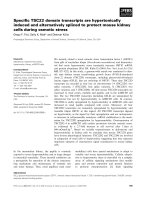
Are age, weight, and height related to body fat percentage?
Group memberNguyễn Xuân Tùng - HS160884Đặng Văn Bảo Linh - HS160591Nguyễn Ngọc Lan - HS160578
Trần Việt Dũng - HS160773An Văn Hải - HS160618
</div><span class="text_page_counter">Trang 2</span><div class="page_container" data-page="2">Table ContentThe presentation consists of 7 parts from sheet 3 to sheet 9
Sheet 1: Report Showcase data and summarize results
Sheet 7: Output analysis Analysis of multivariate linear regressionresults
</div><span class="text_page_counter">Trang 3</span><div class="page_container" data-page="3">The first part is an introduction to the topic and figures:
- What is body fat and how is it calculated: Many health experts suggestthat people use body fat percentages to assess their health. Siri (1956)suggested that the body consists of two components - lean tissue andadipose tissue and that the percentage of body fat can be calculatedusing the formula:
B = (1/D)*[ab/(a-b)] - [b/(a-b)].
- Research shows that people with a high percentage of body fat aremore likely to develop cardiovascular disease and metabolic syndrome,but if the percentage of body fat is too low, it is not necessarily good.The American Journal of Clinical Nutrition puts healthy body fat ratesbased on age (same as in the table). Women generally have a higherpercentage of body fat than men. And body fat will naturally increaseas we age.
- Brief data description: Data on the fat ratio of 251 men, their age,height and weight with the unit: Body fat percentage (%), Age (years),Weight (lbs, 1 lbs = 0.45359237 kg), Height (inches, 1 inch = 2.54 cm)
- Purpose: Conduct confidence intervals, test assumptions for populationmean and linear regression to answer 2 questions:
+ Is there evidence that the average population in terms of body fatpercentage will be greater than 20%?
+ Is there any evidence that men's age, weight, and height arerelated to their body fat percentage?
- Conclude: The regression model showed that 51.62% of the variationin body fat ratio was explained by variations in age, weight, and height.
</div><span class="text_page_counter">Trang 4</span><div class="page_container" data-page="4">- The hypothetical test results for the angular coefficient show that allthree independent variables (age, weight, height) are related to thepercentage of body fat.
- Applied in practice, the regression model can be applied to predict thebody fat percentage of 1 man based on age, weight, and height.- From the topic above, we can learn how to have 1 healthy, safe
percentage of fat:1. Caloric Balance:
Maintaining a healthy percentage of body fat requires the number of caloriesconsumed to be equal to the number of calories burned.
1. Nutritious:
The diet should include high-quality protein that accounts for 10-15% ofdaily calories, 20-30% should come from heart-healthy fats, the remaining55-60% should come from carbohydrate-rich foods such as whole grains,fruits and vegetables.
2. Physical training:
To keep the percentage of body fat at a healthy level it is necessary tobalance it with lean muscle tissue. The optimal way to build and maintainmuscle tissue is physical training.
3. Aerobic exercise:
Aerobic exercise can also help increase the amount of calories burned eachday. In addition, this type of exercise — especially high-intensity exercises— improves heart and lung health and can reduce the percentage of visceralfat, an unhealthy fat that surrounds internal organs that has been linked toheart disease and type 2 diabetes.
This is the original data we have and the statistical data tables describe.
</div><span class="text_page_counter">Trang 5</span><div class="page_container" data-page="5">From the Percentage of fat table, the mean is 19,0378. The median is equalto 19.2%. The standard deviation is 8.1908 and the variance is 67,0884. Therange is 40.1; min and max are 0 and 40.1.
</div><span class="text_page_counter">Trang 6</span><div class="page_container" data-page="6">From the Age table, the mean is 44.8606. The median is equal to 43. Thestandard deviation is 12.6213 and the variance is 159.2965. The range is 59;min and max are 22 and 81.
From the Weight table, the mean is 178.7647 lbs. The median equals 176.25.The standard deviation is 29.3382 and the variance is 860.7278. The range is244.65; min and max are 118.5 and 363.15 lbs.
</div><span class="text_page_counter">Trang 7</span><div class="page_container" data-page="7">From the Height table, the mean is 70.1733 inches. The median equals to 70.The standard deviation is 3.6494 and the variance is 13.3183.The range is48.25; min and max are 29.5 and 77.75 inches.
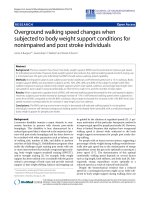
</div><span class="text_page_counter">Trang 8</span><div class="page_container" data-page="8">It can be seen from the box and whisker plot that the body fat percentage hasQ1=12.4, Q2=19.2 and Q3=25.3. Most men have a body fat percentagebetween 10 and 30%. Only 1 person exceeded 40%.
It can be seen from the box and whisker plot that the weights haveQ1=158.25, Q2=176.25; and Q3=197 lbs. Most weigh between 138.5 and218.5 lbs. Very few people weigh over 250 lbs.
</div><span class="text_page_counter">Trang 9</span><div class="page_container" data-page="9">It can be seen from the box and whisker plot that the ages have Q1=35,Q2=43, and Q3=54. Most of those surveyed are young and middle-agedmen.
It can be seen from the box and whisker plot that height has Q1= 68.25, Q2=70, and Q3=72.25 inches. All men in the data, with the exception of one, are59.5 inches or more tall.
</div><span class="text_page_counter">Trang 10</span><div class="page_container" data-page="10">95% Confidence Interval for population mean: Body FatWith 95% confidence, thepopulation mean for body fatpercentage would be in the range18.0196 to 20.056.
95% Confidence Interval for population mean: Age
With 95% confidence, the populationmean of age would be between43.2916 and 46.4296.
</div><span class="text_page_counter">Trang 11</span><div class="page_container" data-page="11">95% Confidence Interval for population mean: Height
With 95% confidence, the populationmean of height would be between69.7196 and 70,627 inches.
95% Confidence Interval for population mean: Weight
With 95% confidence, thepopulation mean of weight wouldbe between 175,1176 and 182.4118lbs.
</div><span class="text_page_counter">Trang 12</span><div class="page_container" data-page="12">- The mean age is 44,8686. According to the American Journal ofClinical Nutrition, a healthy body fat percentage for men aged 40 to 59should decrease by about 11% to 21%. So the question is at 0.05 levelof significance, is there evidence that the population mean of body fatwill be greater than 20% ?
H0: μ=20 (%)H1: μ>20 (%)
t_stat = (sample mean-population mean)/standard error = -1,861degree of freedom = n-1= 251-1 = 250 => t_critical value = t_0.05; 250Since -1.861 < 1.6510, do not reject H0.
We can conclude: There is insufficient evidence that the population mean ofbody fat will be greater than 20%.
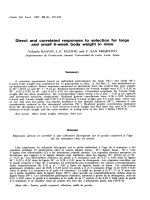
</div><span class="text_page_counter">Trang 13</span><div class="page_container" data-page="13">Here are the results of the regression run.
After running the regression in excel, we see:
- R square = 0.5162 means that 51.62% of variation in body fatpercentage is explained by variation in age, weight and height.- The number of observations was 251 men.
- Significance F or p-value < level of significance 0.01 so the regressionmodel is statistically significant.
</div><span class="text_page_counter">Trang 14</span><div class="page_container" data-page="14">y = 15.7027 + 0.1692 x1 + 0.1936 x2 - 0.5538 x3.+ y is the estimated percentage of body fat.+ x1: age (years).
+ x2: weight (lbs).+ x3: height (inches)
- Based on this model, we can estimate the body fat percentage of a 20year old male, weighing 150 lbs (~68kg), 70 inches tall (~178cm) as
9,3607% =(15.7027 + 0.1692). * 20 + 0 , 1936 * 150 - 0.5538 * 70
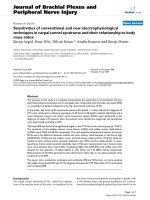
</div><span class="text_page_counter">Trang 15</span><div class="page_container" data-page="15">- Test assumptions for slope
- We will compare the results p-value and level of significance 0.01 toconclude.
- p_value of age < 0.01. Therefore, this coefficient is statisticallysignificant and age is related to body fat percentage.
- p_value of weight < 0.01. Therefore, this coefficient is statisticallysignificant and weight is related to body fat percentage.
- p_value of height < 0.01. Therefore, this coefficient is statisticallysignificant and height is related to body fat percentage.
</div><span class="text_page_counter">Trang 16</span><div class="page_container" data-page="16">