Robot Localization and Map Building ppt
Bạn đang xem bản rút gọn của tài liệu. Xem và tải ngay bản đầy đủ của tài liệu tại đây (37.53 MB, 560 trang )
I
Robot Localization and Map Building
Robot Localization and Map Building
Edited by
Hanafiah Yussof
In-Tech
intechweb.org
Published by In-Teh
In-Teh
Olajnica 19/2, 32000 Vukovar, Croatia
Abstracting and non-prot use of the material is permitted with credit to the source. Statements and
opinions expressed in the chapters are these of the individual contributors and not necessarily those of
the editors or publisher. No responsibility is accepted for the accuracy of information contained in the
published articles. Publisher assumes no responsibility liability for any damage or injury to persons or
property arising out of the use of any materials, instructions, methods or ideas contained inside. After
this work has been published by the In-Teh, authors have the right to republish it, in whole or part, in any
publication of which they are an author or editor, and the make other personal use of the work.
© 2010 In-teh
www.intechweb.org
Additional copies can be obtained from:
First published March 2010
Printed in India
Technical Editor: Sonja Mujacic
Cover designed by Dino Smrekar
Robot Localization and Map Building,
Edited by Hanaah Yussof
p. cm.
ISBN 978-953-7619-83-1
V
Preface
Navigation of mobile platform is a broad topic, covering a large spectrum of different
technologies and applications. As one of the important technology highlighting the 21st
century, autonomous navigation technology is currently used in broader spectra, ranging
from basic mobile platform operating in land such as wheeled robots, legged robots,
automated guided vehicles (AGV) and unmanned ground vehicle (UGV), to new application
in underwater and airborne such as underwater robots, autonomous underwater vehicles
(AUV), unmanned maritime vehicle (UMV), ying robots and unmanned aerial vehicle
(UAV).
Localization and mapping are the essence of successful navigation in mobile platform
technology. Localization is a fundamental task in order to achieve high levels of autonomy
in robot navigation and robustness in vehicle positioning. Robot localization and mapping is
commonly related to cartography, combining science, technique and computation to build
a trajectory map that reality can be modelled in ways that communicate spatial information
effectively. The goal is for an autonomous robot to be able to construct (or use) a map or oor
plan and to localize itself in it. This technology enables robot platform to analyze its motion
and build some kind of map so that the robot locomotion is traceable for humans and to ease
future motion trajectory generation in the robot control system. At present, we have robust
methods for self-localization and mapping within environments that are static, structured,
and of limited size. Localization and mapping within unstructured, dynamic, or large-scale
environments remain largely an open research problem.
Localization and mapping in outdoor and indoor environments are challenging tasks in
autonomous navigation technology. The famous Global Positioning System (GPS) based
on satellite technology may be the best choice for localization and mapping at outdoor
environment. Since this technology is not applicable for indoor environment, the problem
of indoor navigation is rather complex. Nevertheless, the introduction of Simultaneous
Localization and Mapping (SLAM) technique has become the key enabling technology for
mobile robot navigation at indoor environment. SLAM addresses the problem of acquiring a
spatial map of a mobile robot environment while simultaneously localizing the robot relative
to this model. The solution method for SLAM problem, which are mainly introduced in
this book, is consists of three basic SLAM methods. The rst is known as extended Kalman
lters (EKF) SLAM. The second is using sparse nonlinear optimization methods that based
on graphical representation. The nal method is using nonparametric statistical ltering
techniques known as particle lters. Nowadays, the application of SLAM has been expended
to outdoor environment, for use in outdoor’s robots and autonomous vehicles and aircrafts.
Several interesting works related to this issue are presented in this book. The recent rapid
VI
progress in sensors and fusion technology has also benets the mobile platforms performing
navigation in term of improving environment recognition quality and mapping accuracy. As
one of important element in robot localization and map building, this book presents interesting
reports related to sensing fusion and network for optimizing environment recognition in
autonomous navigation.
This book describes comprehensive introduction, theories and applications related to
localization, positioning and map building in mobile robot and autonomous vehicle platforms.
It is organized in twenty seven chapters. Each chapter is rich with different degrees of details
and approaches, supported by unique and actual resources that make it possible for readers
to explore and learn the up to date knowledge in robot navigation technology. Understanding
the theory and principles described in this book requires a multidisciplinary background of
robotics, nonlinear system, sensor network, network engineering, computer science, physics,
etc.
The book at rst explores SLAM problems through extended Kalman lters, sparse nonlinear
graphical representation and particle lters methods. Next, fundamental theory of motion
planning and map building are presented to provide useful platform for applying SLAM
methods in real mobile systems. It is then followed by the application of high-end sensor
network and fusion technology that gives useful inputs for realizing autonomous navigation
in both indoor and outdoor environments. Finally, some interesting results of map building
and tracking can be found in 2D, 2.5D and 3D models. The actual motion of robots and
vehicles when the proposed localization and positioning methods are deployed to the system
can also be observed together with tracking maps and trajectory analysis. Since SLAM
techniques mostly deal with static environments, this book provides good reference for future
understanding the interaction of moving and non-moving objects in SLAM that still remain as
open research issue in autonomous navigation technology.
Hanaah Yussof
Nagoya University, Japan
Universiti Teknologi MARA, Malaysia
VII
Contents
Preface V
1. VisualLocalisationofquadrupedwalkingrobots 001
RenatoSamperioandHuoshengHu
2. Rangingfusionforaccuratingstateoftheartrobotlocalization 027
HamedBastaniandHamidMirmohammad-Sadeghi
3. BasicExtendedKalmanFilter–SimultaneousLocalisationandMapping 039
OduetseMatsebe,MolaletsaNamosheandNkgathoTlale
4. ModelbasedKalmanFilterMobileRobotSelf-Localization 059
EdouardIvanjko,AndrejaKitanovandIvanPetrović
5. GlobalLocalizationbasedonaRejectionDifferentialEvolutionFilter 091
M.L.Muñoz,L.Moreno,D.BlancoandS.Garrido
6. ReliableLocalizationSystemsincludingGNSSBiasCorrection 119
PierreDelmas,ChristopheDebain,RolandChapuisandCédricTessier
7. Evaluationofaligningmethodsforlandmark-basedmapsinvisualSLAM 133
MónicaBallesta,ÓscarReinoso,ArturoGil,LuisPayáandMiguelJuliá
8. KeyElementsforMotionPlanningAlgorithms 151
AntonioBenitez,IgnacioHuitzil,DanielVallejo,JorgedelaCallejaandMa.AuxilioMedina
9. OptimumBipedTrajectoryPlanningforHumanoidRobotNavigationinUnseen
Environment 175
HanaahYussofandMasahiroOhka
10. Multi-RobotCooperativeSensingandLocalization 207
Kai-TaiSong,Chi-YiTsaiandCheng-HsienChiuHuang
11. FilteringAlgorithmforReliableLocalizationofMobileRobotinMulti-Sensor
Environment 227
Yong-ShikKim,JaeHoonLee,BongKeunKim,HyunMinDoandAkihisaOhya
12. ConsistentMapBuildingBasedonSensorFusionforIndoorServiceRobot 239
RenC.LuoandChunC.Lai
VIII
13. MobileRobotLocalizationandMapBuildingforaNonholonomicMobileRobot 253
SongminJiaandAkiraYasuda
14. RobustGlobalUrbanLocalizationBasedonRoadMaps 267
JoseGuivant,MarkWhittyandAliciaRobledo
15. ObjectLocalizationusingStereoVision 285
SaiKrishnaVuppala
16. VisionbasedSystemsforLocalizationinServiceRobots 309
PaulrajM.P.andHemaC.R.
17. Floortexturevisualservousingmultiplecamerasformobilerobotlocalization 323
TakeshiMatsumoto,DavidPowersandNasserAsgari
18. Omni-directionalvisionsensorformobilerobotnavigationbasedonparticlelter 349
ZuoliangCao,YanbinLiandShenghuaYe
19. VisualOdometryandmappingforunderwaterAutonomousVehicles 365
SilviaBotelho,GabrielOliveira,PauloDrews,MônicaFigueiredoandCelinaHaffele
20. ADaisy-ChainingVisualServoingApproachwithApplicationsin
Tracking,Localization,andMapping 383
S.S.Mehta,W.E.Dixon,G.HuandN.Gans
21. VisualBasedLocalizationofaLeggedRobotwithatopologicalrepresentation 409
FranciscoMartín,VicenteMatellán,JoséMaríaCañasandCarlosAgüero
22. MobileRobotPositioningBasedonZigBeeWirelessSensor
NetworksandVisionSensor 423
WangHongbo
23. AWSNs-basedApproachandSystemforMobileRobotNavigation 445
HuaweiLiang,TaoMeiandMaxQ H.Meng
24. Real-TimeWirelessLocationandTrackingSystemwithMotionPatternDetection 467
PedroAbreua,VascoVinhasa,PedroMendesa,LuísPauloReisaandJúlioGargantab
25. SoundLocalizationforRobotNavigation 493
JieHuang
26. ObjectsLocalizationandDifferentiationUsingUltrasonicSensors 521
BogdanKreczmer
27. HeadingMeasurementsforIndoorMobileRobotswithMinimized
DriftusingaMEMSGyroscopes 545
SungKyungHongandYoung-sunRyuh
28. MethodsforWheelSlipandSinkageEstimationinMobileRobots 561
GiulioReina
VisualLocalisationofquadrupedwalkingrobots 1
VisualLocalisationofquadrupedwalkingrobots
RenatoSamperioandHuoshengHu
0
Visual Localisation of quadruped walking robots
Renato Samperio and Huosheng Hu
School of Computer Science and Electronic Engineering, University of Essex
United Kingdom
1. Introduction
Recently, several solutions to the robot localisation problem have been proposed in the sci-
entific community. In this chapter we present a localisation of a visual guided quadruped
walking robot in a dynamic environment. We investigate the quality of robot localisation and
landmark detection, in which robots perform the RoboCup competition (Kitano et al., 1997).
The first part presents an algorithm to determine any entity of interest in a global reference
frame, where the robot needs to locate landmarks within its surroundings. In the second part,
a fast and hybrid localisation method is deployed to explore the characteristics of the proposed
localisation method such as processing time, convergence and accuracy.
In general, visual localisation of legged robots can be achieved by using artificial and natural
landmarks. The landmark modelling problem has been already investigated by using prede-
fined landmark matching and real-time landmark learning strategies as in (Samperio & Hu,
2010). Also, by following the pre-attentive and attentive stages of previously presented work
of (Quoc et al., 2004), we propose a landmark model for describing the environment with "in-
teresting" features as in (Luke et al., 2005), and to measure the quality of landmark description
and selection over time as shown in (Watman et al., 2004). Specifically, we implement visual
detection and matching phases of a pre-defined landmark model as in (Hayet et al., 2002) and
(Sung et al., 1999), and for real-time recognised landmarks in the frequency domain (Maosen
et al., 2005) where they are addressed by a similarity evaluation process presented in (Yoon
& Kweon, 2001). Furthermore, we have evaluated the performance of proposed localisation
methods, Fuzzy-Markov (FM), Extended Kalman Filters (EKF) and an combined solution of
Fuzzy-Markov-Kalman (FM-EKF),as in (Samperio et al., 2007)(Hatice et al., 2006).
The proposed hybrid method integrates a probabilistic multi-hypothesis and grid-based maps
with EKF-based techniques. As it is presented in (Kristensen & Jensfelt, 2003) and (Gutmann
et al., 1998), some methodologies require an extensive computation but offer a reliable posi-
tioning system. By cooperating a Markov-based method into the localisation process (Gut-
mann, 2002), EKF positioning can converge faster with an inaccurate grid observation. Also.
Markov-based techniques and grid-based maps (Fox et al., 1998) are classic approaches to
robot localisation but their computational cost is huge when the grid size in a map is small
(Duckett & Nehmzow, 2000) and (Jensfelt et al., 2000) for a high resolution solution. Even
the problem has been partially solved by the Monte Carlo (MCL) technique (Fox et al., 1999),
(Thrun et al., 2000) and (Thrun et al., 2001), it still has difficulties handling environmental
changes (Tanaka et al., 2004). In general, EKF maintains a continuous estimation of robot po-
sition, but can not manage multi-hypothesis estimations as in (Baltzakis & Trahanias, 2002).
1
RobotLocalizationandMapBuilding2
Moreover, traditional EKF localisation techniques are computationally efficient, but they may
also fail with quadruped walking robots present poor odometry, in situations such as leg slip-
page and loss of balance. Furthermore, we propose a hybrid localisation method to eliminate
inconsistencies and fuse inaccurate odometry data with costless visual data. The proposed
FM-EKF localisation algorithm makes use of a fuzzy cell to speed up convergence and to
maintain an efficient localisation. Subsequently, the performance of the proposed method was
tested in three experimental comparisons: (i) simple movements along the pitch, (ii) localising
and playing combined behaviours and c) kidnapping the robot.
The rest of the chapter is organised as follows. Following the brief introduction of Section 1,
Section 2 describes the proposed observer module as an updating process of a Bayesian lo-
calisation method. Also, robot motion and measurement models are presented in this section
for real-time landmark detection. Section 3 investigates the proposed localisation methods.
Section 4 presents the system architecture. Some experimental results on landmark modelling
and localisation are presented in Section 5 to show the feasibility and performance of the pro-
posed localisation methods. Finally, a brief conclusion is given in Section 6.
2. Observer design
This section describes a robot observer model for processing motion and measurement phases.
These phases, also known as Predict and Update, involve a state estimation in a time sequence
for robot localisation. Additionally, at each phase the state is updated by sensing information
and modelling noise for each projected state.
2.1 Motion Model
The state-space process requires a state vector as processing and positioning units in an ob-
server design problem. The state vector contains three variables for robot localisation, i.e., 2D
position (x, y) and orientation (θ). Additionally, the prediction phase incorporates noise from
robot odometry, as it is presented below:
x
−
t
y
−
t
θ
−
t
=
x
t−1
y
t−1
θ
t−1
+
(u
lin
t
+ w
lin
t
)cosθ
t−1
−(u
lat
t
+ w
lat
t
)si nθ
t−1
(u
lin
t
+ w
lin
t
)si nθ
t−1
+ (u
lat
t
+ w
lat
t
)cosθ
t−1
u
rot
t
+ w
rot
t
(4.9)
where u
lat
, u
lin
and u
rot
are the lateral, linear and rotational components of odometry, and
w
lat
, w
lin
and w
rot
are the lateral, linear and rotational components in errors of odometry.
Also, t
−1 refers to the time of the previous time step and t to the time of the current step.
In general, state estimation is a weighted combination of noisy states using both priori and
posterior estimations. Likewise, assuming that v is the measurement noise and w is the pro-
cess noise, the expected value of the measurement R and process noise Q covariance matrixes
are expressed separately as in the following equations:
R
= E[vv
t
] (4.10)
Q
= E[ww
t
] (4.11)
The measurement noise in matrix R represents sensor errors and the Q matrix is also a con-
fidence indicator for current prediction which increases or decreases state uncertainty. An
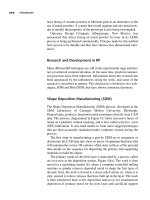
odometry motion model, u
t−1
is adopted as shown in Figure 1. Moreover, Table 1 describes
all variables for three dimensional (linear, lateral and rotational) odometry information where
(
x,
y
) is the estimated values and (x, y) the actual states.
Fig. 1. The proposed motion model for Aibo walking robot
According to the empirical experimental data, the odometry system presents a deviation of
30% on average as shown in Equation (4.12). Therefore, by applying a transformation matrix
W
t
from Equation (4.13), noise can be addressed as robot uncertainty where θ points the robot
heading.
Q
t
=
(0.3u
lin
t
)
2
0 0
0
(0.3u
lat
t
)
2
0
0 0
(0.3u
rot
t
+
√
(u
lin
t
)
2
+(u
lat
t
)
2
500
)
2
(4.12)
W
t
= f w =
cosθ
t−1
−senθ
t−1
0
sen θ
t−1
cosθ
t−1
0
0 0 1
(4.13)
2.2 Measurement Model
In order to relate the robot to its surroundings, we make use of a landmark representation. The
landmarks in the robot environment require notational representation of a measured vector f
i
t
for each i-th feature as it is described in the following equation:
f
(z
t
) = {f
1
t
, f
2
t
, } = {
r
1
t
b
1
t
s
1
t
,
r
2
t
b
2
t
s
2
t
,
} (4.14)
where landmarks are detected by an onboard active camera in terms of range r
i
t
, bearing b
i
t
and a signature s
i
t
for identifying each landmark. A landmark measurement model is defined
by a feature-based map m, which consists of a list of signatures and coordinate locations as
follows:
m
= {m
1
, m
2
, } = {(m
1,x
, m
1,y
), (m
2,x
, m
2,y
), } (4.15)
VisualLocalisationofquadrupedwalkingrobots 3
Moreover, traditional EKF localisation techniques are computationally efficient, but they may
also fail with quadruped walking robots present poor odometry, in situations such as leg slip-
page and loss of balance. Furthermore, we propose a hybrid localisation method to eliminate
inconsistencies and fuse inaccurate odometry data with costless visual data. The proposed
FM-EKF localisation algorithm makes use of a fuzzy cell to speed up convergence and to
maintain an efficient localisation. Subsequently, the performance of the proposed method was
tested in three experimental comparisons: (i) simple movements along the pitch, (ii) localising
and playing combined behaviours and c) kidnapping the robot.
The rest of the chapter is organised as follows. Following the brief introduction of Section 1,
Section 2 describes the proposed observer module as an updating process of a Bayesian lo-
calisation method. Also, robot motion and measurement models are presented in this section
for real-time landmark detection. Section 3 investigates the proposed localisation methods.
Section 4 presents the system architecture. Some experimental results on landmark modelling
and localisation are presented in Section 5 to show the feasibility and performance of the pro-
posed localisation methods. Finally, a brief conclusion is given in Section 6.
2. Observer design
This section describes a robot observer model for processing motion and measurement phases.
These phases, also known as Predict and Update, involve a state estimation in a time sequence
for robot localisation. Additionally, at each phase the state is updated by sensing information
and modelling noise for each projected state.
2.1 Motion Model
The state-space process requires a state vector as processing and positioning units in an ob-
server design problem. The state vector contains three variables for robot localisation, i.e., 2D
position (x, y) and orientation (θ). Additionally, the prediction phase incorporates noise from
robot odometry, as it is presented below:
x
−
t
y
−
t
θ
−
t
=
x
t−1
y
t−1
θ
t−1
+
(u
lin
t
+ w
lin
t
)cosθ
t−1
−(u
lat
t
+ w
lat
t
)si nθ
t−1
(u
lin
t
+ w
lin
t
)si nθ
t−1
+ (u
lat
t
+ w
lat
t
)cosθ
t−1
u
rot
t
+ w
rot
t
(4.9)
where u
lat
, u
lin
and u
rot
are the lateral, linear and rotational components of odometry, and
w
lat
, w
lin
and w
rot
are the lateral, linear and rotational components in errors of odometry.
Also, t
−1 refers to the time of the previous time step and t to the time of the current step.
In general, state estimation is a weighted combination of noisy states using both priori and
posterior estimations. Likewise, assuming that v is the measurement noise and w is the pro-
cess noise, the expected value of the measurement R and process noise Q covariance matrixes
are expressed separately as in the following equations:
R
= E[vv
t
] (4.10)
Q
= E[ww
t
] (4.11)
The measurement noise in matrix R represents sensor errors and the Q matrix is also a con-
fidence indicator for current prediction which increases or decreases state uncertainty. An
odometry motion model, u
t−1
is adopted as shown in Figure 1. Moreover, Table 1 describes
all variables for three dimensional (linear, lateral and rotational) odometry information where
(
x,
y
) is the estimated values and (x, y) the actual states.
Fig. 1. The proposed motion model for Aibo walking robot
According to the empirical experimental data, the odometry system presents a deviation of
30% on average as shown in Equation (4.12). Therefore, by applying a transformation matrix
W
t
from Equation (4.13), noise can be addressed as robot uncertainty where θ points the robot
heading.
Q
t
=
(0.3u
lin
t
)
2
0 0
0
(0.3u
lat
t
)
2
0
0 0
(0.3u
rot
t
+
√
(u
lin
t
)
2
+(u
lat
t
)
2
500
)
2
(4.12)
W
t
= f w =
cosθ
t−1
−senθ
t−1
0
sen θ
t−1
cosθ
t−1
0
0 0 1
(4.13)
2.2 Measurement Model
In order to relate the robot to its surroundings, we make use of a landmark representation. The
landmarks in the robot environment require notational representation of a measured vector f
i
t
for each i-th feature as it is described in the following equation:
f
(z
t
) = {f
1
t
, f
2
t
, } = {
r
1
t
b
1
t
s
1
t
,
r
2
t
b
2
t
s
2
t
,
} (4.14)
where landmarks are detected by an onboard active camera in terms of range r
i
t
, bearing b
i
t
and a signature s
i
t
for identifying each landmark. A landmark measurement model is defined
by a feature-based map m, which consists of a list of signatures and coordinate locations as
follows:
m
= {m
1
, m
2
, } = {(m
1,x
, m
1,y
), (m
2,x
, m
2,y
), } (4.15)
RobotLocalizationandMapBuilding4
Variable Description
x
a
x axis of world coordinate system
y
a
y axis of world coordinate system
x
t−1
previous robot x position in world coordinate system
y
t−1
previous robot y position in world coordinate system
θ
t−1
previous robot heading in world coordinate system
x
t−1
previous state x axis in robot coordinate system
y
t−1
previous state y axis in robot coordinate system
u
lin,lat
t
lineal and lateral odometry displacement in robot coordinate system
u
rot
t
rotational odometry displacement in robot coordinate system
x
t
current robot x position in world coordinate system
y
t
current robot y position in world coordinate system
θ
t
current robot heading in world coordinate system
x
t
current state x axis in robot coordinate system
y
t
current state y axis in robot coordinate system
Table 1. Description of variables for obtaining linear, lateral and rotational odometry informa-
tion.
where the i-th feature at time t corresponds to the j-th landmark detected by a robot whose
pose is x
t
=
x y θ
T
the implemented model is:
r
i
t
(x, y, θ)
b
i
t
(x, y, θ)
s
i
t
(x, y, θ)
=
(m
j,x
− x)
2
+ (m
j,y
−y)
2
atan2(m
j,y
−y, m
j,x
− x) ) − θ
s
j
(4.16)
The proposed landmark model requires an already known environment with defined land-
marks and constantly observed visual features. Therefore, robot perception uses mainly de-
fined landmarks if they are qualified as reliable landmarks.
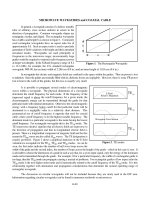
2.2.1 Defined Landmark Recognition
The landmarks are coloured beacons located in a fixed position and are recognised by image
operators. Figure 2 presents the quality of the visual detection by a comparison of distance
errors in the observations of beacons and goals. As can be seen, the beacons are better recog-
nised than goals when they are far away from the robot. Any visible landmark in a range from
2m to 3m has a comparatively less error than a near object. Figure 2.b shows the angle errors
for beacons and goals respectively, where angle errors of beacons are bigger than the ones for
goals. The beacon errors slightly reduces when object becomes distant. Contrastingly, the goal
errors increases as soon the robot has a wider angle of perception.
These graphs also illustrates errors for observations with distance and angle variations. In
both graphs, error measurements are presented in constant light conditions and without oc-
clusion or any external noise that can affect the landmark perception.
2.2.2 Undefined Landmark Recognition
A landmark modelling is used for detecting undefined environment and frequently appearing
features. The procedure is accomplished by characterising and evaluating familiarised shapes
from detected objects which are characterised by sets of properties or entities. Such process is
described in the following stages:
Fig. 2. Distance and angle errors in landmarks observations for beacons and goals of proposed
landmark model.
• Entity Recognition The first stage of dynamic landmark modelling relies on feature
identification from constantly observed occurrences. The information is obtained from
colour surface descriptors by a landmark entity structure. An entity is integrated by
pairs or triplets of blobs with unique characteristics constructed from merging and com-
paring linear blobs operators. The procedure interprets surface characteristics for ob-
taining range frequency by using the following operations:
1. Obtain and validate entity’s position from the robot’s perspective.
2. Get blobs’ overlapping values with respect to their size.
3. Evaluate compactness value from blobs situated in a bounding box.
4. Validate eccentricity for blobs assimilated in current the entity.
• Model Evaluation
The model evaluation phase describes a procedure for achieving landmark entities for a
real time recognition. The process makes use of previously defined models and merges
them for each sensing step. The process is described in Algorithm 1:
From the main loop algorithm is obtained a list of candidate entities
{E} to obtain a col-
lection of landmark models
{L}. This selection requires three operations for comparing
an entity with a landmark model:
– Colour combination is used for checking entities with same type of colours as a
landmark model.
– Descriptive operators, are implemented for matching features with a similar char-
acteristics. The matching process merges entities with a
±0.3 range ratio from
defined models.
– Time stamp and Frequency are recogised every minute for filtering long lasting
models using a removing and merging process of non leading landmark models.
The merging process is achieved using a bubble sort comparison with a swapping stage
modified for evaluating similarity values and it also eliminates 10% of the landmark
VisualLocalisationofquadrupedwalkingrobots 5
Variable Description
x
a
x axis of world coordinate system
y
a
y axis of world coordinate system
x
t−1
previous robot x position in world coordinate system
y
t−1
previous robot y position in world coordinate system
θ
t−1
previous robot heading in world coordinate system
x
t−1
previous state x axis in robot coordinate system
y
t−1
previous state y axis in robot coordinate system
u
lin,lat
t
lineal and lateral odometry displacement in robot coordinate system
u
rot
t
rotational odometry displacement in robot coordinate system
x
t
current robot x position in world coordinate system
y
t
current robot y position in world coordinate system
θ
t
current robot heading in world coordinate system
x
t
current state x axis in robot coordinate system
y
t
current state y axis in robot coordinate system
Table 1. Description of variables for obtaining linear, lateral and rotational odometry informa-
tion.
where the i-th feature at time t corresponds to the j-th landmark detected by a robot whose
pose is x
t
=
x y θ
T
the implemented model is:
r
i
t
(x, y, θ)
b
i
t
(x, y, θ)
s
i
t
(x, y, θ)
=
(m
j,x
− x)
2
+ (m
j,y
−y)
2
atan2(m
j,y
−y, m
j,x
− x) ) − θ
s
j
(4.16)
The proposed landmark model requires an already known environment with defined land-
marks and constantly observed visual features. Therefore, robot perception uses mainly de-
fined landmarks if they are qualified as reliable landmarks.
2.2.1 Defined Landmark Recognition
The landmarks are coloured beacons located in a fixed position and are recognised by image
operators. Figure 2 presents the quality of the visual detection by a comparison of distance
errors in the observations of beacons and goals. As can be seen, the beacons are better recog-
nised than goals when they are far away from the robot. Any visible landmark in a range from
2m to 3m has a comparatively less error than a near object. Figure 2.b shows the angle errors
for beacons and goals respectively, where angle errors of beacons are bigger than the ones for
goals. The beacon errors slightly reduces when object becomes distant. Contrastingly, the goal
errors increases as soon the robot has a wider angle of perception.
These graphs also illustrates errors for observations with distance and angle variations. In
both graphs, error measurements are presented in constant light conditions and without oc-
clusion or any external noise that can affect the landmark perception.
2.2.2 Undefined Landmark Recognition
A landmark modelling is used for detecting undefined environment and frequently appearing
features. The procedure is accomplished by characterising and evaluating familiarised shapes
from detected objects which are characterised by sets of properties or entities. Such process is
described in the following stages:
Fig. 2. Distance and angle errors in landmarks observations for beacons and goals of proposed
landmark model.
• Entity Recognition The first stage of dynamic landmark modelling relies on feature
identification from constantly observed occurrences. The information is obtained from
colour surface descriptors by a landmark entity structure. An entity is integrated by
pairs or triplets of blobs with unique characteristics constructed from merging and com-
paring linear blobs operators. The procedure interprets surface characteristics for ob-
taining range frequency by using the following operations:
1. Obtain and validate entity’s position from the robot’s perspective.
2. Get blobs’ overlapping values with respect to their size.
3. Evaluate compactness value from blobs situated in a bounding box.
4. Validate eccentricity for blobs assimilated in current the entity.
• Model Evaluation
The model evaluation phase describes a procedure for achieving landmark entities for a
real time recognition. The process makes use of previously defined models and merges
them for each sensing step. The process is described in Algorithm 1:
From the main loop algorithm is obtained a list of candidate entities
{E} to obtain a col-
lection of landmark models
{L}. This selection requires three operations for comparing
an entity with a landmark model:
– Colour combination is used for checking entities with same type of colours as a
landmark model.
– Descriptive operators, are implemented for matching features with a similar char-
acteristics. The matching process merges entities with a
±0.3 range ratio from
defined models.
– Time stamp and Frequency are recogised every minute for filtering long lasting
models using a removing and merging process of non leading landmark models.
The merging process is achieved using a bubble sort comparison with a swapping stage
modified for evaluating similarity values and it also eliminates 10% of the landmark
RobotLocalizationandMapBuilding6
Algorithm 1 Process for creating a landmark model from a list of observed features.
Require: Map of observed features {E}
Require: A collection of landmark models {L}
{The following operations generate the landmark model information.}
1:
for all {E}
i
⊆ {E} do
2: Evaluate ColourCombination({E}
i
) {C}
i
3: Evaluate BlobDistances({E}
i
) d
i
4: Obtain TimeStamp({E}
i
i) t
i
5: Create Entity({C}
i
, d
i
, t
i
) j
6: for {L}
k
MATCHON{L} do {If information is similar to an achieved model }
7: if j ∈ {L}
k
then
8: Update {L}
k
(j) {Update modelled values and}
9:
Increase {L}
k
frequency {Increase modelled frequency}
10:
else {If modelled information does not exist }
11: Create {L}
k+1
(j) {Create model and}
12:
Increase {L}
k+1
frequency {Increase modelled frequency}
13:
end if
14: if time > 1 min then {After one minute }
15: MergeList({L }) {Select best models}
16:
end if
17: end for
18: end for
candidates. The similarity values are evaluated using Equation 3.4 and the probability
of perception using Equation 3.5:
p
(i, j) =
M(i, j)
N
∑
k=1
M(k, j)
(3.4)
M
(i, j) =
P
∑
l=1
E(i, j, l) (3.5)
where N indicates the achieved candidate models, i is the sampled entity, j is the
compared landmark model, M
(i, j) is the landmark similarity measure obtained from
matching an entity’s descriptors and assigning a probability of perception as described
in Equation 3.6, P is the total descriptors, l is a landmark descriptor and E
(i, j, l) is the
Euclidian distance of each landmark model compared, estimated using Equation 3.7:
N
∑
k=1
M(k, j) = 1 (3.6)
E
(i, j, l) =
L
l
∑
m=1
(i
m
−l
m
)
2
σ
2
m
(3.7)
where L
l
refers to all possible operators from the current landmark model, σ
m
is the
standard deviation for each sampled entity i
m
in a sample set and l is a landmark de-
scriptor value.
3. Localisation Methods
Robot localisation is an environment analysis task determined by an internal state obtained
from robot-environment interaction combined with any sensed observations. The traditional
state assumption relies on the robot’s influence over its world and on the robot’s perception
of its environment.
Both steps are logically divided into independent processes which use a state transition for
integrating data into a predictive and updating state. Therefore, the implemented localisation
methods contain measurement and control phases as part of state integration and a robot
pose conformed through a Bayesian approach. On the one hand, the control phase is assigned
to robot odometry which translates its motion into lateral, linear and rotational velocities. On
the other hand, the measurement phase integrates robot sensed information by visual features.
The following sections describe particular phase characteristics for each localisation approach.
3.1 Fuzzy Markov Method
As it is shown in the FM grid-based method of (Buschka et al., 2000) and (Herrero-Pérez et al.,
2004), a grid G
t
contains a number of cells for each grid element G
t
(x, y) for holding a proba-
bility value for a possible robot position in a range of
[0, 1]. The fuzzy cell (fcell) is represented
as a fuzzy trapezoid (Figure 3) defined by a tuple
< θ, ∆, α, h, b >, where θ is robot orientation
at the trapezoid centre with values in a range of
[0, 2π]; ∆ is uncertainty in a robot orientation
θ; h corresponds to fuzzy cell (fcell) with a range of
[0, 1]; α is a slope in the trapezoid, and b is
a correcting bias.
Fig. 3. Graphic representation of robot pose in an f u zzy cell
Since a Bayesian filtering technique is implemented, localisation process works in predict-
observe-update phases for estimating robot state. In particular, the Predict step adjusts to
motion information from robot movements. Then, the Observe step gathers sensed infor-
mation. Finally, the Update step incorporates results from the Predict and Observe steps for
obtaining a new estimation of a fuzzy grid-map. The process sequence is described as follows:
1. Predict step. During this step, robot movements along grid-cells are represented by a
distribution which is continuously blurred. As described in previous work in (Herrero-
Pérez et al., 2004), the blurring is based on odometry information reducing grid occu-
pancy for robot movements as shown in Figure 4(c)). Thus, the grid state G
t
is obtained
by performing a translation and rotation of G
t−1
state distribution according to motion
u. Subsequently, this odometry-based blurring, B
t
, is uniformly calculated for including
uncertainty in a motion state.
VisualLocalisationofquadrupedwalkingrobots 7
Algorithm 1 Process for creating a landmark model from a list of observed features.
Require: Map of observed features
{E}
Require: A collection of landmark models {L}
{The following operations generate the landmark model information.}
1:
for all {E}
i
⊆ {E} do
2: Evaluate ColourCombination({E}
i
) {C}
i
3: Evaluate BlobDistances({E}
i
) d
i
4: Obtain TimeStamp({E}
i
i) t
i
5: Create Entity({C}
i
, d
i
, t
i
) j
6: for {L}
k
MATCHON{L} do {If information is similar to an achieved model }
7: if j ∈ {L}
k
then
8: Update {L}
k
(j) {Update modelled values and}
9:
Increase {L}
k
frequency {Increase modelled frequency}
10:
else {If modelled information does not exist }
11: Create {L}
k+1
(j) {Create model and}
12:
Increase {L}
k+1
frequency {Increase modelled frequency}
13:
end if
14: if time > 1 min then {After one minute }
15: MergeList({L }) {Select best models}
16:
end if
17: end for
18: end for
candidates. The similarity values are evaluated using Equation 3.4 and the probability
of perception using Equation 3.5:
p
(i, j) =
M(i, j)
N
∑
k=1
M(k, j)
(3.4)
M
(i, j) =
P
∑
l=1
E(i, j, l) (3.5)
where N indicates the achieved candidate models, i is the sampled entity, j is the
compared landmark model, M
(i, j) is the landmark similarity measure obtained from
matching an entity’s descriptors and assigning a probability of perception as described
in Equation 3.6, P is the total descriptors, l is a landmark descriptor and E
(i, j, l) is the
Euclidian distance of each landmark model compared, estimated using Equation 3.7:
N
∑
k=1
M(k, j) = 1 (3.6)
E
(i, j, l) =
L
l
∑
m=1
(i
m
−l
m
)
2
σ
2
m
(3.7)
where L
l
refers to all possible operators from the current landmark model, σ
m
is the
standard deviation for each sampled entity i
m
in a sample set and l is a landmark de-
scriptor value.
3. Localisation Methods
Robot localisation is an environment analysis task determined by an internal state obtained
from robot-environment interaction combined with any sensed observations. The traditional
state assumption relies on the robot’s influence over its world and on the robot’s perception
of its environment.
Both steps are logically divided into independent processes which use a state transition for
integrating data into a predictive and updating state. Therefore, the implemented localisation
methods contain measurement and control phases as part of state integration and a robot
pose conformed through a Bayesian approach. On the one hand, the control phase is assigned
to robot odometry which translates its motion into lateral, linear and rotational velocities. On
the other hand, the measurement phase integrates robot sensed information by visual features.
The following sections describe particular phase characteristics for each localisation approach.
3.1 Fuzzy Markov Method
As it is shown in the FM grid-based method of (Buschka et al., 2000) and (Herrero-Pérez et al.,
2004), a grid G
t
contains a number of cells for each grid element G
t
(x, y) for holding a proba-
bility value for a possible robot position in a range of
[0, 1]. The fuzzy cell (fcell) is represented
as a fuzzy trapezoid (Figure 3) defined by a tuple
< θ, ∆, α, h, b >, where θ is robot orientation
at the trapezoid centre with values in a range of
[0, 2π]; ∆ is uncertainty in a robot orientation
θ; h corresponds to fuzzy cell (fcell) with a range of
[0, 1]; α is a slope in the trapezoid, and b is
a correcting bias.
Fig. 3. Graphic representation of robot pose in an f u zzy cell
Since a Bayesian filtering technique is implemented, localisation process works in predict-
observe-update phases for estimating robot state. In particular, the Predict step adjusts to
motion information from robot movements. Then, the Observe step gathers sensed infor-
mation. Finally, the Update step incorporates results from the Predict and Observe steps for
obtaining a new estimation of a fuzzy grid-map. The process sequence is described as follows:
1. Predict step. During this step, robot movements along grid-cells are represented by a
distribution which is continuously blurred. As described in previous work in (Herrero-
Pérez et al., 2004), the blurring is based on odometry information reducing grid occu-
pancy for robot movements as shown in Figure 4(c)). Thus, the grid state G
t
is obtained
by performing a translation and rotation of G
t−1
state distribution according to motion
u. Subsequently, this odometry-based blurring, B
t
, is uniformly calculated for including
uncertainty in a motion state.
RobotLocalizationandMapBuilding8
Thus, state transition probability includes as part of robot control, the blurring from
odometry values as it is described in the following equation:
G
t
= f (G
t
| G
t−1
,
u) ⊗ B
t
(4.30)
2. Observe step. In this step, each observed landmark i is represented as a vector
z
i
, which
includes both range and bearing information obtained from visual perception. For each
observed landmark
z
i
, a grid-map S
i,t
is built such that S
i,t
(x, y, θ|
z
i
) is matched to a
robot position at
(x, y, θ) given an observation
r at time t.
3. Update step. At this step, grid state G
t
obtained from the prediction step is merged with
each observation step S
t,i
. Afterwards, a fuzzy intersection is obtained using a product
operator as follows:
G
t
= f (z
t
| G
t
) (4.31)
G
t
= G
t
×S
t,1
×S
t,2
×···×S
t,n
(4.32)
(a)
(b) (c)
(d) (e) (f)
Fig. 4. In this figure is shown a simulated localisation process of FM grid starting from ab-
solute uncertainty of robot pose (a) and some initial uncertainty (b) and (c). Through to an
approximated (d) and finally to an acceptable robot pose estimation obtained from simulated
environment explained in (Samperio & Hu, 2008).
A simulated example of this process is shown in Figure 4. In this set of Figures, Figure 4(a)
illustrates how the system is initialised with absolute uncertainty of robot pose as the white
areas. Thereafter, the robot incorporates landmark and goal information where each grid state
G
t
is updated whenever an observation can be successfully matched to a robot position, as
illustrated in Figure 4(b). Subsequently, movements and observations of various landmarks
enable the robot to localise itself, as shown from Figure 4(c) to Figure 4(f).
This method’s performance is evaluated in terms of accuracy and computational cost during a
real time robot execution. Thus, a reasonable fcell size of 20 cm
2
is addressed for less accuracy
and computing cost in a pitch space of 500cmx400cm.
This localisation method offers the following advantages, according to (Herrero-Pérez et al.,
2004):
• Fast recovery from previous errors in the robot pose estimation and kidnappings.
• Multi-hypotheses for robot pose
(x, y) .
• It is much faster than classical Markovian approaches.
However, its disadvantages are:
• Mono-hypothesis for orientation estimation.
• It is very sensitive to sensor errors.
• The presence of false positives makes the method unstable in noisy conditions.
• Computational time can increase dramatically.
3.2 Extended Kalman Filter method
Techniques related to EKF have become one of the most popular tools for state estimation in
robotics. This approach makes use of a state vector for robot positioning which is related to
environment perception and robot odometry. For instance, robot position is adapted using a
vector s
t
which contains (x, y) as robot position and θ as orientation.
s
=
x
robot
y
robot
θ
robot
(4.17)
As a Bayesian filtering method, EKF is implemented Predict and Update steps, described in
detail below:
1. Prediction step. This phase requires of an initial state or previous states and robot odometry
information as control data for predicting a state vector. Therefore, the current robot state
s
−
t
is affected by odometry measures, including a noise approximation for error and control
estimations P
−
t
. Initially, robot control probability is represented by using:
s
−
t
= f (s
t−1
, u
t−1
, w
t
) (4.18)
where the nonlinear function f relates the previous state s
t−1
, control input u
t−1
and the pro-
cess noise w
t
.
Afterwards, a covariance matrix P
−
t
is used for representing errors in state estimation obtained
from the previous step’s covariance matrix P
t−1
and defined process noise. For that reason,
the covariance matrix is related to the robot’s previous state and the transformed control data,
as described in the next equation:
P
−
t
= A
t
P
t−1
A
T
t
+ W
t
Q
t−1
W
T
t
(4.19)
VisualLocalisationofquadrupedwalkingrobots 9
Thus, state transition probability includes as part of robot control, the blurring from
odometry values as it is described in the following equation:
G
t
= f (G
t
| G
t−1
,
u) ⊗ B
t
(4.30)
2. Observe step. In this step, each observed landmark i is represented as a vector
z
i
, which
includes both range and bearing information obtained from visual perception. For each
observed landmark
z
i
, a grid-map S
i,t
is built such that S
i,t
(x, y, θ|
z
i
) is matched to a
robot position at
(x, y, θ) given an observation
r at time t.
3. Update step. At this step, grid state G
t
obtained from the prediction step is merged with
each observation step S
t,i
. Afterwards, a fuzzy intersection is obtained using a product
operator as follows:
G
t
= f (z
t
| G
t
) (4.31)
G
t
= G
t
×S
t,1
×S
t,2
×···×S
t,n
(4.32)
(a) (b) (c)
(d) (e) (f)
Fig. 4. In this figure is shown a simulated localisation process of FM grid starting from ab-
solute uncertainty of robot pose (a) and some initial uncertainty (b) and (c). Through to an
approximated (d) and finally to an acceptable robot pose estimation obtained from simulated
environment explained in (Samperio & Hu, 2008).
A simulated example of this process is shown in Figure 4. In this set of Figures, Figure 4(a)
illustrates how the system is initialised with absolute uncertainty of robot pose as the white
areas. Thereafter, the robot incorporates landmark and goal information where each grid state
G
t
is updated whenever an observation can be successfully matched to a robot position, as
illustrated in Figure 4(b). Subsequently, movements and observations of various landmarks
enable the robot to localise itself, as shown from Figure 4(c) to Figure 4(f).
This method’s performance is evaluated in terms of accuracy and computational cost during a
real time robot execution. Thus, a reasonable fcell size of 20 cm
2
is addressed for less accuracy
and computing cost in a pitch space of 500cmx400cm.
This localisation method offers the following advantages, according to (Herrero-Pérez et al.,
2004):
• Fast recovery from previous errors in the robot pose estimation and kidnappings.
• Multi-hypotheses for robot pose
(x, y) .
• It is much faster than classical Markovian approaches.
However, its disadvantages are:
• Mono-hypothesis for orientation estimation.
• It is very sensitive to sensor errors.
• The presence of false positives makes the method unstable in noisy conditions.
• Computational time can increase dramatically.
3.2 Extended Kalman Filter method
Techniques related to EKF have become one of the most popular tools for state estimation in
robotics. This approach makes use of a state vector for robot positioning which is related to
environment perception and robot odometry. For instance, robot position is adapted using a
vector s
t
which contains (x, y) as robot position and θ as orientation.
s
=
x
robot
y
robot
θ
robot
(4.17)
As a Bayesian filtering method, EKF is implemented Predict and Update steps, described in
detail below:
1. Prediction step. This phase requires of an initial state or previous states and robot odometry
information as control data for predicting a state vector. Therefore, the current robot state
s
−
t
is affected by odometry measures, including a noise approximation for error and control
estimations P
−
t
. Initially, robot control probability is represented by using:
s
−
t
= f (s
t−1
, u
t−1
, w
t
) (4.18)
where the nonlinear function f relates the previous state s
t−1
, control input u
t−1
and the pro-
cess noise w
t
.
Afterwards, a covariance matrix P
−
t
is used for representing errors in state estimation obtained
from the previous step’s covariance matrix P
t−1
and defined process noise. For that reason,
the covariance matrix is related to the robot’s previous state and the transformed control data,
as described in the next equation:
P
−
t
= A
t
P
t−1
A
T
t
+ W
t
Q
t−1
W
T
t
(4.19)
RobotLocalizationandMapBuilding10
where A
t
P
t−1
A
T
t
is a progression of P
t−1
along a new movement and A
t
is defined as follows:
A
t
= f s =
1 0
−u
lat
t
cosθ
t
−u
lin
t
sen θ
t−1
0 1 u
lin
t
cosθ
t
−u
lat
t
sen θ
t−1
0 0 1
(4.19)
and W
t
Q
t−1
W
T
t
represents odometry noise, W
t
is Jacobian motion state approximation and Q
t
is a covariance matrix as follows:
Q
t
= E[w
t
w
T
t
] (4.20)
The Sony AIBO robot may not be able to obtain a landmark observation at each localisation
step but it is constantly executing a motion movement. Therefore, it is assumed that frequency
of odometry calculation is higher than visually sensed measurements. For this reason, con-
trol steps are executed independently from measurement states (Kiriy & Buehler, 2002) and
covariance matrix actualisation is presented as follows:
s
t
= s
−
t
(4.21)
P
t
= P
−
t
(4.22)
2. Updating step. During this phase, sensed data and noise covariance P
t
are used for obtain-
ing a new state vector. The sensor model is also updated using measured landmarks m
1···6,(x,y)
as environmental descriptive data. Thus, each z
i
t
of the i landmarks is measured as distance
and angle with a vector
(r
i
t
, φ
i
t
). In order to obtain an updated state, the next equation is used:
s
t
= s
t−1
+ K
i
t
(z
i
t
−
ˆ
z
i
t
) = s
t−1
+ K
i
t
(z
i
t
−h
i
(s
t−1
)) (4.23)
where h
i
(s
t−1
) is a predicted measurement calculated from the following non-linear functions:
ˆ
z
i
t
= h
i
(s
t−1
) =
(m
i
t, x
−s
t−1,x
)
2
+ (m
i
t,y
−s
t−1,y
)
atan
2
(m
i
t, x
−s
t−1,x
, m
i
t,y
−s
t−1,y
) −s
t−1,θ
(4.24)
Then, the Kalman gain, K
i
t
, is obtained from the next equation:
K
i
t
= P
t−1
(H
i
t
)
T
(S
i
t
)
−1
(4.25)
where S
i
t
is the uncertainty for each predicted measurement
ˆ
z
i
t
and is calculated as follows:
S
i
t
= H
i
t
P
t−1
(H
i
t
)
T
+ R
i
t
(4.26)
Then H
i
t
describes changes in the robot position as follows:
H
i
t
= h
i
(s
t−1
)s
t
=
−
m
i
t,x
−s
t−1,x
(m
i
t,x
−s
t−1,x
)
2
+(m
i
t,y
−s
t−1,y
)
2
−
m
i
t,y
−s
t−1, y
(m
i
t,x
−s
t−1,x
)
2
+(m
i
t,y
−s
t−1, y
)
2
0
m
i
t,y
−s
t−1,y
(m
i
t,x
−s
t−1,x
)
2
+(m
i
t,y
−s
t−1, y
)
2
−
m
i
t,x
−s
t−1,x
(m
i
t,x
−s
t−1,x
)
2
+(m
i
t,y
−s
t−1,y
)
2
−1
0 0 0
(4.27)
where R
i
t
represents the measurement noise which was empirically obtained and P
t
is calcu-
lated using the following equation:
P
t
= (I − K
i
t
H
i
t
)P
t−1
(4.28)
Finally, as not all
ˆ
z
i
t
values are obtained at every observation, z
i
t
values are evaluated for each
observation and δ
i
t
is a confidence measurement obtained from Equation (4.29). The confi-
dence observation measurement has a threshold value between 5 and 100, which varies ac-
cording to localisation quality.
δ
i
t
= (z
i
t
−
ˆ
z
i
t
)
T
(S
i
t
)
−1
(z
i
t
−
ˆ
z
i
t
) (4.29)
3.3 FM-EKF method
Merging the FM and EKF algorithms is proposed in order to achieve computational efficiency,
robustness and reliability for a novel robot localisation method. In particular, the FM-EKF
method deals with inaccurate perception and odometry data for combining method hypothe-
ses in order to obtain the most reliable position from both approaches.
The hybrid procedure is fully described in Algorithm 2, in which the fcell grid size is (50-100
cm) which is considerably wider than FM’s. Also the fcell is initialised in the space map centre.
Subsequently, a variable is iterated for controlling FM results and it is used for comparing
robot EKF positioning quality. The localisation quality indicates if EKF needs to be reset in the
case where the robot is lost or the EKF position is out of FM range.
Algorithm 2 Description of the FM-EKF algorithm.
Require: position
FM
over all pitch
Require: position
EKF
over all pitch
1: while robotLocalise do
2: {Execute”Predict”phases f orFMandEKF}
3: Predict position
FM
using motion model
4: Predict position
EKF
using motion model
5: {Execute”Correct”phases f orFMandEKF}
6: Correct position
FM
using perception model
7: Correct position
EKF
using perception model
8: {Checkqualityo f localisation f orEKFusingFM}
9: if (quality(position
FM
) quality(position
EKF
) then
10: Initialise position
EKF
to position
FM
11: else
12: robot position ← position
EKF
13: end if
14: end while
The FM-EKF algorithm follows the predict-observe-update scheme as part of a Bayesian ap-
proach. The input data for the algorithm requires similar motion and perception data. Thus,
the hybrid characteristics maintain a combined hypothesis of robot pose estimation using data
that is independently obtained. Conversely, this can adapt identical measurement and control
information for generating two different pose estimations where, under controlled circum-
stances one depends on the other.
From one viewpoint, FM localisation is a robust solution for noisy conditions. However, it
is also computationally expensive and cannot operate efficiently in real-time environments
VisualLocalisationofquadrupedwalkingrobots 11
where A
t
P
t−1
A
T
t
is a progression of P
t−1
along a new movement and A
t
is defined as follows:
A
t
= f s =
1 0
−u
lat
t
cosθ
t
−u
lin
t
sen θ
t−1
0 1 u
lin
t
cosθ
t
−u
lat
t
sen θ
t−1
0 0 1
(4.19)
and W
t
Q
t−1
W
T
t
represents odometry noise, W
t
is Jacobian motion state approximation and Q
t
is a covariance matrix as follows:
Q
t
= E[w
t
w
T
t
] (4.20)
The Sony AIBO robot may not be able to obtain a landmark observation at each localisation
step but it is constantly executing a motion movement. Therefore, it is assumed that frequency
of odometry calculation is higher than visually sensed measurements. For this reason, con-
trol steps are executed independently from measurement states (Kiriy & Buehler, 2002) and
covariance matrix actualisation is presented as follows:
s
t
= s
−
t
(4.21)
P
t
= P
−
t
(4.22)
2. Updating step. During this phase, sensed data and noise covariance P
t
are used for obtain-
ing a new state vector. The sensor model is also updated using measured landmarks m
1···6,(x,y)
as environmental descriptive data. Thus, each z
i
t
of the i landmarks is measured as distance
and angle with a vector
(r
i
t
, φ
i
t
). In order to obtain an updated state, the next equation is used:
s
t
= s
t−1
+ K
i
t
(z
i
t
−
ˆ
z
i
t
) = s
t−1
+ K
i
t
(z
i
t
−h
i
(s
t−1
)) (4.23)
where h
i
(s
t−1
) is a predicted measurement calculated from the following non-linear functions:
ˆ
z
i
t
= h
i
(s
t−1
) =
(m
i
t, x
−s
t−1,x
)
2
+ (m
i
t,y
−s
t−1,y
)
atan
2
(m
i
t, x
−s
t−1,x
, m
i
t,y
−s
t−1,y
) −s
t−1,θ
(4.24)
Then, the Kalman gain, K
i
t
, is obtained from the next equation:
K
i
t
= P
t−1
(H
i
t
)
T
(S
i
t
)
−1
(4.25)
where S
i
t
is the uncertainty for each predicted measurement
ˆ
z
i
t
and is calculated as follows:
S
i
t
= H
i
t
P
t−1
(H
i
t
)
T
+ R
i
t
(4.26)
Then H
i
t
describes changes in the robot position as follows:
H
i
t
= h
i
(s
t−1
)s
t
=
−
m
i
t,x
−s
t−1,x
(m
i
t,x
−s
t−1,x
)
2
+(m
i
t,y
−s
t−1,y
)
2
−
m
i
t,y
−s
t−1, y
(m
i
t,x
−s
t−1,x
)
2
+(m
i
t,y
−s
t−1, y
)
2
0
m
i
t,y
−s
t−1,y
(m
i
t,x
−s
t−1,x
)
2
+(m
i
t,y
−s
t−1, y
)
2
−
m
i
t,x
−s
t−1,x
(m
i
t,x
−s
t−1,x
)
2
+(m
i
t,y
−s
t−1,y
)
2
−1
0 0 0
(4.27)
where R
i
t
represents the measurement noise which was empirically obtained and P
t
is calcu-
lated using the following equation:
P
t
= (I − K
i
t
H
i
t
)P
t−1
(4.28)
Finally, as not all
ˆ
z
i
t
values are obtained at every observation, z
i
t
values are evaluated for each
observation and δ
i
t
is a confidence measurement obtained from Equation (4.29). The confi-
dence observation measurement has a threshold value between 5 and 100, which varies ac-
cording to localisation quality.
δ
i
t
= (z
i
t
−
ˆ
z
i
t
)
T
(S
i
t
)
−1
(z
i
t
−
ˆ
z
i
t
) (4.29)
3.3 FM-EKF method
Merging the FM and EKF algorithms is proposed in order to achieve computational efficiency,
robustness and reliability for a novel robot localisation method. In particular, the FM-EKF
method deals with inaccurate perception and odometry data for combining method hypothe-
ses in order to obtain the most reliable position from both approaches.
The hybrid procedure is fully described in Algorithm 2, in which the fcell grid size is (50-100
cm) which is considerably wider than FM’s. Also the fcell is initialised in the space map centre.
Subsequently, a variable is iterated for controlling FM results and it is used for comparing
robot EKF positioning quality. The localisation quality indicates if EKF needs to be reset in the
case where the robot is lost or the EKF position is out of FM range.
Algorithm 2 Description of the FM-EKF algorithm.
Require: position
FM
over all pitch
Require: position
EKF
over all pitch
1: while robotLocalise do
2: {Execute”Predict”phases f orFMandEKF}
3: Predict position
FM
using motion model
4: Predict position
EKF
using motion model
5: {Execute”Correct”phases f orFMandEKF}
6: Correct position
FM
using perception model
7: Correct position
EKF
using perception model
8: {Checkqualityo f localisation f orEKFusingFM}
9: if (quality(position
FM
) quality(position
EKF
) then
10: Initialise position
EKF
to position
FM
11: else
12: robot position ← position
EKF
13: end if
14: end while
The FM-EKF algorithm follows the predict-observe-update scheme as part of a Bayesian ap-
proach. The input data for the algorithm requires similar motion and perception data. Thus,
the hybrid characteristics maintain a combined hypothesis of robot pose estimation using data
that is independently obtained. Conversely, this can adapt identical measurement and control
information for generating two different pose estimations where, under controlled circum-
stances one depends on the other.
From one viewpoint, FM localisation is a robust solution for noisy conditions. However, it
is also computationally expensive and cannot operate efficiently in real-time environments
RobotLocalizationandMapBuilding12
with a high resolution map. Therefore, its computational accuracy is inversely proportional
to the fcell size. From a different perspective, EKF is an efficient and accurate positioning
system which can converge computationally faster than FM. The main drawback of EKF is a
misrepresentation in the multimodal positioning information and method initialisation.
Fig. 5. Flux diagram of hybrid localisation process.
The hybrid method combines FM grid accuracy with EKF tracking efficiency. As it is shown
in Figure 5, both methods use the same control and measurement information for obtaining
a robot pose and positioning quality indicators. The EKF quality value is originated from the
eigenvalues of the error covariance matrix and from noise in the grid- map.
As a result, EKF localisation is compared with FM quality value for obtaining a robot pose
estimation. The EKF position is updated whenever the robot position is lost or it needs to be
initialised. The FM method runs considerably faster though it is less accurate.
This method implements a Bayesian approach for robot-environment interaction in a locali-
sation algorithm for obtaining robot position and orientation information. In this method a
wider fcell size is used for the FM grid-map implementation and EKF tracking capabilities are
developed to reduce computational time.
4. System Overview
The configuration of the proposed HRI is presented in Figure 6. The user-robot interface man-
ages robot localisation information, user commands from a GUI and the overhead tracking,
known as the VICON tracking system for tracking robot pose and position. This overhead
tracking system transmits robot heading and position data in real time to a GUI where the
information is formatted and presented to the user.
The system also includes a robot localisation as a subsystem composed of visual perception,
motion and behaviour planning modules which continuously emits robot positioning infor-
mation. In this particular case, localisation output is obtained independently of robot be-
haviour moreover they share same processing resources. Additionally, robot-visual informa-
tion can be generated online from GUI from characterising environmental landmarks into
robot configuration.
Thus, the user can manage and control the experimental execution using online GUI tasks.
The GUI tasks are for designing and controlling robot behaviour and localisation methods,
Fig. 6. Complete configuration of used human-robot interface.
and for managing simulated and experimental results. Moreover, tracking results are the ex-
periments’ input and output of a grand truth that is evaluating robot self-localisation results.
5. Experimental Results
The presented experimental results contain the analysis of the undefined landmark models
and a comparison of implemented localisation methods. The undefined landmark modelling
is designed for detecting environment features that could support the quality of the locali-
sation methods. All localisation methods make use of defined landmarks as main source of
information.
The first set of experiments describe the feasibility for employing a not defined landmark as a
source for localisation. These experiments measure the robot ability to define a new landmark
in an indoor but dynamic environment. The second set of experiments compare the quality
of localisation for the FM, EKF and FM-EKF independently from a random robot behaviour
and environment interaction. Such experiments characterise particular situations when each
of the methods exhibits an acceptable performance in the proposed system.
5.1 Dynamic landmark acquisition
The performance for angle and distance is evaluated in three experiments. For the first and
second experiments, the robot is placed in a fixed position on the football pitch where it con-
tinuously pans its head. Thus, the robot maintains simultaneously a perception process and
a dynamic landmark creation. Figure 7 show the positions of 1683 and 1173 dynamic models
created for the first and second experiments over a duration of five minutes.
Initially, newly acquired landmarks are located at 500 mm and with an angle of 3Π/4rad from
the robot’s centre. Results are presented in Table ??. The tables for Experiments 1 and 2,
illustrate the mean (
˜
x) and standard deviation (σ) of each entity’s distance, angle and errors
from the robot’s perspective.
In the third experiment, landmark models are tested during a continuous robot movement.
This experiment consists of obtaining results at the time the robot is moving along a circular
VisualLocalisationofquadrupedwalkingrobots 13
with a high resolution map. Therefore, its computational accuracy is inversely proportional
to the fcell size. From a different perspective, EKF is an efficient and accurate positioning
system which can converge computationally faster than FM. The main drawback of EKF is a
misrepresentation in the multimodal positioning information and method initialisation.
Fig. 5. Flux diagram of hybrid localisation process.
The hybrid method combines FM grid accuracy with EKF tracking efficiency. As it is shown
in Figure 5, both methods use the same control and measurement information for obtaining
a robot pose and positioning quality indicators. The EKF quality value is originated from the
eigenvalues of the error covariance matrix and from noise in the grid- map.
As a result, EKF localisation is compared with FM quality value for obtaining a robot pose
estimation. The EKF position is updated whenever the robot position is lost or it needs to be
initialised. The FM method runs considerably faster though it is less accurate.
This method implements a Bayesian approach for robot-environment interaction in a locali-
sation algorithm for obtaining robot position and orientation information. In this method a
wider fcell size is used for the FM grid-map implementation and EKF tracking capabilities are
developed to reduce computational time.
4. System Overview
The configuration of the proposed HRI is presented in Figure 6. The user-robot interface man-
ages robot localisation information, user commands from a GUI and the overhead tracking,
known as the VICON tracking system for tracking robot pose and position. This overhead
tracking system transmits robot heading and position data in real time to a GUI where the
information is formatted and presented to the user.
The system also includes a robot localisation as a subsystem composed of visual perception,
motion and behaviour planning modules which continuously emits robot positioning infor-
mation. In this particular case, localisation output is obtained independently of robot be-
haviour moreover they share same processing resources. Additionally, robot-visual informa-
tion can be generated online from GUI from characterising environmental landmarks into
robot configuration.
Thus, the user can manage and control the experimental execution using online GUI tasks.
The GUI tasks are for designing and controlling robot behaviour and localisation methods,
Fig. 6. Complete configuration of used human-robot interface.
and for managing simulated and experimental results. Moreover, tracking results are the ex-
periments’ input and output of a grand truth that is evaluating robot self-localisation results.
5. Experimental Results
The presented experimental results contain the analysis of the undefined landmark models
and a comparison of implemented localisation methods. The undefined landmark modelling
is designed for detecting environment features that could support the quality of the locali-
sation methods. All localisation methods make use of defined landmarks as main source of
information.
The first set of experiments describe the feasibility for employing a not defined landmark as a
source for localisation. These experiments measure the robot ability to define a new landmark
in an indoor but dynamic environment. The second set of experiments compare the quality
of localisation for the FM, EKF and FM-EKF independently from a random robot behaviour
and environment interaction. Such experiments characterise particular situations when each
of the methods exhibits an acceptable performance in the proposed system.
5.1 Dynamic landmark acquisition
The performance for angle and distance is evaluated in three experiments. For the first and
second experiments, the robot is placed in a fixed position on the football pitch where it con-
tinuously pans its head. Thus, the robot maintains simultaneously a perception process and
a dynamic landmark creation. Figure 7 show the positions of 1683 and 1173 dynamic models
created for the first and second experiments over a duration of five minutes.
Initially, newly acquired landmarks are located at 500 mm and with an angle of 3Π/4rad from
the robot’s centre. Results are presented in Table ??. The tables for Experiments 1 and 2,
illustrate the mean (
˜
x) and standard deviation (σ) of each entity’s distance, angle and errors
from the robot’s perspective.
In the third experiment, landmark models are tested during a continuous robot movement.
This experiment consists of obtaining results at the time the robot is moving along a circular
RobotLocalizationandMapBuilding14
Fig. 7. Landmark model recognition for Experiments 1, 2 and 3
Experpiment 1 Distance Angle Error in Distance Error in Angle
Mean 489.02 146.89 256.46 2.37
StdDev 293.14 9.33 133.44 8.91
Experpiment 2 Distance Angle Error in Distance Error in Angle
Mean 394.02 48.63 86.91 2.35
StdDev 117.32 2.91 73.58 1.71
Experpiment 3 Distance Angle Error in Distance Error in Angle
Mean 305.67 12.67 90.30 3.61
StdDev 105.79 4.53 54.37 2.73
Table 2. Mean and standard deviation for experiment 1, 2 and 3.
trajectory with 20 cm of bandwidth radio, and whilst the robot’s head is continuously panning.
The robot is initially positioned 500 mm away from a coloured beacon situated at 0 degrees
from the robot’s mass centre. The robot is also located in between three defined and one
undefined landmarks. Results obtained from dynamic landmark modelling are illustrated in
Figure 7. All images illustrate the generated landmark models during experimental execution.
Also it is shown darker marks on all graphs represent an accumulated average of an observed
landmark model.
This experiment required 903 successful landmark models detected over five minute duration
of continuous robot movement and the results are presented in the last part of the table for
Experiment 3. The results show magnitudes for mean (
˜
x) and standard deviation (σ), distance,
angle and errors from the robot perspective.
Each of the images illustrates landmark models generated during experimental execution,
represented as the accumulated average of all observed models. In particular for the first
two experiments, the robot is able to offer an acceptable angular error estimation in spite of
a variable proximity range. The results for angular and distance errors are similar for each
experiment. However, landmark modelling performance is susceptible to perception errors
and obvious proximity difference from the perceived to the sensed object.
The average entity of all models presents a minimal angular error in a real-time visual pro-
cess. An evaluation of the experiments is presented in Box and Whisker graphs for error on
position, distance and angle in Figure 8.
Therefore, the angle error is the only acceptable value in comparison with distance or po-
sitioning performance. Also, the third experiment shows a more comprehensive real-time
measuring with a lower amount of defined landmark models and a more controllable error
performance.
5.2 Comparison of localisation methods
The experiments were carried out in three stages of work: (i) simple movements; (ii) com-
bined behaviours; and (iii) kidnapped robot. Each experiment set is to show robot positioning
abilities in a RoboCup environment. The total set of experiment updates are of 15, with 14123
updates in total. In each experimental set, the robot poses estimated by EKF, FM and FM-EKF
localisation methods are compared with the ground truth generated by the overhead vision
system. In addition, each experiment set is compared respectively within its processing time.
Experimental sets are described below:
VisualLocalisationofquadrupedwalkingrobots 15
Fig. 7. Landmark model recognition for Experiments 1, 2 and 3
Experpiment 1 Distance Angle Error in Distance Error in Angle
Mean 489.02 146.89 256.46 2.37
StdDev 293.14 9.33 133.44 8.91
Experpiment 2 Distance Angle Error in Distance Error in Angle
Mean 394.02 48.63 86.91 2.35
StdDev 117.32 2.91 73.58 1.71
Experpiment 3 Distance Angle Error in Distance Error in Angle
Mean 305.67 12.67 90.30 3.61
StdDev 105.79 4.53 54.37 2.73
Table 2. Mean and standard deviation for experiment 1, 2 and 3.
trajectory with 20 cm of bandwidth radio, and whilst the robot’s head is continuously panning.
The robot is initially positioned 500 mm away from a coloured beacon situated at 0 degrees
from the robot’s mass centre. The robot is also located in between three defined and one
undefined landmarks. Results obtained from dynamic landmark modelling are illustrated in
Figure 7. All images illustrate the generated landmark models during experimental execution.
Also it is shown darker marks on all graphs represent an accumulated average of an observed
landmark model.
This experiment required 903 successful landmark models detected over five minute duration
of continuous robot movement and the results are presented in the last part of the table for
Experiment 3. The results show magnitudes for mean (
˜
x) and standard deviation (σ), distance,
angle and errors from the robot perspective.
Each of the images illustrates landmark models generated during experimental execution,
represented as the accumulated average of all observed models. In particular for the first
two experiments, the robot is able to offer an acceptable angular error estimation in spite of
a variable proximity range. The results for angular and distance errors are similar for each
experiment. However, landmark modelling performance is susceptible to perception errors
and obvious proximity difference from the perceived to the sensed object.
The average entity of all models presents a minimal angular error in a real-time visual pro-
cess. An evaluation of the experiments is presented in Box and Whisker graphs for error on
position, distance and angle in Figure 8.
Therefore, the angle error is the only acceptable value in comparison with distance or po-
sitioning performance. Also, the third experiment shows a more comprehensive real-time
measuring with a lower amount of defined landmark models and a more controllable error
performance.
5.2 Comparison of localisation methods
The experiments were carried out in three stages of work: (i) simple movements; (ii) com-
bined behaviours; and (iii) kidnapped robot. Each experiment set is to show robot positioning
abilities in a RoboCup environment. The total set of experiment updates are of 15, with 14123
updates in total. In each experimental set, the robot poses estimated by EKF, FM and FM-EKF
localisation methods are compared with the ground truth generated by the overhead vision
system. In addition, each experiment set is compared respectively within its processing time.
Experimental sets are described below:
RobotLocalizationandMapBuilding16
Fig. 8. Error in angle for Experiments 1, 2 and 3.
1. Simple Movements. This stage includes straight and circular robot trajectories in for-
ward and backward directions within the pitch.
2. Combined Behaviour. This stage is composed by a pair of high level behaviours. Our
first experiment consists of reaching a predefined group of coordinated points along
the pitch. Then, the second experiment is about playing alone and with another dog to
obtain localisation results during a long period.
3. Kidnapped Robot. This stage is realised randomly in sequences of kidnap time and
pose. For each kidnap session the objective is to obtain information about where the
robot is and how fast it can localise again.
All experiments in a playing session with an active localisation are measured by showing the
type of environment in which each experiment is conducted and how they directly affect robot
behaviour and localisation results. In particular, the robot is affected by robot displacement,
experimental time of execution and quantity of localisation cycles. These characteristics are
described as follows and it is shown in Table 3:
1. Robot Displacement is the accumulated distance measured from each simulated
method step from the perspective of the grand truth mobility.
2. Localisation Cycles include any completed iteration from update-observe-predict
stages for any localisation method.
3. Time of execution refers to total amount of time taken for each experiment with a time
of 1341.38 s for all the experiments.
Exp. 1 Exp. 2 Exp. 3
Displacement (mm) 15142.26 5655.82 11228.42
Time of Execution (s) 210.90 29.14 85.01
Localisation Cycles (iterations) 248 67 103
Table 3. Experimental conditions for a simulated environment.
The experimental output depends on robot behaviour and environment conditions for obtain-
ing parameters of performance. On the one side, robot behaviour is embodied by the specific
robot tasks executed such as localise, kick the ball, search for the ball, search for landmarks, search for
players, move to a point in the pitch, start, stop, finish, and so on. On the other side, robot control
characteristics describe robot performance on the basis of values such as: robot displacement,
time of execution, localisation cycles and landmark visibility. Specifically, robot performance crite-
ria are described for the following environment conditions:
1. Robot Displacement is the distance covered by the robot for a complete experiment,
obtained from grand truth movement tracking. The total displacement from all experi-
ments is 146647.75 mm.
2. Landmark Visibility is the frequency of the detected true positives for each landmark
model among all perceived models. Moreover, the visibility ranges are related per each
localisation cycle for all natural and artificial landmarks models. The average landmark
visibility obtained from all the experiments is in the order of 26.10 % landmarks per total
of localisation cycles.
3. Time of Execution is the time required to perform each experiment. The total time of
execution for all the experiments is 902.70 s.
4. Localisation Cycles is a complete execution of a correct and update steps through the
localisation module. The amount of tries for these experiments are 7813 cycles.
The internal robot conditions is shown in Table ??:
Exp 1 Exp 2 Exp 3
Displacement (mm) 5770.72 62055.79 78821.23
Landmark Visibility (true positives/total obs) 0.2265 0.3628 0.2937
Time of Execution (s) 38.67 270.36 593.66
Localisation Cycles (iterations) 371 2565 4877
Table 4. Experimental conditions for a real-time environment.
In Experiment 1, the robot follows a trajectory in order to localise and generate a set of visi-
ble ground truth points along the pitch. In Figures 9 and 10 are presented the error in X and
Y axis by comparing the EKF, FM, FM-EKF methods with a grand truth. In this graphs it is
shown a similar performance between the methods EKF and FM-EKF for the error in X and Y
VisualLocalisationofquadrupedwalkingrobots 17
Fig. 8. Error in angle for Experiments 1, 2 and 3.
1. Simple Movements. This stage includes straight and circular robot trajectories in for-
ward and backward directions within the pitch.
2. Combined Behaviour. This stage is composed by a pair of high level behaviours. Our
first experiment consists of reaching a predefined group of coordinated points along
the pitch. Then, the second experiment is about playing alone and with another dog to
obtain localisation results during a long period.
3. Kidnapped Robot. This stage is realised randomly in sequences of kidnap time and
pose. For each kidnap session the objective is to obtain information about where the
robot is and how fast it can localise again.
All experiments in a playing session with an active localisation are measured by showing the
type of environment in which each experiment is conducted and how they directly affect robot
behaviour and localisation results. In particular, the robot is affected by robot displacement,
experimental time of execution and quantity of localisation cycles. These characteristics are
described as follows and it is shown in Table 3:
1. Robot Displacement is the accumulated distance measured from each simulated
method step from the perspective of the grand truth mobility.
2. Localisation Cycles include any completed iteration from update-observe-predict
stages for any localisation method.
3. Time of execution refers to total amount of time taken for each experiment with a time
of 1341.38 s for all the experiments.
Exp. 1 Exp. 2 Exp. 3
Displacement (mm) 15142.26 5655.82 11228.42
Time of Execution (s) 210.90 29.14 85.01
Localisation Cycles (iterations) 248 67 103
Table 3. Experimental conditions for a simulated environment.
The experimental output depends on robot behaviour and environment conditions for obtain-
ing parameters of performance. On the one side, robot behaviour is embodied by the specific
robot tasks executed such as localise, kick the ball, search for the ball, search for landmarks, search for
players, move to a point in the pitch, start, stop, finish, and so on. On the other side, robot control
characteristics describe robot performance on the basis of values such as: robot displacement,
time of execution, localisation cycles and landmark visibility. Specifically, robot performance crite-
ria are described for the following environment conditions:
1. Robot Displacement is the distance covered by the robot for a complete experiment,
obtained from grand truth movement tracking. The total displacement from all experi-
ments is 146647.75 mm.
2. Landmark Visibility is the frequency of the detected true positives for each landmark
model among all perceived models. Moreover, the visibility ranges are related per each
localisation cycle for all natural and artificial landmarks models. The average landmark
visibility obtained from all the experiments is in the order of 26.10 % landmarks per total
of localisation cycles.
3. Time of Execution is the time required to perform each experiment. The total time of
execution for all the experiments is 902.70 s.
4. Localisation Cycles is a complete execution of a correct and update steps through the
localisation module. The amount of tries for these experiments are 7813 cycles.
The internal robot conditions is shown in Table ??:
Exp 1 Exp 2 Exp 3
Displacement (mm) 5770.72 62055.79 78821.23
Landmark Visibility (true positives/total obs) 0.2265 0.3628 0.2937
Time of Execution (s) 38.67 270.36 593.66
Localisation Cycles (iterations) 371 2565 4877
Table 4. Experimental conditions for a real-time environment.
In Experiment 1, the robot follows a trajectory in order to localise and generate a set of visi-
ble ground truth points along the pitch. In Figures 9 and 10 are presented the error in X and
Y axis by comparing the EKF, FM, FM-EKF methods with a grand truth. In this graphs it is
shown a similar performance between the methods EKF and FM-EKF for the error in X and Y