individual assignment mkt1804
Bạn đang xem bản rút gọn của tài liệu. Xem và tải ngay bản đầy đủ của tài liệu tại đây (1.26 MB, 29 trang )
<span class="text_page_counter">Trang 1</span><div class="page_container" data-page="1">
Coursework Assignment Brief Lecturer: Ms. Ha Nguyen
Digital Marketing Analysis DMA301m Title of Brief: Individual Assignment Due date: 25/02/2024
GROUP 01 Vũ Khánh Linh - HS170162
Đào Thị Thơm - HS173035 Dương Tuấn Minh -
CLASS: MKT1804
</div><span class="text_page_counter">Trang 3</span><div class="page_container" data-page="3">
1. Executive Summary
This analysis delves into FPT University website performance, uncovering insights within January 2024's traffic data to spotlight avenues for strategic enhancements. Despite a marginal drop in traffic, a solid foundation of user engagement positions the website as a prime candidate for optimization initiatives aimed at bolstering its digital presence and engagement metrics.
Core Findings and Strategic Recommendations:
Traffic Analysis: January witnessed a slight 0.26% dip in visits compared to December, settling at 7.63 million, with an average session duration of 15:05 minutes. This slight decrease highlights the need for strategic interventions to reverse the trend and leverage the website's substantial visitor base and engagement levels.
Audience Insights: The primary audience hails from Vietnam, with significant traffic also from the United States and Hong Kong. Mobile usage dominates at 77.62%, underscoring the necessity for mobile-first optimization strategies.
Competitor Benchmarking: Comparison with direct competitors like glints.com, reviewedu.net, and uef.edu.vn reveals potential areas for improvement, particularly in content relevance and user interface design, to reduce bounce rates and enhance user retention.
Strategic Recommendations:
SEO and Content Revitalization: Implement a robust SEO strategy and refresh content to cater to the diverse needs of international students, parents, and potential staff, aiming to increase organic search traffic by 20% within six months.
Mobile Optimization: Prioritize mobile user experience enhancements to address the high mobile usage rate, targeting a 15% reduction in mobile bounce rates.
User Interface Enhancement: Overhaul the user interface based on analytics and user feedback to improve intuitiveness and accessibility, aiming to increase user retention and session durations.
</div><span class="text_page_counter">Trang 4</span><div class="page_container" data-page="4">Engagement and Personalization: Leverage data analytics for deeper insights into user behavior, to craft personalized content and interaction strategies, enhancing user satisfaction and engagement levels.
Marketing Channel Diversification: Broaden reach and engagement through a mix of organic and targeted paid marketing strategies, with a special focus on increasing international student traffic by 30% within six months.
By addressing these strategic areas, FPT University can not only reverse the recent slight downturn in web traffic but also significantly enhance user engagement and conversion rates. This multi-faceted approach aims to solidify FPT University online presence, supporting its enrollment objectives and enhancing its competitive edge in the global education landscape.
<b>2. Website analysis: </b>
2.1. Traffic Analysis January 2024 Traffic Stats
Global traffic ranking index: 13,677 visitsTraffic ranking index in Vietnam: 229 visitsTraffic and Visitor Engagement
1.Website Performance Benchmarking:
Benchmark and compare the performance of a website (fpt.edu.vn) against its competitors.
This involves tracking key indicators related to user behavior on the website.
2.January Metrics for fpt.edu.vn:
In January, fpt.edu.vn received 7.63 million visits.
The average session duration (time spent by users on the website during a single visit) was 15 minutes and 5 seconds (15:05).
3.Comparison with December:
Compared to December, the traffic to fpt.edu.vn has decreased by 0.26%.
In summary, fpt.edu.vn experienced a slight decrease in traffic from December to January, but it still received a substantial number of visits with a decent average
</div><span class="text_page_counter">Trang 5</span><div class="page_container" data-page="5">session duration. Monitoring such metrics helps assess the website’s performance and engagement with visitors.
Website Traffic by Country
See the global distribution of visitors to your competitor’s website and start tapping into overlooked markets. Fpt.edu.vn's core audience is located in Vietnam followed by the United States, and Hong Kong.
Traffic Share by Device
Quickly understand where a website's traffic comes from and what devices visitors prefer to use. On fpt.edu.vn, desktops drive 22.38% of visits, while 77.62% of visitors come from mobile devices.
</div><span class="text_page_counter">Trang 6</span><div class="page_container" data-page="6">Website Traffic Journey
Learn where visitors browse before landing on your competitor’s site and where they go after to find new opportunities for attracting your competition’s audience
On fpt.edu.vn, visitors mainly come from Direct (39.24% of traffic), followed by accounts.google.com (24.53%). In most cases, after visiting fpt.edu.vn, users go to google.com and poly.edu.vn.
Top 4 fpt.edu.vn Alternatives & Competitors
</div><span class="text_page_counter">Trang 7</span><div class="page_container" data-page="7">The closest competitors to fpt.edu.vn are glints.com, reviewedu.net and uef.edu.vn.
3. uef.edu.vn
Global traffic ranking index: 68,325 visitsTraffic ranking index in VietNam: 1,936 visits
</div><span class="text_page_counter">Trang 8</span><div class="page_container" data-page="8">UEF.edu.vn is the website of Ho Chi Minh City University of Economics and Finance4. With 1.11 million visits, a reputation score of 46 and a bounce rate of 47.62%, uef.edu.vn has a relatively high traffic and reputation score. A low bounce rate shows that this website is better able to retain users. This website provides information about training programs, events, and related news.
Based on analyzing competitors, each website has its own advantages and disadvantages. FPT.edu.vn needs to improve and optimize its content to provide more useful information, retain users longer and compete effectively with competitors. At the same time, understanding user behavior and interaction levels on websites is also very important in building and developing business strategies.
More specifically, FPT.edu.vn may need to improve the following aspects:
Course content and quality: Competitors such as Glints.com and Hocmai.vn both have high traffic, which shows that they have attractive
</div><span class="text_page_counter">Trang 9</span><div class="page_container" data-page="9">content and good course quality. FPT.edu.vn needs to ensure that their content is also attractive and quality, meeting the learning needs of users.
User interface: The high bounce rate of Glints.com and Hocmai.vn suggests that the user interface may be unfriendly or difficult to use. FPT.edu.vn needs to ensure that their website is easy to use, user-friendly and attracts users to stay on the website longer.
Search engine optimization (SEO): The reputation scores of ReviewEDU.net and UEF.edu.vn are lower than FPT.edu.vn, this may be because they do not optimize well for search engines. FPT.edu.vn needs to ensure that they have optimized SEO to increase their ability to appear in search results.
Interaction with users: FPT.edu.vn needs to increase interaction with users through activities on the website and social networks. This not only helps strengthen relationships with users but also helps attract new users.
User data analysis: FPT.edu.vn needs to use data analysis tools to understand user behavior, what they are interested in and what they need from the website. This data can help FPT.edu.vn optimize its content and services to better serve users.
Providing diverse services: FPT.edu.vn needs to provide a variety of services and courses to meet the diverse needs of users. This can include online courses, in-person courses, certificate courses, and consulting services.
Improve customer service quality: FPT.edu.vn needs to provide high quality customer service to quickly resolve user problems and questions. This not only helps increase user trust but also helps increase their return rate.
In short, FPT.edu.vn needs to improve many different aspects to compete effectively with competitors and serve users better. It's important that they keep updating and adjusting their strategies based on the market and user needs.
Organic and Paid Website Traffic
Fpt.edu.vn’s traffic has increased by 1.53% month-on-month up to current organic search traffic. In addition, paid search traffic has increased by 55.88% up to current paid search traffic.
</div><span class="text_page_counter">Trang 10</span><div class="page_container" data-page="10">Top Organic Keyword
Backlink Stats
Backlinks and Referring Domains
</div><span class="text_page_counter">Trang 11</span><div class="page_container" data-page="11">In January the number of backlinks to fpt.edu.vn has dropped by -3.41% and equals 2.46M. The amount of referring domains has dropped by -2.39% and equals 10.22K.
Web Traffic to fpt.edu.vn
The top referral sites sending desktop traffic to fpt.edu.vn.
Display Advertising Traffic to fpt.edu.vn
Analysis of the top publishers sending traffic to fpt.edu.vn. Currently, there are 3 publishers referring visitors.
</div><span class="text_page_counter">Trang 12</span><div class="page_container" data-page="12">2.2 Content Analysis:
fpt.edu.vn Technology Stack
These are the website technologies, by industry, used on fpt.edu.vn. There are a total of 25 technologies from 11 different industries installed on fpt.edu.vn.
</div><span class="text_page_counter">Trang 13</span><div class="page_container" data-page="13">Average interaction level of posts by network
Average engagement by content types
Average engagement by day published
The best day to publish is Friday, and articles published on Friday have an average engagement of 49.
This information shows that posts published on Fridays have higher engagement compared to other days of the week. The average engagement level is 49, which can be a good indicator of user interest and engagement in content published on this day. This could be due to many reasons, including user browsing habits, weekend-optimized content, or other factors.
</div><span class="text_page_counter">Trang 14</span><div class="page_container" data-page="14">Average engagement by content length
This information shows that articles between 1,000 and 2,000 words in length have higher engagement. The average engagement level is 53, showing that
users tend to be more interested and engaged with posts within this length range. This can be due to many reasons, including the depth and detail of the content, ease of reading and understanding, or suitability to the user's reading habits.
</div><span class="text_page_counter">Trang 19</span><div class="page_container" data-page="19">First Contentful Paint (FCP): This metric measures the time it takes for the first text or image to appear on the screen. In this case, it took approximately 1.4 seconds for the initial content to be visible.
Total Blocking Time: This represents the cumulative time when tasks exceeded 50 milliseconds between FCP and the point when the page becomes fully interactive. In this case, the total blocking time was 110 milliseconds.
Speed Index: The Speed Index indicates how quickly the contents of a page become visible. In this case, it took approximately 3.0 seconds for the entire page to load visibly.
Largest Contentful Paint (LCP): This metric marks the time when the largest text or image is painted on the screen. This occurred around 5.5 seconds after the page started loading.
Cumulative Layout Shift (CLS): CLS measures the movement of visible elements within the viewport. The number 0.598 which indicates the degree of layout stability during page loading.
These metrics help evaluate the performance and user experience of a website. Optimizing them can lead to faster load times and better overall usability.
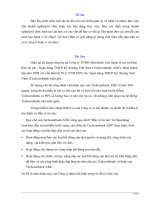
3. Data visualization:TREND BY DEVICE
</div><span class="text_page_counter">Trang 21</span><div class="page_container" data-page="21">
Choose the Combination chart because:
Compare multiple types of data: The Combination chart allows you to visually compare many different types of data on the same time axis or x-axis. This makes it easy to spot trends, correlations, and differences between types of data.
<b>• Compare the number of web users on mobile and desktop. • Compare user behavior on mobile and desktop . </b>
Save space: Combination chart can combine many different chart types into the same chart, helping to save space space and allows you to see more information on the same screen.
<b>• Helps combine multiple chart types at once to represent mobile or </b>
desktop users
<b>• Record many different data on the chart at the same time </b>
Enhance accessibility: Combination charts can be more easily accessible Other types of charts for people with poor eyesight or difficulty recognizing colors. Flexibility: Combination charts can be customized in a variety of ways to meet your specific needs.
In addition, the Combination chart also has a number of other advantages:
<b>• Easy to create and edit. </b>
<b>• Can be exported to many different formats. • Can be shared online or embedded in reports. </b>
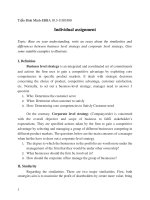
</div><span class="text_page_counter">Trang 22</span><div class="page_container" data-page="22">TRAFFIC CHANNELS BY TYPE
</div><span class="text_page_counter">Trang 23</span><div class="page_container" data-page="23">Line charts:
<b>• Track trends: Line charts make it easy to track data trends over time. • Emphasize changes: Line charts help you identify sudden or gradual </b>
changes in data.
</div><span class="text_page_counter">Trang 24</span><div class="page_container" data-page="24"><b> • Compare data: Line charts can help you compare data across groups or </b>
over time. Pie charts:
<b>•Compare percentages: Pie charts help you easily compare percentages </b>
<b>• Easy to understand: Pie charts are easy to understand and can be used by </b>
people of all levels.
<b> • Flexible: Pie charts can be used to represent many different types of data. </b>
Column chart: Column chart is used to compare data between groups of countries
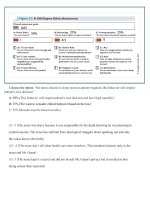
SUBDOMAINS
</div><span class="text_page_counter">Trang 25</span><div class="page_container" data-page="25">
With the pie chart, we can easily compare the highest and lowest subdomain rates combined with comparing the highest access rate to which page.
4. Marketing strategy and goals:
First to improve conversion rates, content marketing strategies and paid advertising campaigns
</div><span class="text_page_counter">Trang 26</span><div class="page_container" data-page="26">Improve conversion rates:
• Website optimization: Make sure the website loads quickly, is easy to use and has a responsive interface. visual interface.
• Create a clear call to action (CTA): The CTA should be short, concise, and easy to understand.
• Provide valuable content: Content should be useful, relevant to your target audience, and encourage them to take action.
• A/B testing: Testing different elements on your website to see which yield the highest conversion rates.
Content marketing strategy:
<b>• Identify target audience: Understand the needs and interests of the target </b>
audience to create appropriate content.
<b>• Content planning: Identify suitable content topics and schedule posts. • Create high-quality content: Content should be well-written, informative </b>
and attract readers.
<b> • Content distribution: Share content on various channels such as blogs, </b>
social networks, email marketing, etc... Paid advertising campaign:
• Determine campaign goals: Clearly define the goals of the advertising campaign before starting.
Choose the right advertising • Choose the right advertising channel:
channel for your target audience and budget.
• Set up an effective advertising campaign: Write compelling ad titles and descriptions, target accurately and use budget effectively.
• Campaign tracking and optimization: Monitor the effectiveness of your advertising campaign and make adjustments when necessary.
With the metrics we collect through SEMRUSH or GOOGLE ANALYSIC, we will be able to develop a data-driven marketing strategy and SMART goals for future website-focused campaigns targeting Target specific target audience segments as follows:
4.1. For college students: SMART goal:
• Increase mobile website traffic by 40% within 6 months.
• Increase conversion rate (CR) from mobile users by 15% within 1 year. Strategy:
Make sure your website • Optimize your website for mobile devices:
displays and works well on all mobile devices.
</div>