Luận văn thạc sỹ Kỹ thuật và Quản lý vùng ven biển: Study on inundation due to storm surge for Phu Quoc island
Bạn đang xem bản rút gọn của tài liệu. Xem và tải ngay bản đầy đủ của tài liệu tại đây (4.04 MB, 101 trang )
<span class="text_page_counter">Trang 1</span><div class="page_container" data-page="1">
MINISTRY OF EDUCATION AND MINISTRY OF ARGICULTURETRAINING AND RURAL DEVELOPMENT
THUY LOI UNIVERSITY
VU VAN LAN
STUDY ON INUNDATION DUE TO
STORM SURGE FOR PHU QUOC ISLANDS
THESIS OF MASTER DEGREE
</div><span class="text_page_counter">Trang 2</span><div class="page_container" data-page="2">MINISTRY OF EDUCATION AND MINISTRY OFARGICULTUREÍ
‘TRAINING AND RURAL DEVELOPMENT
‘THUY LOI UNIVERSITY
</div><span class="text_page_counter">Trang 3</span><div class="page_container" data-page="3">hereby certify the work which is being presented inthis thesis entitled, “Study on storm
surge due to inundated for Phu Quoc island” in partial fulfillment of the requirement for
the award of the Master of Coastal Engineering Management, isan authentic record ofmy own work cartied out under supervision of Ass. Prof. PRD. Vu Minh Cat. The matter‘embodied inthis thesis has not been submitted by me for the award of any other degreeor diploma.Date: May 30, 2016
Vu Van Lan
</div><span class="text_page_counter">Trang 4</span><div class="page_container" data-page="4">1 would like to thank faculty of Marine and Coastal Engineering of Thuy Loi Universityand Faculty Marine Science & Island, Ha Noi University for Natural Resources andEnvironment for enabling me thesis before the deadline.
Finally, I would like to express my special appreciation to my friends and colleagues for
their support, encourage and advices. The deepest thanks are expressed to my familymember for their unconditional loves.</div><span class="text_page_counter">Trang 5</span><div class="page_container" data-page="5">TABLE OF CONTENS
LIST OF FIGURES5. Structure of the thesis
CHAPTER 1: OVERVIEWS ON STORM SURGE STUDY AND STUDY AREA11, Literature reviews
1.1.1, International researches on storm surges.1.1.2. Storm surge researches in Viet Nam1.2. Brief description on study area
1.2.1.Natural eonditior
1.2.2 Climatic and oceanographic characteristics1.2.3, Hydrological and oceanographic characteristics,1.2.4, Social and economic features.
CHAPTER 2: APPLICATION OF DELFT3D TO STUDY STORM SURGE2.1, Data used for he simulation
2.1.1. Statistical typhoon data2.1.2. Water level
2.1.3, On land and seabed topography2.2, Model description
2.2.1, Hydrodynamic Model2.22. Typhoon model
2.3. Set up the hydrodynamic model2.3.1. Computational grid
29293636
36
364350s0sĩ</div><span class="text_page_counter">Trang 6</span><div class="page_container" data-page="6">2.34, Other parameters 52.4, Model calibration. 33CHAPTER 3: SIMULATION OF STORM SURGE IN PHU QUOC ISLANDS...59
3.1. Typhoon zoning along the coastlines of Viet Nam 593.2, Generation of typhoon scenarios for Phu Quoc areas ¬3.3, Extraction of water level around Phu Quoc islands 6.3.3, Simulated results 6
3.3.1. Scenario 1: Simulation of typhoon namely Linda (later is called Lindatyphoon) that approached to the study area in November, 1997 63.3.2 Scenario 2: Scenario 1 in case of the typhoon Linda coming at the sametime of flood tide at the study area, 663.3.3, Scenario 3: Simulation of typhoons according scenarios approved by
Ministry of Natural Resources and Environment (MoNRE), but wind velocitychanges with the time V= f0. 69
CHAPTER IV: BUILDING INUNDATED MAPS CAUSED BY STORM SURGE
FOR PHU QUOC ISLANDS 724.1. Introduction on application of GIS. n4.2. Application of ArcGIS software to build up inundated map, 144.2.1 Topographic data 754.2.2. Hydrologie data n4.3, Building up inundation maps. 784.3.1. The inundation map of scenario Ì T84.3.1. The inundation map of scenario 2 824.3.2. Inundation of Phu Quoe island according scenario 03. 85CONCLUSION AND RECOMMENDATION 89Conclusion 89Recommendation 90
References 92
</div><span class="text_page_counter">Trang 7</span><div class="page_container" data-page="7">LIST OF FIGURES
Figure 1. Flowchart to illustrate the study approach 12
1D model with experimental data of Bowen (1986)
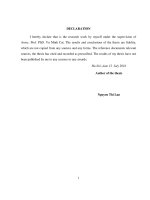
Figure 3 .Location of Phu Quoe islands on satellite image
Figure 4 Statistical storm paths approaching to Viet Nam coastsFigure 5. Grid calculated in the study area
Figure 6:Topography in Phu Quoc areaFigure 7.The model grid and boundariesFigure 8. Phu Quoc oceanographic station
Figure 9. Observed and computed water level at Phu Quoc (C=55)Figure 10, Observed and computed water level at Phu Quoc (C=60)Figure 11. Observed and computed water level at Phu Quoc (C=65)Figure 12. Observed and computed water levels for model verificationFigure 13, Observed and computed water levels in verification stepFigure 14.Typhoon zoning along the Vietnam coasts
Figure 15.Basie characteristics and storm risk in Viet Nam CoastsFigure 16, Extracted points of simulated water level
Figure 17.The track of Linda typhoon in the study area
Figure 18, Water level field around Phu Quoc islands in seenario |Figure 19, Storm surge at 8 points around islands in scenario 1Figure 20-Tidal series at Phu Quoc during Linda typhoonFigure 21. Storm surge at 8 points around islands in scenario 2Figure 22. Storm surge at 8 points around islands in scenario 3Figure 23.Topographie data layer of Phu Quoc island
Figure 24. Vegetation cover layer on the Phu Quoc islandFigure 25,Cadastral data layer of Phu Quoc island
Figure 26 Hydrological data layer around Phu Quoc island
Figure 27.Simulated water level and topography in coast of Duong Dong and HamNinh
Figure 28. Inundated mapping Phu Quoc with seenario 1
80
</div><span class="text_page_counter">Trang 8</span><div class="page_container" data-page="8">Figure 29. Inundation maps of the Cua Duong, Duong Dong, Duong To communes 81Figure 30. Inundation mapping at the Ham Ninh commune seFigure 31, Inundated map in scenario 2 saFigure 32. Inundated mapping of Duong To, Cua Duong and Duong Đông communes,
Figure 33. Inundated mapping of Duong To, Cua Duong and Duong Đơng communes.¬Figure 34.Spatial disribution of flooded areas in the Phu Quoc island in scenario 3 86Figure 35, Inundated mapping of Duong Dong and Cua Duong commune 87Figure 36 Inundated mapping of Ham Ninh commune 87Figure 37. Inundated mapping of Dương To commune 88
</div><span class="text_page_counter">Trang 9</span><div class="page_container" data-page="9">LIST OF TABLES
Table 1 Coordinate of Phu Quoc area shown in map scale of 50/0)
Table 2. Monthly and yearly average temperature in Phu Quoe and Rach GiaTable 3 Monthly and yearly average and minimum humidity (%) at Phu Quoc‘Table 4.Monthly and yearly average and minimum humidity (%6) at Phu QuoeTable 5. Monthly wind velocity and main direction at Phu Quốc
‘Table 6.The statistical result of wave height and its period at Phu Quoc
‘Table 7.Water level at Phu Quoc (103958 E ~ 1013 N) station (1990-2008)
Table 8 Stat ics on typhoon hitting to Phu Quoc and surrounding areasTable 9 Characteristics of typical typhoons approaching to the southern coasts.Table 10.Tidal constituents at 3 boundaries.
‘Table 11.Coefficient RMSE.
‘Table 12.The locations where water level is extractedTable 13.Linda typhoon’s parameters
‘Table 14.Highest storm surge and appearance time at the extracted points‘Table 15.Adjustment of Linda typhoon time to fit to spring tide.
Table 16.Highest water level and appearance time at 8 points in scenario 2.Table 17. Typhoon parameters used to simulate in scenario 3
‘Table 18, Highest water level and appearance time at 8 points in seenario 3.Table 19. The maximum storm surge at the point around Phu Quoc islands‘Table 20,Clasification of inundated depth
‘Table 21. Flooded area for Phu Quoc island in scenario 1‘Table 22. Flooded area for Phu Quoc island in scenario 2.‘Table 23. Flooded area of Phu Quoe island in scenario 3
8587
</div><span class="text_page_counter">Trang 10</span><div class="page_container" data-page="10">In recent years due to the impact of global climate change, natural disasters becomemore complex, especially storms, accompanied by rising sea levels caused flooding ofcoastal estuaries. The sea level rise due to storm caused flooding of coastal areas andbreak dike, especially storm occur during high tides. So the study, calculated andforecasting extreme storm surge in coastal area and flooding risk due to storm arepositive tasks to find appropriate solutions for prevention and reduction of damages incoastal areas. The components cause extreme water level during storm including tides,storm surge, and wave surge, in which the storm surge is an important one.
‘Storm surge is a dangerous natural phenomenon which causes lost lives, destruction ofsocio-economic infrastructures and valuable resources when typhoon attacking tocoastal areas. Worldwide, storm surge has caused major damages such as the typhoonin 1970 and 1990 with water surge more than 7 m, generated large wave, inundated todelta of Bangladesh and over 400,000 people were killed. On the Caribbean, highestwater surge of typhoon Flora is 8 meter, it had cause flood and over 5000 people werekilled, Coastal of the United States had been affected by historic storm surge of up to7.4 m. The countries on the Northern coasts of Europe had been affected serious of stormsurge in 1916, 1953, 1962, 1976, in which the storm occurred in 1953 in Netherlandcaused large inundation and over 1400 people killed
‘Storm surges may be defined as high sea water level above mean sea level which iscaused by strong winds and low atmospheric pressures of a storm, Winds which blowtowards land exert a shearing stress on the surface, causes an increase in the sea waterlevel near the coastlines. Low atmospheric pressure also produces high elevation due tothe so-called inverted barometer effect. The highest surges have generated by strongtropical cyclones. The surge belongs to the same class of phenomena as tide waves andtsunamis, Its horizontal scale depends on the parameters of the storm. In general thestorm surge oceurs in duration of several hours, but it ean sometimes last fora few daysItis obvious that prediction of surges is a very urgent issue to be addressed, especially
</div><span class="text_page_counter">Trang 11</span><div class="page_container" data-page="11">atempts to develop methods for forecasting storm surges in Vietnam, At present, allkinds of activities are inereased in number and almost marine constructions need sealevel data for designing, Sometimes they need the values of sea level rise which happenat rare frequencies, while the observed stations located along coasts and islands arescarce. That’s why in this study numerical models are used to simulate storm surge basedcon the data of bathymetry, figure of coastlines, climate characteristics of typhoons and‘oceanic data at sea and coastal stations.
2. Objectives
‘The general objective of the present work, therefore, is to develop a method based onhydrodynamic models to determine maximum surface water elevation generated bytyphoons. The computed results of model produce an atlas of pre-computed surges and4a collection of several possible typhoon conditions from many potential surges. It isstraightforward to determine the highest possible surge at all vulnerable coastal locationsfrom a particular family of tracks and simulated storm surges as input data forpreparation of potential map of inundation in Phu Quoc island.
3. Objects and scope of the study
+ Objects of the study: The extreme water level during storm at the shorelines andpotential inundation caused by storm surge.
+ Scope of the study: Phu Quoc islands and surrounding areas4. Study approaches and methodology
‘The simulation of storm surge and land inundation by using Delft3d is shown in figure1, of which the following steps are conducted.
</div><span class="text_page_counter">Trang 12</span><div class="page_container" data-page="12">‘Step 2: Set up computational model
It includes computation network, meshes, defined boundaries such as tide series, seabed
topography and typhoon information including central typhoon pressure, typhoon
</div><span class="text_page_counter">Trang 13</span><div class="page_container" data-page="13">rs thal are fitdata, the calibration and verification are conducted to find model paramet
between simulated and real observed data both for hydrodynamic as well as typhoonmodels
‘Step 3: Create scenarios for simulation of storm surg n the study area
‘The scenarios proposed for study of storm surge are based on the real typhoon whichhad been occurred in the past and potential typhoon that can occur under the climate‘change conditions. These are presented in detail in chapter 3.
‘Step 4: Simulation of storm surge around the study area according to scenarios proposedin step 3
Results of this step are resultant water level fields (including tide plus storm surge) atthe study areas. The real storm surge can be taken by subtracting total water level and
astronomical tide at the same time. The computation of resultant water level, potential
land inundation around the island at many points is taken for each scenario.Step 5: Inundated mapping for each scenario
By overlapping simulated water level map on to topographical map with the support ofGIS software, the potential inundated map can be produced for each scenario,
‘Step 6: Conclusions and recommendations
In this content, author will summary the results conducted in the research and also
propose the future works that
should be continued to serve socio-economic developmentin Phu Quoc islands.5. Structure of the thesis
Besides the introduction, conclusion, recommendation and annexes, the study isconsisted 4 chapters as following:
Chapter 1: Overviews on storm surge study and study areaChapter 2: Application of Delfi 3D to study storm surge‘Chapter 3: Simulation of storm surge in Phu Quoc islands,Chapter 4: Building inundated maps caused by storm surge.
</div><span class="text_page_counter">Trang 14</span><div class="page_container" data-page="14">CHAPTER 1: OVERVIEWS ON STORM SURGE STUDY AND STUDY AREA
Storm surges may be defined as high sea water level caused by strong winds and lowatmospheric pressures at the center of a storm. Winds which blow towards land exert ashear stress on the surface, causing an inerease in the sea surface elevation near thecoastline. Low atmospheric pressure also produces high elevation due to the so-called
inverted barometer effect. The highest surges are generated by strong tropical yelones
and itis considered the same category of phenomena as tide waves and tsunamis. Itshorizontal scale depends on the parameters ofthe storm. In general, the storm surge can‘occurs in the duration of several hours, but it can sometimes last for a few days. It is‘obvious that prediction of surges is a very urgent issue to be addressed, especially incoastal regions which are affected by tropical cyclones,‘There have also been many attempts to develop methods for forecasting storm surges in
Vietnam, At present, on the coastal areas, all kinds of activites are inereased in number
and almost marine structures need sea level data for designing. Sometimes they need thevalues of sea level rise which happen at rare frequencies, while the sea level stationslocated along coasts and islands are scarce, That's why we need to find another way todefine the maximum values of sea level rise that can happen in the chosen areas. TheWay mentioned here is numerical model that is used to simulate sea level ce with thedata of bathymetry, coastal topography and climate characteristics of typhoons, tide and
Wave conditions occurred at the chosen places.
‘Worldwide, storm surge has caused serious damages in the coastal areas. For examplethe typhoons attacked the Bangladesh in 1970 and 1990 created a storm surge of morethan 7 m, generating high waves, and inundated large area of Bangladesh delta and morethan 400,000 people were killed in these events. On the Caribbean Sea, the highest watersurge of typhoon Flora was 8 m causing serious flood and over 5,000 dead peoplesCoastlines of the United States had been affected by big storm with storm surge up to
7-4 meters. The countries on the Northern coasts of Europe had also been affected by
serious storm surge in 1916, 1953, 1962, 1976 in which the typhoon in 1953 hitting the</div><span class="text_page_counter">Trang 15</span><div class="page_container" data-page="15">coastlines of Netherlands caused sea dike breaches, resulting large inundation and over1400 dead people.
Storm surge is very dangerous natural phenomenon which causes to destroy valuableproperties, lost lives and all socio-economic infrastructures when typhoons attack tocoastal areas, Friction of wind on water surface and decreasing pressure at typhoon‘center are main reasons to create high storm surge. The bathymetry and parameters oftyphoon including center typhoon pressure, maximum wind radius, wind velocity, stormtrack, river flow, and tidal regime are factors which affected to storm surge. That's whythe problem is very urgent and important to study.
‘There have also been many attempts to develop methods for forecasting storm surges inVietnam, At present on the coastal areas, all kinds of activities are increased in numberand almost marine construct s need data for designing in which sea water level is veryimportant because it happens at rare frequencies, meanwhile the observed stations
located along coasts and islands are scarce. Thats reasons why we need to find other
ways to define maximum values of sea level rise occurred in a certain are The way‘mentioned here is an application of numerical models for simulation. For doing this dataof bathymetry, coastal topography, hydrodynamic parameter such as tide, waves, sea‘currents and typhoon characteristics in the interested areas are needed.According to Le Van Thao et al. (2000), storms occur in Viet Nam unevenly. The mostaffected areas are the northern and the central coasts. The southern coastis less affectedboth in number and intensity, but damages was more serious because less awareness onthe typhoons of local people. Typhoon Linda in November 1997 was an example and‘considered as a very uncommonly strong storm in the past 100 years to the southerncoasts area, There was about 778 people killed, 1142 and 2541 injured and missing,2789 boats sank etc. The total economic loss was estimated about 480 million USD (Le
Van Thao et al, 2000).
Phu Quoc and Tho Chu islands belonging to Kien Giang province are located in the‘westem sea of Thailand gulf. They are considered as strategic locations in socio-economic development as well as defense and security in the south of Viet Nam due to
</div><span class="text_page_counter">Trang 16</span><div class="page_container" data-page="16">there terrain and resources. For sustainably economic development and environmentalprotection, the study all on natural disasters, specially typhoon and storm surges is apriority tasks. For which we can assess the flood inundation and damages duc to typhoonand storm surges to serve marine spatial planning as well as to make strategy for
mitigation of natural disasters for Phu Quoc islands.
1.1. Literature reviews
1.1.1. International researches on storm surges
Because of the direness of the storm surge disaster, the studies of theory and scene fromwhich construct methods, technological modeling to calculate and forecast storm surge,which have been conducted for so long. According to Brestschneider (1959), differentfactors can cause change of the water level in coastal areas during a hurricane are: the
parameter of storm (atmospheric pressure, wind speed ...), the rotary motion of the earth,
‘wave, and rain, Later, Pore (1965) has added factors: tide, shape ofshoreline and waterdepth.Currently there are several methods of calculation and forecast storm surge such as‘method uses semi-empirical formula, diagram method, artificial neural systems methodand numerical model methods
In the method using semi-empirical formula (Ippen and Hallerman, 1966), surge
magnitude is calculated based on ground level wind speed, wind fetch length, the angle
between the wind direction and the axis perpendicular to the shoreline and the waterdepth. This method is very simple but precision is not high because it does not describeall the factors which impact on storm surgesDiagram method (Yang et al, 1970, Horikawa, 1985) is often used to forecast stormsurges for some ports, where have many monitoring data on hurricanes and storm surges.‘The content of the method is to construct the monogram based on the relationship‘between monitoring data of water level with parameters of hurricane storm (the largest‘wind speed, wind direction, reduce of pres ssure in the center). Therefore, the method isvery limited when data series is not long enough (usually around 100 years if requireresult is high precision) and often only true for the nearest observation station.
</div><span class="text_page_counter">Trang 17</span><div class="page_container" data-page="17">Numerical models method was created to overcome the deficiencies of empiricalmeasurement data. The advantage of this method is reduction of cost compared with‘experimental measurement methods. In addition, this method also allows calculation,forecast the evolution of the phenomenon based on a lot of assumed scenarios, which
does is not yet exist in reality present but likely to happen in the future.
In studies by numerical models, storm surge phenomenon is modeled based on theshallow water equations (2 or 3 dimensions). Depending on the purpose, in forecastabout storm surges, 2-dimensional model does not take much time to calculate but it canachieve full accuracy. When the need for simulation and calculations in more detail, egdistribution according to the flow rate of the water layer, 3-D model is needed, Withmore detail simulation and calculations, such distribution flow rate under water layersis revealed in 3-dimensional model. At the beginning, the numerical models were builtto simulate storm surge, which are limited by several reasons: (1) Usually onlysimulation, calculation of individual phenomena such as tide, wave, storm surges: (2)‘The grid is very course, which docs not cover about the detailed topography of coastalarea; (3) In addition, many effects that affect to storm surges in the equations system isignored, Therefore, accuracy of the results of the model varies among areas orsimulation is very good for a storm but limited with other storms, For example,
Jelesnianski's model (1965), which has ignoted friction component and nonlinear
‘component, so calculated results were reasonable in spatial distribution of water rise andthe time storm surges is the highest, however tends to overestimate the water height insome 1. SPLASH model (Special Program to List Amplitude of Surge from Huricanes)\vas built in 1972 by Jelesnianski and then SLOSH model (Sea, Lake, and Overlandsurges from Hurricanes) was developed to simulate the storm surge in coastal areas, seaand lake, which NOAA (National Oceanic and Atmospheric Administration) used tosimulate coastal flooding caused by storm surge in the United States (Jelesnianski et al,1984, 1992) but there are many restrictions such as the use a grid with fixed structure,‘which cannot simulate the coastal areas with complex topography and shoreline.‘The Concept of storm surge in the previous calculations usually understood as the waterlevel rises due to the impact of the wind stress and reduction of pressure in center of the
</div><span class="text_page_counter">Trang 18</span><div class="page_container" data-page="18">storm, Howe + in fact wave stress generated surge wave, which occupies a verysignificant part of the storm in the shallow waters. Therefore, recently wave setup hasbeen inter ‘fed and considered as an important part in the warning news, fore
<small>countri</small> like the US, Japan, UK. Due to the complexity of the wave setup phenomenon,
calculation has just followed by the analytic formula Longuet- Higgins and Stewart
‘This study has shown that the magnitude of wave set up depends on the horizontal
gradient variation of wave radiation stresses, Longuet-Higgins and Stewart’s theory hasexplained the mechanism of phenomenon of rising water and ebb water around breakwater area in shallow water zones, Longtuet-Higgins and Stewart's theory proved quite
suitable, when verified with experimental data of Bowen etal (1968) about phenomenonof rising water and ebb water in points around break water area, Bowen et a'sexperiments (1968) on the phenomenon of wave surges and ebb water, which are causedby waves have been used to verify numerical models, which simulate the phenomenon‘of wave propagation in coastal zones as shown in figure 2— Dinh sóng Bung séng —— Marc nước biển trung bình
<small>0082008</small>
</div><span class="text_page_counter">Trang 19</span><div class="page_container" data-page="19">Chen et. al (2008) in 2005 Hurricane Katrina in the US, which concluded that stormsurge by affection of coastal wave contribute 80% in extreme water levels while otherinfluen such as tide, surface wave and rising water by wind contributed only 204.
In 2010, You! Kim Soo et al have developed model to predict storm surges, whichintegrated tide both waves (Surge Wave and Tide - Suwat). This model was designedwith integrated mesh to calculate storm surges in the Tosa Gulf - Japan and the resultsare consistent with the measured data, while previ sly many models not interestedWave setup give lower results. Youl Kim Soo's research also shows that to study wavesetup need to perform on the calculated grid which has detailed resolution. After YoulKim Soo model has been used to forecast storm surges in many ports in Japan.
In recent years, due to the development of systems of monitoring and transmit waterlevel data in real time, data assimilation techniques of water level in tidal forecast model,from that storm surges has been built and development (Lewis and Derber, 1985;‘Thacker and Long, 1988),
To accurately predicting storm surge depends on accurately predicting the field ofpressure and wind in storms. However, if the water level monitoring data is regularlyupdated in the forecast calculations, the error will be decrease significant. WhenLionello P. (1996) used data assimilation techniques in water level forecasting models
showed that the storm surge forecasting results in report in Atlantic Beach has reduced
errors up to 50% for forecast from I to 3 dayAssess the risks of hurr Iso follow the traditional approach ofanes and storm surges
a wsters is based on statistical methods. In developedsing risk method of natural dicountries like the US, Canada, Australia, the European Community (England, Poland,Croatia, Italy, Netherlands, Spain), Asia (Japan, South Korea, the East Asian countries(SY Wang et al, 2007), there have many research programs to develop response methodscarly, To calculate the possibilities of disaster ts . Monte-carlo (PPMC) method is usedalot in disaster applications: storms, storm surges, waves and waves in storms, floods,
landslides, earthquakes. Specifically with surges in Australia, scientists have simulatedstorm for 3,000,000 years from data of historical hurricanes in 30 years, the US used
</div><span class="text_page_counter">Trang 20</span><div class="page_container" data-page="20">storm simulated data from 2,000 y from data of historical hurricanes in 100 years,which is used as input of the storm surge model, from that construct frequency line ofstorm surge with period from 2-100 years and distributed risk map of large wave,
1.1.2. Storm surge researches in Viet Nam
Vietnam is a coastal country with high potential risk of storm surges. That's why thestudy storm surges is paid much attention long time ago with many methods from‘experiences to mathematical models,
According to stati
ial researches, the frst study of Vu Nhu Hoan (1988) was presented,
in which storm surges are estimated according to statistical methods and charsRecently, Hoang Trung Thanh (2010) used observed data of water levels in the‘oceanographic and estuary stations t0 assess water surge generated by wind and thus‘gave overview about time and rise and set down trends at the monitoring stations.Although there the advantage of being simple and easy to use but limited the application‘of statistical methods. Because of very sparsely observed stations, the accuracy of thismethod is not so high. ‘Therefore this method is only suitable in some monitoringstations where data series are long enough and with thi son it is rarely used inVietnam,In research methods using numerical models, there are three main directions being used,‘These are included self-built models, research and development of open source models
from abroad; and using commerce models from abroad. These information can be seen
in the researches of Vu Nhu Hoan, Do Ngoc Quynh, Le Trong Dao, Bui Xuan Thong,Dinh Van Manh, yen Thi Viet Lien, Nguyen Vu Thang and Nguyen Xuan HienWhen arching storm surges in coastal areas of Tokin Gulf, Le Trong Dao (1998)have used finite element method to calculate tide and storm surges and had conclusionthat due to large tidal difference up to 4.0 m, so storm surge was more impacted by tidalregimes. Also by using this method, Nguyen Vu Thang (1999) got result about
prediction storm surges at Hai Phong coast using finite element methods,
Also by using finite element method, in the governmental projects namely KT.03.03,
</div><span class="text_page_counter">Trang 21</span><div class="page_container" data-page="21">equations to calculate the tide and storm surges for all Vietnam coastal areas.Accordingly, the current situation and the risk of storm surges was calculated andpartitioned by latitude. The served for dissults of the study hav: ister prevention andbuild coastal constructions. Also according to the finite difference method, Bui Xuan‘Thong (2000) has developed cage mesh to increase the details the points need calculatedas well as reducing the time to calculate when the calculate storms surges. In 2001, themodel predicted storm surge had calculate to tidal and design on the cage mesh by theInstitute of Mechanics have been applied on calculated the storm surge with detailedresolution to 1.0 km serving the coastal constructions such as dikes, jeties, after that,this model has been applied in many subjects different projects related to storm surgein Vietnam. Author Phung Dang Hieu (2013) have built mod Is that predict storm surgesthat taking into account the influence of the tide on the system nonlinear shallow water‘equations and according different method of SMAC combined with schemetic CIP theae tertiary accuracy for nonlinear components, The model was applied to simulatesurges and flooding coastal areas of Thua Thien Hue very reliable results when‘compared with observation data
ent years, due to the development of computational systems and informationtechnologies have had many foreign models are built and developed towardscommercialization as well as shape open source to community develop. The popular|| model is being applied in Vietnam as models MIKE Danish HydraulicInstitute (DHI), SMS model of the US Navy, the Delft-3D model of the HydraulicInstitute Delft. In the thesis had used Delft 3D- Flow simulation about storm surge inPhu Quoc Island,
1.2. Brief description on study area1.2.1.Natural conditions
‘Geographical location
Phu Quoc is the biggest island of Vietnam, located in Thai Lan Gulf, Kien Giangprovince. It is about 7.5 km from North West of Phu Quoc tơ the neighboring country‘of Cambodia. The distance from Phu Quoc to Rach Gia and Ha Tien cities are relatively
</div><span class="text_page_counter">Trang 22</span><div class="page_container" data-page="22">112 km and 45 km accordingly. Administratively, Phu Quoc district consists of Phu(Quoc island and 2 other smaller islands namely An Thoi and Tho Chu with total area of
593.05 km* in which Tho Chu archipelago is farthest from the main land (about 115
km)(beh Sa eae seed 2 HMNG
Figure 3 .Location of Phu Quoc islands on satellite image
The shape of Phu Quoc island is nearly triangular, base side in the north, narrow‘gradually to the south (Figure 1.3). The research site would be covered Phu Quoc waterarea of 220 km2, from the coastline of island to the water depth up to 20 m, The studyarea is defined by the points from AI to A26 with coordinates (National Coordinate
System VN 2000) showed in table 1
</div><span class="text_page_counter">Trang 23</span><div class="page_container" data-page="23">Table 1 Coordinate of Phu Quoc area shown in map sale of 1/ 50.000
Northern astern Northern EasternPoint Point<sub>latitude longiude latitude longitude</sub>
AI | 103°595455" |9562354" [and [103°594759° | 10°28" 696"
A2 Ì103°894378" |9°59 60 ais [104° 02'092" | 10°26 965AZ| 103°5831.95" 110032162" [Ate | 104" oF 887" | 10" 2456.19"
+ From 0 — 8 m: generally even and flat, At the southern site, bathymetry is morecomplicated with unstable slope, submerged dunes and deep channels due to the impacts
Of submarine canyons. The estuarine topography is consisted of submerged dunes, bar
between channels and varies with seasons due to river-sea dynamic interaction,++ From 8 -20 m: the bathymetry is deeper from the shorelines to the offshore. It is theboundary of modern sediment deposition area and existing kinds of shorelines: This kindof shoreline was observed in every original rock before Quaternary era in Phu Quoc
island and other islands, composition is mostly high stable continental sedimentation,
</div><span class="text_page_counter">Trang 24</span><div class="page_container" data-page="24">1.2.2 Climatic and oceanographic characteridies
In general, Phu Quoe area is belonging to tropical monsoon climate with dry and rainyseasons annually. Main climatic characteristics computed based on data collected during
1992-2003 in the islands are shown as below.
‘Temperature: monthly air temperature is presented in table 2. For that annual average
‘temperature is 27.40C; hottest in May (28.70C) and coldest in January (26.10C).
‘Table 2.. Monthly and yearly average temperature in Phu Quoc and Rach Gia (°C)
Min value [40 |36 [39 [43 46 60 [61 [65 [60 |50 [44 |39 [36
Precipitation: Yearly rainfall at Phu Quoc is 2983 mm. The rainy season starts fromMay to October with about 130 rainy days and total rainfall of 2397 mm, approximately80%, The dry season lasts from November to April next year with total rainfall of only20%, Maximum rainfall is in August and minimum value is in February/anuary. Daily
‘maximum rainfall is also in August with value of about 330mm.
‘Table 4.Monthly and yearly average and minimum humidity (%) at Phu Quoc
Parameer|1 |2 [3 [4 j5 j6 |7 |8 |9 |w [m |iMonhiyWa) |467|386| 651 | 1793 3803 7 | 4114| 40A9 | 4478| 3840| 1956 | 764
</div><span class="text_page_counter">Trang 25</span><div class="page_container" data-page="25"><small>ves) 20 [20]21 [21 a3 [a9 [ao [ae [as fio (22 |27</small>
Diresion [E |E BSE [BSW |WBW|W |wisw|W |W |ENW |BNE|ENE
Storms: In general Thailand gulf including Kien Giang province has less storm vents in‘comparison to East sea and northern part of Viet Nam coasts. As statistics in recent 60‘years (1955-2015), there were fewer than 40 storms hitting to these areas in which therewere only 8 storms attacked Kien Giang coast. Storm season usually occurs in lastmonths of a year. Despite of less storm, but damages cause by these typhoons were veryserious due to less awareness of local people. The Linda storm occurred in 1997 was‘one example.
1.2.3, Hydrological and oceanographic characteristies
aa. River system: due to being formed on the small catchment areas, geomorphology andclimate conditior so river system in the Phu Quoc islands is less developed and mostlysmall with very short in length and steeping and later we call springs. The flow in thesesprings only exist in rainy season with very small discharge. The main springs areDuong Dong, Cua Can, Rach Tram, Cua Lap and Ham Ninh.
Duong Dong spring: Its the biggest channel in Phu Quoe originated from the center of‘4 main island and flowing to the sea in the west coast at Duong Dong estuary. This isthe biggest socio ~ economic and tourism center of Phu Quoc. In environmental point
of view, the waste water due to all activities is
discharged through this channel to causepollution seriously for the coastal and estuarine area of Duong Dong town,</div><span class="text_page_counter">Trang 26</span><div class="page_container" data-page="26">‘Cua Can spring: Itis the s ond rank channel of Phu Quoc island, flowing from the Eastto West at Cua Can estuary where saline water is intruded deeply to the land due to verysmall fresh water from upstream, Cua Can is also @ fishing port and very importanteconomic centre of Phu Quoc District.
Rach Tram is a third rank channel located at the northern part of the main island, butvery small in size and short in Iength and covered by vegetation, Fresh water exists onlyin upper part in rainy season. The mouth of Rach Tram is salted by sea water. Thedensity of population at this estuary is too high,
Ham Ninh is a spring formed in Ham Ninh island. Is also very small channel developedin west to east direction, The population in this location is high with main activities oftourism and aquaculture
bb, Waye climate; According to long-term meteorological data, Phu Quoc is belonging
to monsoon zone with northeast monsoon from November to April and southwestmonsoon from May to OctoberBased on observed data of wave and analyzed, it shows that about 40% of wave are `W; 30% of NE and E directions; 20% of other directions and 10% of calm wave.
SW-‘Table 6:The statistical result of wave height and its period at Phu Quoc
Frequency | — XI-I rey V.VH [ VM-X Yearly
(| Hom | Tế) | Mm) | T6) | Hom | 9) | Hem | T@) | Him) | T63)
50 | 02 | 22) 02 | 33 | 05 | as | 04 | 32 033 | 292% | 03 | 24 03 | 25 | 08 | 44 | 07 | 4i | os | 32
</div><span class="text_page_counter">Trang 27</span><div class="page_container" data-page="27">Table 7.Water level at Phu Quoc (103958 E — 10°13 N) station (1990-2008)
‘Water level (em)1.2.4, Social and economic features
Population: As statistical data in 2006, the population at Phu Quoc district was 86.908
people, equivalent to density of 147 people per km”. The rate of population growth in
the district is about 15% in 2005 due to the migration from different inland provinces tothis island. The distribution of people is uneven and mostly concentrated at the western‘coasts at Duong Dong and An Thoi towns where the land is of 20.8%, but the population‘of over 65% in comparison to the entte island.
Statistically data on socio-economic in Phu Quoe district is as flowing
+ Urban population: 49,000 people
+ Under aged people: 50.102 people of about 54% of the population.
+ Labor in industries: 11.934 employees, mostly working in handicraft and local andlight industries
+ Labor in the service sector: nearly 8,000 mostly in tourism field such as cateringhotels, motels.
+ Over 6.000 employees working in agricultural and forestry
Phu Quoc has many favorable conditions for socio-economic development, especially
in eco-tourism. With very famous sandy beaches and original forest covered mostly the
island and very sunshine and high temperature around the year, Phu Quoc becomes veryinterested place for ecotourism, Also marine resources, land resources, water resources</div><span class="text_page_counter">Trang 28</span><div class="page_container" data-page="28">are great potential resources for economic development. Fish-sauce and pepper arefamous products in Phu Quoc
</div><span class="text_page_counter">Trang 29</span><div class="page_container" data-page="29">CHAPTER 2: APPLICATION OF DELET3D TO STUDY STORM SURGE
2.1, Data used for the simulation
2.1.1 Statistical typhoon data
‘The study area is rarely affected by typhoons. According to statistics, every 2to 5 years,there is one storm to attack this area. Also typhoon intensity when coming to this area
is not so strong. With above two conditions, local people seem to be forgotten ontyphoon. They are not ready to prevent, so the typhoon is coming, it had eaused the
extremely damages both property and lives for Mekong provinces due to flood and
storm surge both in lands and islands in the areas. With above reasons, the study on
typhoon and water surge is very urgent and necessary task for the areas.LL
<small>`</small></div><span class="text_page_counter">Trang 30</span><div class="page_container" data-page="30">According to the General Statistics of Southeast Asian coasts, annually Vietnam coastsare subjected about 10 typhoons aquavelent to 33% of total number of typhoons occurin East sea in which more than 80% hitting to northern and central coasts and only lessthan 20% going to southern coasts including Phu Quoc.
‘Typhoon occuring is at the same time of rainy season, from May to October, while inthe southern coasts, it occurs during last quater of the year (October to December). Thetypical paths of typhoon approaching to Viet Nam Coasts are illustrated in figure 4.
Table 8 .Statistics on typhoon hitting to Phu Quoc and surrounding areas
No. [Name ‘Types Time
1 JLUCY, ‘Typhoon 25 NOV-01 DEC, 1962
2 | SARAH Tropical Storm 14-17 FEB, 1965
3 | WENDY Tropical Storm 18-21 DEC, 19654 |RUTH ‘Tropical Storm 27-27 NOV, 1970
5 | SALLY Typhoon 30NOV-05 DEC, 1972
6 | THELMA Tropical Storm 1Á-18NOV, 19737 JKH Tropical Storm 18-28 DEC, 1974
8 aay ‘Super Typhoon 1-10 NOV, 1989
9. H0 “Typhoon 8⁄22 NOV, 1992
10 | 4 Tropical Storm 24-31 OCT, 1996
n | #87 Tropical Storm 29 OCT-IBNOV, 1996
12 | LINDA Typhoon 31-03 NOV, 1997
BG Tropical Storm 10-11 DEG, 1998
HỘ TẠIW “Tropical Depression ‘01-01 DEC, 1999IS [32W Tropical Depression (09-11 DEC, 199916 | MUIFA Typhoon 14-26 NOV, 2004
17 | DURIAN Super Typhoon 26 NOV-05 DEC, 2006
18 | TWENTYFIVE | Tropical Depression 14-14 NOV, 2012‘Sourees: tp fw jma go jpfmaima-engma-cente/isme-hp-pub-eg/bestiack hi‘nup//eathernisys.convarticane!
</div><span class="text_page_counter">Trang 31</span><div class="page_container" data-page="31">Characteristics of typical typhoons approaching to the southern coasts including PhuQuoc islands are shown in table 9.
Table 9 Charact isties of typical typhoons approaching to the southern coasts.‘Typhoon Lin Da -1997
yy [mm [dd [hh] Lat | Long | Petmb) | Paimb) | VúmS) | Rekm) | Vim)1997| l0 (3118| 79 | H42 | 1004 | 114s | 2050 | 6087) 175
1997| 1110| 75 | Hã0 | 1009 | H35 | 1945 | 6087) 175
1997| 11 16 [78 | Hãi | 96 | H0 | 2024 | 6087) i8081997| 11 1|12| § | os | 994 1105 | 21.82 | 6087 | 20621997| 11 1 [8| 85 | 1090 | 992 7 1086 | 2260 | 6087) 2319I997| HH 2| 0] 85 | 1075 | 985 | 1068 | 2334 | 6087) 2777
2006 | 11 |26 | as] 103 | 12] 1000 iia | tor | 80 | is
2006| 11 |26|18| 106 | 1405 | 1000 7 H03 | 161 | 80 | Is
2006 | 11 |26|20| 106 | 1405 | 1000 1H03 | tor | 80 | Is2006| 11 |27| 3 | 109 |1388 | 998 1393 | 232 | 30 | 206
</div><span class="text_page_counter">Trang 32</span><div class="page_container" data-page="32">2006| 11 [27] 9 | 108 [1377] 998 | 19 | 25% | 80 | 206
2006| 11 |27|12| 103 [war] 9% Tấ | soo | g0 | 2322006| 11 |27|18| 112 | 186 | 90 | Hồi | 39 | s0 | 258
2006| 11 |30| 6 | ass | 1235| 940 136 | sts | so | a2
2006| 11 |30|12| 135 |1224| 950 T3 | aoa | 80 | 387
206| 12 |1 | 0 | 133 | 1H99, 960 1303 | ae | ao | 3612006| 121 |6 | 136 | 119 | 95 | 1196 | 463 | S0 | 361
2006| T2 |1 |I2| 137 | se] 96 | tie | a8 | a0 | 361
2006| 12 |1 |IR| 134 |H7S| 95 TRÒ | ae | BÚ | 361
2006| 12|2|0 | 135 | HT | 95 THỦ | as | a0 | 361
2006| 12 |2 |6 | 138 [tes] 96 TH | ae | 80 | 3612006| 12 |2 [te] 139 [47 | 960 THỨ | 464 | 80 | 387
2006| T2 |3 |0 | 138 |HA9| 955 | 1140 | 464 | R0 | 387
2006| 12 |3 |6 | 1A7 |[HA2| 955 193 | 464 | 80 | 32
2006| 12 |3 |12| 135 |H27| 955. 129 | 464 | wo | 387
2006| 12 |3 [isp asa | H2 | 960 THỦ | 464 | 80 | 3872006| 12|4 |0 | 126 [tie] 97 1HẠ | 412 | s0 | 35
2006| 12 |4 | 6 | 119 | tos] om 1H03 | 42 | 80 | 309
2006| 12 |4 |12| HH [ws] 9O | A07 | W7 | 80 | 309
2006| 12 | 4 | 18] 104 | 1083| 980 10M | 387 | s0 | 309
2006| 12| 5| 0| 10 |1069| 990 | 1070 | 255 | 80 | 2322006|12 [5 |I2|sS [1044 [1006 | 1030 [206 lao
2006|12 [5 [18 [83 |1033 [1008 1013 [206 | so
</div><span class="text_page_counter">Trang 33</span><div class="page_container" data-page="33">‘Typhoon LUCY - 1962
LAT LON DATE — | WIND(nots) | Pnimb) | Pe(mb)
65 1391 125/002. ot 1380 10026s 1871 11/25/06Z. 6 Be 1000
67 52 | 12532 Gl 1345 1000
ca 1335 125/182. 5 1326 1000T5 H17 | 126002 al 1308 995
82 130 117261067. “ 1295 995
87 1285 126/122. $g 1283 99592 1273 126/182. 8 ti 9959T 1261 127/002. % 1258 %0
103 1246 | 127062 103 1245 990
107 1228 1027/32 106 1229 990
105 1213 127/182. 106 1214 990105 1197 11/28/0072, 106 1198 990)107 1185 11/28/06Z. 107 1185 %0107 1 128/122. 106 171 990
105 1158 128/182. 105 1158 980
102 145 11/29/00Z. 103 145 95
10 Hã4 | 129067 ToL 132 975
101 123 129/122 or 1120 95101 mm 129/182. 100 mi 95
10 110 11/30/0072. 100 1100 95
99 1085 11/30/0672, 9 1086 98599 1065 1/30/32. % 1067 990)10 105 11/30/18Z. 100 1052 90010 1034 | 1201/0z 100 1035 1002
‘Typhoon - 1965
LAT | LON | TIME | WIND¢knots)| Peimb) | Pnímb) | R(km)
</div><span class="text_page_counter">Trang 34</span><div class="page_container" data-page="34">138 1258 115122 35 1253 996
Im 1263 116002. 35 1254 994147 1247 116062. 4 i246 990147 1239 116122. 5s 1240 990
HS 1236 1U16/182. 5s 1238 90
145 1235 I3 60 1237 985146 1235 11/06. 6 Bi 985152 1238 117/122. 1 1238 915154 1238 117182 90 1237 960156 1338 118/002 100 1237 960157 1238 1/1062. 110 1239 950
</div><span class="text_page_counter">Trang 35</span><div class="page_container" data-page="35">mà 1151 112012 s0 1152 365
15 1143 121/18 »% 1 %5
"s mạn 122/002 5 1137 965mì 13 11/29/06Z 15 1129 97510% 125 129/132 70 ti 975
106 1122 Tunas 6 1123 975
104 ma 1/23/02 6 1122 98099 mà 1173067 6 IS 98596 1105 11/28/12 6 1108 985
sả 1104 123/182 s 1102 990
9 1087 rips 5 1092 390
sĩ 1092 1/24/06Z s 1078 3%79 109 I2 3 1062 3982 1056 124/182 40 1048 998sĩ 1035 125/007 + 1035 39
sĩ 1017 11/25/06/ 3% 1030 1000
sĩ 1017 Tas » 1003 100
</div><span class="text_page_counter">Trang 36</span><div class="page_container" data-page="36">+ Water level at boundary is taken from global data sources and using one module inDelft3D to generate water level along the open sea boundaries.
+ Observed water level at Phu Quoc station is used to calibration and verification themodel. The: data will be elaborated later during setting up and simulation,
2.1.3. On land and seabed topography
This data was taken from the project namely KC09.16/11-15 “Marine spatial planningPhu Quoc — Con Dao served for sustainable development” with a map seale of 1/10,000‘on land and seabed nearby the cosatal trip. For deep water, seabed elevation is takenfrom DEM 90m x 90m and general map produced by Viet Nam agencies.
2.2, Model description
2.2.1. Hydrodynamic Model
WL/Delft Hydraulic Institute had developed a unique, fully integrated computersoftware namely Delft3D for a multi- disciplinary approach and these software packageare used to compute for coastal, rive and estuary areas. It can carry out simulation offlows sediment transports, wave, water quality, morphological developments andecology. It has been designed for expert and non- experts alike. The Delft3D softwareis composed of several modules, grounded around a mutual interface, while beingcapable to interact with another. Delft3D- Flow, which this manual is about, is one of
these modules.
Deflt3D- Flow is a multi- dimensional (2D or 3D) hydrodynamic (and transport)
</div><span class="text_page_counter">Trang 37</span><div class="page_container" data-page="37">result from tidal and meteorological forcing on rectilinear or curvilinear, boundary fittedgrid. In 3D simulation, the vertical grid is defined following the sigma co- ordinateapproach,
Storm surge is a long gravity wave with a length scale similar to the size of generatingtropical storm, and last for several hours depending on the size and speed of movement.‘This produces sustained elevation ofthe water surface above the levels caused by normal
astronomical tides, however, its behavior is different in deep water and in shallow in thedeep water, far from a coast, the surface wind stress by a tropical creates a rotatingmound, or vortex, of water by diffusing momentum downward. The ocean elevation issmall, approximately the hydrostatic uplift response to the low central pressure (theinverted barometer effect) and some minor long term Coriolis effect. On entering theshallow water of continental shelf, dynamic effects become pronounced, conservation‘of the potential vortices ofthe mound requires development of marker divergence. Localbathymetry reflection from the coast also contribute to substantially amplify the surgehigh. To calculate the extreme water level a hydrodynamic model Delft 3D- FLOW forcontinental shelf is use.
Basic equation
‘The hydraulic of the continent shelf in the storm conditions is simulated by solving the
system of two — dimensional of shallow water equation that consists two horizontal
‘momentum equation and on continuity equation.Conservation of momentum in x-direction (depth and densi
SN, OH gy yg OM gy LÊB, „8U. ty
uh yy OM jut ey SE
ara Thay Sap ae Ode) pd
Conservation of momentum in y ~ direction (depth and density averaged)
‘The depth and density averaged continuity equation is given by
</div><span class="text_page_counter">Trang 38</span><div class="page_container" data-page="38">Atmospheric pressure gradient
PAA*2 External force by wind \°" "J depth averaged turbulent viscosity
In which:
€ cheesy coefficient 7 water level above a referent level
4 Bottom depth uy depth averaged velocity
F Coriotis parameter Po mass density of water
© Diffusion coefficient (eddy viscosity)
U absolute magnitude of total velocity, Ứ C0 +92)?
is determined by thex. — components of wind shear stress. Wind shear stres
widely used quadratic expression, f=-C:”* where 2 air density; Cd wind drag
coefficient; W wind speed at 10 m above the free surface.
Governing Equation
As mentioned earlier, CFD is numerical simulation of governing phenomena, It isjons each model solves. Delft3D is able to handle bothimportant to realize what equ:
</div><span class="text_page_counter">Trang 39</span><div class="page_container" data-page="39">Cartesian co- ordinates (4:"7) and spherical co -ordinates (4). Transform between
Cartesian and spherical co- ordinates is done with
With Q representing the contributions per un wea due to the discharge or withdrawalof water, precipitation and evaporation
</div><span class="text_page_counter">Trang 40</span><div class="page_container" data-page="40">0=], 4„0401P-E
4: Source of water per unit volume
we Sink of water per unit volume
: Non-local source term of precipitation
: Non —local sink term due to evaporation
</div>