Luận văn thạc sĩ: Modelling storm surge for the north central coast of Vietnam
Bạn đang xem bản rút gọn của tài liệu. Xem và tải ngay bản đầy đủ của tài liệu tại đây (4.14 MB, 101 trang )
<span class="text_page_counter">Trang 1</span><div class="page_container" data-page="1">
THUY LOI UNIVERSITY & UNIVERSITY OF LIEGE
MASTER THESIS
MODELING STORM SURGE
FOR THE NORTH CENTRAL COAST OF VIETNAM
Student’s name: Tran Manh Linh
Co-supervisor: Prof. Jean-Michel Hiver
Université de Liège & Université Libre de Bruxelles
Ha Noi- 2016
</div><span class="text_page_counter">Trang 2</span><div class="page_container" data-page="2">Thereby certify the work which is being presented in this thesis entitled, “Modeling
storm surge for the North central coast of Vietnam” in partial fulfillment of the
requirement for the award of the Master of Coastal Engineering Management andSustainable Hydraulic Structures is an authentic record of my own work carried outunder supervision of Ass. Prof. PRD. Nghiem Tien Lam and Co-supervisor: Prof, Jean-Michel Hiver. The matter embodied in this thesis has not been submitted by me for theaward of any other degree or diploma,
Date: Aug 15,2016
‘Tran Manh Linh
‘Student: Tran Manh Linh ĩ Class: Niche B
</div><span class="text_page_counter">Trang 3</span><div class="page_container" data-page="3">would like to express my sincere gratitude to my advisor Ass. Prof. PhD Nghiem TienLam and Co-supervisor Prof. Jean-Michel Hiver for their guidance, suggestion and
I would like to express my sincere thanks to University Board of Management,
professors and lectures at Department of Marine and Coastal Engineering of Thuy Loi
University and professors and lecturers of the Niche programme and Vietnamese Master Programme for supporting me throughout my study progress.
Belgian-Finally, I would like to express my special appreciation to my friends and colleagues fortheir support, encourage and advices. The deepest thanks are expressed to my familymember for their unconditional loves.
‘Student: Tran Manh Linh ñ Class: Niche B
</div><span class="text_page_counter">Trang 4</span><div class="page_container" data-page="4">1.4 Observation stations and hydrologic conditions
1.5 Historical disasters of typhoons and storm surges.
2.2. Model setup and boundary conditions
22.1 Basic impute data
22.2 The digitalized area
</div><span class="text_page_counter">Trang 5</span><div class="page_container" data-page="5">23.1 Boundary condition and inital condition 2
23.2 The model parameters 31
2.33 Result of model calibration 31
24 Model verification 3
3.52. Sensitivity analysis model s
36 Conclusions 66
Conclusion 6Recommendation 68REFERENCES ©
Student Tran Manh Linh w Chas: Niche B
</div><span class="text_page_counter">Trang 6</span><div class="page_container" data-page="6">APPENDIXES. n
‘Student: Tran Manh Link v Class: Niche B
</div><span class="text_page_counter">Trang 7</span><div class="page_container" data-page="7">LIST OF FIGURES
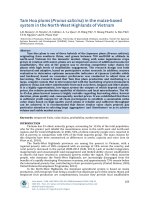
Figure 1-1 Administrative map North Central Coast of Vietnam.
Figure 2-1 Introduction Mike 21
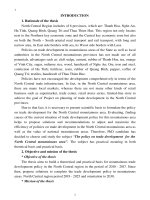
Figure 2-2 Digital elevation model of North central coast of Vietnam in Mike21
Figure malated area
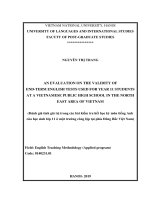
Figure 2-4 Location of simulated area,
Figure 2-5 Hon Dau, Sam Son location on model
Figure 2-6 Diagram of calibration process.
Figure 2-7 Water level in East condition 3/2007
Figure 2-8 Water level in North East condition 3/2007
Figure 2-9 Water level in South East condition 3/2007
Figure 2-10 Comparison of water level at Hon Dau observation station
Figure 2-11 Comparison of water level at Sam Son observation station
Figure 2-12 Water level in East condition 11/2007
Figure 2-13 Water level in North East condition 11/2007
Figure 2-14 Water level in South East condition 11/2007
Figure 2-15 The detail of Manning’s number
Figure 2-16 Comparison of water level in Hon Dau station
Figure 2-17 Comparison of water level in Sam Son station,
Figure 2-18 The detail of Manning's number
Figure 3-1 The track of the storm Damrey (2005).
Figure 3-2 Flood at coastal zone Nam Dinh in the Damrey typhoon (09/2005),
Figure 3-3 The track of the LEKIMA 2007
Figure 3-4 Water level in East boundary condition 9/2005
</div><span class="text_page_counter">Trang 8</span><div class="page_container" data-page="8">Figure 3-5 Wate level in North East condition 9/2005
Figure 3-6 Water level in South East condition 9/2005
Figure 3-7 Pressure in Sep 26 2005 05:00 PM
Figure 3-8 Wind speed in Sep 26 2005 05:00 PM
Figure 3-9 Wind dteeton in Sep 26 2005 05:00 PM
Figure 3-10 Comparison of water level in Hon Dau station in 9/2005
Figure 3-11 Comparison of water level in Sam Son station in 9/2005
Figure 3-12 Pressure in Oct 03 2007 07:00 AM
Figure 3-13 Wind speed in Oct 03 2007 07:00 AM.
Figure 3-14 Wind direction in Oct 03 2007 07:00 AM.
Figure 3-15 Water level in East boundary condition 10/2007
Figure 3-16 Water level in North East boundary condition 10/2007
Figure 3-17 Water level in South East boundary condition 10/2007
Figure 3-18 Comparison of water level in Hon Dau station in 10/2007.
Figure 3-19 Comparison of water level in Sam Son station 10/2007
Figure 3-20 The results of calculation storm surge in typhoon Damrey in 2005.
Figure 3-21 The track of the typhoon Damrey (2005)
Figure 3-22 Storm surge at Hon Dau when change typhoon track
Figure 3-23 Storm surge at Sam Son when change typhoon track
Figure 3-24 Storm surge at Hon Dau station
Figure 3-25 Storm surge at Sam Son station
Figure 3-26 Water level at Hon Dau when change wind speed
Figure 3-27 Water level at Sam Son when change wind speed
Figure 3-28 Models in mike 21 tool box
Figure 3-29 Necessary parameters from the formulas which calculate wind field
</div><span class="text_page_counter">Trang 9</span><div class="page_container" data-page="9">Figure 3-30 Water level at Hon Dau Station
Figure 3-31 Water level at Sam Son station.
Student: Tran Manh Linh viiNiche B
Class:65
</div><span class="text_page_counter">Trang 10</span><div class="page_container" data-page="10">LIST OF TABLES
‘Table 1.1 The water level corresponding to the frequency
Table L2 The water level corresponding to the cumulative frequeney at Hon Da
Table 1.3 Height, length, speed and largest wave period (19561945)
‘able 1.4 Statistics storm in North Central Coast province from 1946 to 2015
Table 2.1 Boundary condition of mode.
Table 2.2 The coordinate of observation stations.
‘Table 2.3 The result of erzor in observation station
Table 2.4 The result of error in observation station
‘Table 3.1 The parameter of storm Damrey 2005
‘Table 3.2 The result of errr in observation stations in Storm Damrey
Table 33 The parameter of storm LEKIMA (2007).
Table 3.4 The result of error in observation station in Storm,
</div><span class="text_page_counter">Trang 11</span><div class="page_container" data-page="11">1. Problem statement
Vietnam is located in the region where the world’s largest storms in the Pacific NorthWest, occur frequently. This is one of the main types of disasters and dangers inVietnam, Annually, about 6 to 10 hurricanes or tropical storms hit the country, Stormsand tide accompanied by heavy rain that causes coastal flooding. In recent times. along
With the effects of climate change, there are many strong storms and super typhoons in
the world causing great damages to people and properties, such as Hurricane Katrina inthe United States in 2005, Cyclone Nargis in Myanmar in 2008, Typhoon Bopha in thePhilippines in 2012,... In particular, the super typhoon Haiyan in 2013 was the mostpowerful storm which hit Philippines with strong winds up to more than Beaufort scale17, caused storm surge up to Tm. It killed! 6000 people and seriously destroyed localinfrastructure.
About 80-90% of the population lives in the coastal plains in Vietnam which are directlyaffected by the storms. In the trend of climate change and global warming, the floodingproblem is becoming more serious in terms of quantity, frequency and intensity.‘Moreover, the occurrence of the typhoon: unpredictable
Every year, hundreds of people are dead or missing, and thousands of people are affectedby storms and floods. Damages to houses, erops and socio-economic are worth upto tenbillions, Coastal areas which are densely populated with developed economics, andtourism are very vulnerable and are of very high risk. These areas ate often threatenedby coastal erosion, dike breaching, flooding or salinity intrusion caused by storms.
In the context of global climate change, many researchers have warned that the storms
will occur more often, and more intensely with stronger winds and heavier rains andstorm surge is greater than by sea level rise. Among the 13 largest super typhoons in theWorld from 1935 to now, 6 new storm occurred since 1998, including 3 hurricanes‘occurring from 2010 to now in the East Sea including Haiyan (2013), Bopha (2012) andMagi (2010). When the air pressure in the center of storm reduces, large wind oftencauses of storm surges which can lead to inundating coastal regions. In addition, storm
‘Student: Tran Manh Link T Class: Niche B
</div><span class="text_page_counter">Trang 12</span><div class="page_container" data-page="12">surges can result in big wave when the storm transfer into the land, destroying sea dikesand coastal works. This then increases the seriousness of the storm.
2, erature review
4) International studies on storm surge
Globally, modeling sea level rise by storms is stil being improved in the 21° century“That the storms caused storm surges phenomenon has been studied in areas of the worldWith different names such as: storms in North America, hurricanes in the Gulf of Mexicoand the East Coast ofthe United States; tropical storms in Europe; and typhoons in Asia
and Oceania. In the first half of the 20" century, scientists have studied storm surges
With existing tools over time: from the simple empirical method based on sparseobservation (Conner et al, 1957; Harris, 1959) to the derivatives which are more‘complicated analysis tools for storms and sea basin, but the value is imited (Proudman,
1954; Doodson, 1956; Heaps, 1965). In the US, Congress has directed the research
instituion of the army and the Weather Bureau conducted in-depth research onhurricanes and storm forecasting methods after the immense damage tothe east coast in1954, This is considered as the beginning of a systematic study of storm surges in NorthAmerica (Murty, 1984). Before the developed model, the monogram was designed topredict surges whenever a typhoon landed on a beach, Conner and the other researchers(1957) has developed a simple model for calculating approximate peak coastal surges,then draw up the largest water-based monitoring pressure data observed at the center ofthe storm to determine the best surges envelope,
‘There are many methods and numerical models which have been used to quantify storm
surges. One of the earliest guidelines developed for this purpose is the hurricane scale
Saffir / Simpson. Hurricane scale Saffir / Simpson is oriented like a comprehensive
guide for the emergency rescue agencies use in case of a storm. However, this approach,
does not reflect the impact of localized factors such as bottom topography changes,shoreline shape, obstructions or other factors to high surges in other locations togetherwhen the storm enter the land,
Harris (1959) have found a systematic variation of surges with two parameters: the‘minimum pressure at the center of the storm and 91.44 m distance from the center of theStudent: Tran Manh Link ? Class: Niche B
</div><span class="text_page_counter">Trang 13</span><div class="page_container" data-page="13">storm to the shore, but concluded that the slope of the continental shelf does not greatlyaffect the water level rise (Harris, 1959; Harris, 1963),
Harris and Telesnianski (1964) gave a two-dimensional hydrodynamic equationslincarized to calculate hydronamic tide when fluid uniform pressure is calculated by the
hydrostatic equation without the surface waves, Jelesnianski (1966) has used a system
‘of linear motion equations without bottom friction to calculate and concluded that theeffect of wind which is 4 times higher than air pressure to water level rise, The largestpeak water levels appeared to speed about 37 mph and the angle between the direction
of the storm moving and perpendicular to the shore line is 65°
Jelesnianski (1972) has used the size ofthe storm as a parameter in his monogram, Themonogram uses the monitoring results and the model number of SPLASH (SpecialProgram to List the Amplitude of surges from Hurricanes), Two versions of this modelare SPLASHI, SPLASH 2 which are developed for designated areas in the Gulf andAtlantic coasts. Although Splash models offer the reliable high water level, but thelimitations ofthis model is only water level for coastal passages Straight shoreline andtopography with little variation, Jelesnianski has concluded that the slope of thecontinental shelf is the main factor affecting water level rise, He remains the wrongconclusion by Harris (1959) into the parameter “distance of 91.44 m of the line from theshore", so this factor does not resolve the variability of bottom topography. Jelesnianskihas mistakenly concluded like other studies from 1950 to 1970 that the impact of stormsize to water level is relatively small, However, recently analysis of historical data ofthe storm along with model simulations demonstrated that the size of the storm hasplayed an important role in the generation of storm surges in coastal areas, particularlyespecially the super strong typhoon moved on very shallow waters (Irish et al, 2008),
In the years from 1950 to 1960, the water level calculation applies only to areas with astraight coa dine with little terrain change. They are the basis for the design ofInfrastructure to avoid the risk of being destroyed by storm surge until the 1970s andmany are still in use today. Since the late 1960s, high-speed computers allowdifferentiation of basic equations on the basis of calculation using structured mesh(usually 12 grid squares) in the 2D model (vertical integration) and then the 3D model.
‘Student: Tran Manh Link 3 Class: Niche B
</div><span class="text_page_counter">Trang 14</span><div class="page_container" data-page="14">This capability climinates the assumption of stable force balance in model (not suitablefor the rapid transformation of the wind in the storm), while the simulation is a balancebetween water flux and the changes in water level in the basin, In the 1980s, the modelSLOSH (the Sea, Lake, and Overland surges from Hurricanes) and NOAA were set and
flooding FI
forecasters still use to predict the water level rise. This is a two-dimensional model
i (1992) completed to calculate and provide maps assessing insurance by
lA (Fe leral Emergency Management agency) and the US weather
which was developed to predict the instantaneous water level rise by the storms‘operating in the coastal waters of the Atlantic, but itis also applied in many parts of the
World b) Studies on storm surge in in Vietnam
In Vietnam, storm surge phenomenon has been studied since the 1970s of the last
‘century, Some authors and works featured include: Le Phuoe Trinh and Tran Ky (1969
- 1970), Nguyen Van Cu (1979), Pham Van Ninh (1982), Do Ngoc Quynh (1982), VụNhu Hoan (1988), Nguyen Ngoc Thuy (1989), Ta Dang Minh (1989), Le Trong Dao(1989), Bui Xuan Thong,
Do Ngoc Quynh and Pham Van Ninh (1995) in Project KT.08.06 had used manynumerical models with different numerical algorithms and developed up 7 finiteAifference schemes including explicit schemes on staggered grids, semi-implicit centraldifference scheme with smoothing, implicit schemes on staggered geids, characteristicmethod. semi-implicit schemes on triangular grid and curvilinear grid. These modelshave been investigated for their stability, conv 'gency, and accuracy compared to someanalytic solutions. Their simulation speed and efficiency have been also investigatedFinally the implicit finite difference scheme with ADI algorithem has been selected. Theresult has provided an overall picture about the possibility of surges has and ean happenfor each latitude along the coast.
Recently, some studies (Bui Hong Long, Nguyen Ky Phung Dinh Van Manb, Nguyen
Tho Sao, Le Trong Dao...) have calculated storm surges using 3D models using 16software either self-developed or commercial ones which numerically solve the basicsystem of equations in spherical coordinates horizontally and sigma stretch coordinatevertically.
‘Student: Tran Manh Link + Class: Niche B
</div><span class="text_page_counter">Trang 15</span><div class="page_container" data-page="15">‘The distribution of wind and air pressure fields in the storm are very important factorsin study of storm surge. The accuracy of the forecast wind and barometric fields play animportant role in the precision of storm surge prediction, Most previous studies haveused empirical formulas to calculate wind and air pressure fields in storms. However,
the wind and pressure fields calculated by these formulas cannot reflect the influences
of the terrain and the effects of air pressure patterns outside the scope of the storm. Onthe other hand the value of the largest wind speed and minimum pressure at the centerOf the storm are often not achieved close to the actual value of the storm,
Currently in Vietnam, the calculation of surges and flooding due to storm surges have‘been made through the mathematical model or software such as MI 21 Flood(Denmark), Sobek2D (Netherlands), ctc...Some examples are the reseach project
“Assessment of risk due to sea level rise in Thua Thien-Hue province and development
‘of decision support system”, preformed by Institute of Mechanics in 2010, the ProjectKC09.23/06-]0 “Assessment the variation of extreme sea water level due to climatechan support marine development strategy” by Univ sity of Science (VNU), or theproject “Estimating coastal flooding risk caused by surge in super typhoons” by Tran“Thục and collaborators carried out in 2014. These are usefull research rest is but still,lacking the level of det Is as well as low map resolution which are not met therequirements on specifie and details for disaster prevention when storms occur‘Therefore, more detail and more specific results of storm surge are nessesary as well asthe specific recommendations for natural disaster prevention. ‘The research on stormsurges and the development flood risk maps duc to super typhoons are especially urgentinthe coastal province of Vietnam.
© Method to calculat storm surge
~ Statistical and field survey methods
‘The method is based on the statistical data of measured water level in the research areaand data on the storm occured at the same time. From the statistical data, the correlationrelationships between storm data and water levels are determined for the study area, In
this method, field survey data is essential. It is required to calibrate and verify the
‘Student: Tran Manh Link 5 Class: Niche B
</div><span class="text_page_counter">Trang 16</span><div class="page_container" data-page="16">accuracy of other methods, However, this method has just been applied to each area ofresearch and it also takes a lot of time to collect data
This is the traditional method to provide relatively positive results, The result of thisapproach is very important. It builds up a database catering for the integrated assessment‘of water level in the research areas and to serve other methods,
~ Empirical formula methods
In this method, the height of storm surge above the average water level is calculatedaccording to the wind speed and the average water depth determined based on long-termaverage water level with or without the tide. The formula has the form:
W?X cosp
as ghk
where: AS (m): Storm surge:
k=2.10-6: A coefficient, value can be adjusted;W (m/s): Wind velocity:
X (im): Fetch length;
@: the angle between the axis perpendicular to the shoreline and winddirection; and
h (m): Water depth.
If the wind speed is about 20 m/s, fetch Iength 100 km, the direction of windperpendicular to the shore, water depth is 20m, we have AS is about 0.4m, in the same\wind conditions, water level higher in smaller depth areas.
‘This formula for the biggest surges is highly probable because the parameters aredefined for stable conditions, Therefore, this formula is used to design because the resultis often greater to ensure the safety of the work
‘Student: Tran Manh Link 6 Class: Niche B
</div><span class="text_page_counter">Trang 17</span><div class="page_container" data-page="17">3. Study objectives
The main objective of this research is to develop a numerical model and to simulatestorm surges for North Central Coast of Vietnam. The model will be used for severing
the predicting storm surge when typhoon occur in the future.
4. Approach and methodology
‘The study objectives can be achieved by using the numerical modeling approach withfollowing steps:
<small>‘Collecting basic data including topographic data, bathymetric data, water level, wind</small>
speed, wind direction, atmospheric pressure and typhoon tracks. The wind data,atmospheric pressure and water level data during typhoon periods can be collectedfrom Vietnam Hydro-Meteorological Services (HMS) which are necessary for model
calibration and validation, The typhoon tracks can be downloaded from Japan
Meteorological Agency (IMA), Typhoon Warning Center (JTWC) and the NationalClimatic Data Center (NCDC). These data include information on time, location oftyphoon eye, maximum wind speed, minimum central pressure, and the moving speedof typhoon centre.
Setting up a 2D hydrodynamic model to simulate water level for non-typhoon
condition. The model will be calibrated and validated for tidal-only conditions using
observed water level
<small>+ Setting up a 2D hydrodynamic model to simulate storm surge. The model will be</small>
calibrated and validated for typhoon conditions using observed water level.
‘Student: Tran Manh Link 7 Class: Niche B
</div><span class="text_page_counter">Trang 18</span><div class="page_container" data-page="18">‘Student: Tran Manh Linh. H Class: Niche B
</div><span class="text_page_counter">Trang 19</span><div class="page_container" data-page="19">1.2 Observation stations and hydrologic conditions1.3 Oceanographic conditions
1.6 Historical disasters of typhoons and storm surges1.7 Conclusions
(CHAPTER 2: MODELLING OF NON-TYPHOON CONDITION2.1 Introduction
2.2 Model setup and boundary conditions2.3 Model calibration
2.4 Model verification2.5 Model results
3.6 Conclusions
CONCLUSIONS AND RECOMMENDATIONS
</div><span class="text_page_counter">Trang 20</span><div class="page_container" data-page="20">CHAPTER1 PHYSICAL SETTINGSLL Geographic conditions
‘The North Central coasl is located in the northern part of Central Vietnam, starting at
south Tam Diep Mountains to northern Hai Van Pass. North Central has an area of
approximately 51 552 km? including 6 provinces: Thanh Hoa, Nghe An, Ha Tỉnh, Quang
Binh, Quang Tri and Thua Thien-Hue The northem North Central borders with northem‘moutains and the Red River Delta, the west borders with Laos, tothe south by the South
Central Coast, and the cast the Bast Sea
‘North Central Region is the transitional zone between the northern economic region andthe southern economic region. The narrowest region is Quang Bình (50km), located on
the trans- Vietnam's traffie which has facilitated economic exchanges between the North
and the South. To the west is the East Truong Son, bordering with Laos with 1,294 km
long border with the gate of Quan Hoa, Lang Chanh (Thanh Hoa), Ky Son (Nghe An),
‘Student: Tran Manh Linh. 10 Class: Niche B
</div><span class="text_page_counter">Trang 21</span><div class="page_container" data-page="21">Huong Son (Ha Tinh province), Lao Bao (Quang Tr), faciliating economic exchangeswith Laos and other Southeast Asian countries on the continent, Towards the East Seais the coastal route about 700 km, with lots of seafood and many deep-water port thatcan form the seaport. North Central is a region with its strategic location that is very
important in fighting, national defense, and protection of the territorial integrity of
a narrow plain, and the western final is the midland mountains of northern Truong Son
‘mountain sierra, Overall the terrain of North Central is complex because the majority ofthe territory is mountains and hills, overlooking the sea, slope, water rapids, which often‘cause sudden floods, leading to difficulties for production and people's life.
1.3 Climatic conditions
North Central is located inthe tropical monsoon atea, so the climate is influenced by thetransition of the North and South. During the year there are two seasons: The rainy withhigh temperature from April to October, and the cold dry seasons from November toApril of the next year. In the rainy season there are many typhoons, high rainfall (over200 mm), and the summer is influenced by the southwest wind blowing from Laos whichTead to large evaporation and severe droughts,
North Central is the region where the climate is the harshest in Vietnam. Annually, thereare more frequent natural disasters such as storms, floods, wind Laos, drought, but theunderlying cause is due to the location and the terrain structure, North Truong Son‘mountain range created walls that stop the winds entering to the North Central
‘Student: Tran Manh Link H Class: Niche B
</div><span class="text_page_counter">Trang 22</span><div class="page_container" data-page="22">~ Blocking the southwest monsoon, causing southwest wind that is hot and dry, blowingdown the coastal plain in the early rainy season (around May to July).
~ Blocking the Northeasterly wind, the humid air masses from the ocean (due to stormactivity topical convergence zone), causing heavy rain in many places.
‘The complexity of the climate leads toa large difference between the temperature of thewinter and summer. The average temperature is about 24.25°C. Climatic conditions ofthe region make it difficult for business activities, especially agricultural production.
1.4 Observation stations and hydrologic conditions
a) Hon Dau Station
‘The water level at Hon Dau is diurnal tide, There are about 25 days per month in which1 time the water level is bi and 1 time is low tide. The tidal range at Hon Dau Stationbig, the great tidal range about 3m to 4m, At high tide the water level which is highestmeasured reaches 421cm (22/10/1985), the lowest level is -3em (02/01/1991).
Base on the highest water level data from 1974 to 2004, calculating the highest waterlevel corresponding to the frequency as the Table 1.1
Table 1.1 The water level corresponding to the frequency(altitude chart system)
</div><span class="text_page_counter">Trang 23</span><div class="page_container" data-page="23">Table 1.2 The water level corresponding to the cumulative frequency at Hon Dau(altitude chart system)
13 | 5 10|20 | 50 | 70 | 90] 95 | 97 | 99H(em)
Htop 383 377 | 362 352 | 338 | 305 | 277 |235 | 225 | 211 | 204Hpottom | 196 180 | 174 156| 134 | 91 | 72 |47 | 40 | 31 | 22Hhour |355 338 | 325 305 | 275 | 195 | 149 | 90 | 71 | 64 | 43
Hmean |230 225 189 | 182| 174 | 171 | 167217 | 210
= Current:
‘The estuarine current area where around Hon Dau oceangeogaraphy directly affected bythe river (Cam River, Bach Dang river, Chanh River...) and tidal current. River flows
have special influence on the general flow of the estuary. In flood season, the water
upstream of the Bridge Ri „ River Trade, Lue Nam River, Red River through Duong.River and Luoc River go to the sea, under the interaction of tide and flood, the water is
pressed at high tide phase and when low tide create the resonance between the tidal
ccurrent and river flow caused huge flow rate
‘The current of coastal areas and estuaries Cat Hai have complex mode that showninteractions river - bottom topography - waves - tides.
‘The influence of wind and wave regime in the winter to Cat Hai coastal areas is not
large. The current regime results from topography factor and fluctuating water levels
(by tides). In the winter, when waves and wind is relatively quiet, the current appears
mainly due to the tidal current and the deference of the water level due to water blockof tidal wave is comered when entering the shore. However, inthe high tide days whenwaves and wind have east or southeast direction, coastal currents caused by the wavesassociated with different types of flows to increase (or decrease) in aggregate flowvelocity of coastal regions.
‘Student: Tran Manh Link 1ã Class: Niche B
</div><span class="text_page_counter">Trang 24</span><div class="page_container" data-page="24">i Hon Dau specific trai of the waves in the Gulf re es Hai Phong. Everyyear, high altitude wave forces on May to September, the highest wave in July and‘September. In winter, the wave height is not high because covered by Cat Ba Island,‘The highest waves which are observed in this season appear only in the direction South,Southeast
Factors extreme waves are observed on the July 03 1964:
<small>Year | 1964 | 1983 [1974 [1959 [1987 [6L | 1961 [i962 | 1962 [i97 | 1983 [i9 | 1968Peiod@ | 9 | 76 [75] 9a fos} ea] | s |?27|%|sz|mịm</small>
Day si |2z |z|zs|[m|s[mpl|zlnlzsl|lsl|3s
Year |I95 [107s [1973 [rose |I957 [rose [toes five |i962 [957 [i96 [1976 |lo6t
b) Sam Son station
Sam Son station lies within the scope of Thanh Hoa coastal area. The tidal mode is mostdiumal tide prevails. Every day, having there are L-time with high water level and 1-time with Jow water level, which take place most days of the month (an average month,‘Student: Tran Manh Link m4 Class: Niche B
</div><span class="text_page_counter">Trang 25</span><div class="page_container" data-page="25">the are 2 tide cycles, cach of which lasts for 14 days). Every month there is a tidalcycle up and down for about 25 days and one day also for a top tide and a bottom tide.Average tidal height in high tide period is about 1.2 to 1.5m, Tidal current speed aroundSam Son Station is quite large.
- Wave
‘Thanh Hoa coast is relatively straight towards the northeast to the southwest / south Without, external shielding island, the coast has low slope, which leads to waves,with long momentum entering the coastal without any obstruction causing strong impact,‘on the coastal or shore protection works.
north-In the winter, from September until March next year, the waves are very rough with‘waves with a height from 0.8m to Im and maximum up to 2.0m to 2.5m. Wave period
is from 75 to 10s, Prevailing wave direction is northeast to the shoreline which creates 4variable angle from 30? - 45°, the frequency is 40%. In October and November wave
combine high tide threatens beaches and shore protection works.
In summer, from May (o October, there are ver y few days high waves, But in thesummer, severe storms often occur causing significant damage to the coast and shore
protection works. The average wave height is from 0.6 - 0.7m, maximum up to 3.0 ~
3.5m. From June to August the prevailing wave southwest direction and wave height(0.6- 0.7m, Most of the summer storms hitting the coast of northern and central provincesare affecting the coast in North Central coast, accompanying typhoon is storm surgesand swells phenomena, When a big storm hit the wave height may reach about 6m.
~ Currents
In the Gulf of Tonkin, the cold water runs to the east after that combining with warmwater flow back to the north, They make a reverse cycle clockwise, Due to thecirculation of the Gulf of Tonkin the seas area around Sam Son station is affected by the
cold water flow towards southwest and south
In cold season: Northeast monsoon and the transitional period the general circulation ofthe Gulf of Tonkin in general and in particular of North Central coastal, coastal currents
‘Student: Tran Manh Link 15 Class: Niche B
</div><span class="text_page_counter">Trang 26</span><div class="page_container" data-page="26">direction north - south (along the North Central coast to the south). Ocean intensity inthis season is enhanced by control of the northeast monsoon, depending on the strength‘or weakness, continuous or interrupted, which leads to the intensity of ocean rise or fall
In hot season: Due to the influence of the southwest wind, coastal currents have oppositedirection compared to the cold season, but the intensity is lower. February to March,North Central often have whirlpool and are concentrated in the north, but in July thisphenomenon going to down the south,
1.5 Historical disasters of typhoons and storm surges
In recent times, under the effects of climate change, there have been many strong stormssuch as Hurricane Katrina hit the United States in 2005, Cyclone Nargis hit Myanmarin 2008, typhoon Bopha hit the Philippines in 2012, hurricanes, eausing great losses oflives and property. In particular, the super typhoon Haiyan in 2013 was the most
powerful storm whi
‘n hit the Philippines with strong winds on level 17 and the waterheight up to 7m. The storm killed more than 6,000 people and seriously destroyedVietnam has more than 3600km coastal line, and the country is located inthe zone whichis directly affected by typhoons that are formed in the Western Pacific and Bast SeaAccording to the data of Disaster Management Unit of project UNDP VIE/97/002 atVietnam, storms begin on early June on the North and are going down to the South inDecember. The number of typhoons also decreases from the North to the South,
From 1954 to now, there are about 30 storms occurring in the Western Pacific each year,
i ng in the East Sea and 4 or 6 typhoons directly affecting
cluding about 10 stonVietnam, There are some years when the hurricane hits Vietnam with more than 10storms such as: 1964 (18 storms), 1973 (12 storms), 1978 (12 storms), 1989 (10 storms)and 1996 (10 storms). Typically, the storm hit northern and central Vietnam, the typhoonhit the southern is less.Hurricane in coastal estuary area often causes high waves, strong winds, and surgessuch as breaking embankments, homes, bed... In the past, the Damrey storm with storm
surge more than 2m in Nam Dinh caused significant damage to the dike system and the
‘Student: Tran Manh Link 16 Class: Niche B
</div><span class="text_page_counter">Trang 27</span><div class="page_container" data-page="27">lives and livelihoods in the region. In the area study and the next area landfall density isquite high compared to other coastal provinces.
According to the Table 1.4, from 1946 to 201 there are 69 typhoons hitting to NorthCentral coastal. It is the region with greater frequency of storms with the rate on 30% of
the storm, focusing primarily on the provinces of Thanh Hoa, Nghe An, Ha Tỉnh.
Table 1.4 Statistics storm in North Central Coast province from 1946 to 2015
No. | Name of storm Type Date1 Jm0 Typhoon 7-14 SEP 1946
2 | #20 Typhoon 29 OCT-04 NOV 19473 [Hs Typhoon 30 AUG-04 SEP 1951
4 | #20 Super Typhoon 21-31 OCT 1952s #20 Super Typhoon 25 OCT-02 NOV 1953
6 | #10 ‘Typhoon 12-16 AUG 19537 Jma Typhoon 30 SEP-13 OCT 1954
8 (#4 Super Typhoon 16-26 SEP 1955
9 | #5 ‘Typhoon 05-08 JUL 195610_| #10 Typhoon 25 AUG-02 SEP 1956
[#17 Super Typhoon 16-26 OCT 1956
l2 [#22 ‘Typhoon 02-13 OCT 19603 J3 Typhoon 08-17 OCT 1960[#7 Typhoon 22-25 JUN 196115 [#19 Typhoon 19-23 SEP 1962l6 [#13 Typhoon 01-09 SEP 19631 |#2 Typhoon 13-23 SEP 196418/23 Typhoon 14-15 SEP 196419 [#27 Typhoon 02-08 OCT 196420_(| #4 Typhoon 08-11 JUL 196921 [#10 Typhoon 31 AUG-03 SEP 1969
2 [#18 Super Typhoon 14-25 OCT 197023 [#23 Super Typhoon 14-22 NOV 1970
24 [m2 ‘Typhoon (02-07 JUL 197135 [#ms Typhoon 09-18 JUL 197126 |#a0 Typhoon 27-30 SEP 197127_| #30 Typhoon 03-09 OCT 197128 | #24 Typhoon 30 SEP.04 OCT 1972?9 [#2 Typhoon 05-10JUL 197330 [#l6 Typhoon 11-16 SEP 1973
a1 [#19 Super Typhoon 06-15 OCT 1973
‘Student: Tran Manh Link 7 Class: Niche B
</div><span class="text_page_counter">Trang 28</span><div class="page_container" data-page="28">No. | Name of storm Type Date
32 [#6 Typhoon 07-14 TUN 197433 | #26 Typhoon 08-14 OCT 197434_| #28 Typhoon 20-27 OCT 197435 #13 Typhoon 15-21 SEP 197536 |#18 Typhoon 13-16 SEP 1980.37_| #6 Typhoon 28 JUN-05 JUL 198138 | #24 Typhoon 10-18 OCT 198239 #17 Typhoon 22-26 OCT 1983,
40 #19 Typhoon 27 SEP-02 OCT 1985
4 Jưới ‘Super Typhoon 11-21 OCT 1985
4 J2 Typhoon 12-16 OCT 198543 [mã Typhoon 16 AUG-06 SEP 1986
44 [49 ‘Super Typhoon 07-17 AUG 1987
45 [m0 Typhoon 07-24 AUG 1987
46 [#26 ‘Super Typhoon 28 SEP-10 OCT 1989
47_| #27 Typhoon 28 SEP-03 OCT 198948_ [#29 Typhoon (06-13 OCT 1989
4o [#30 ‘Super Typhoon 13-22 OCT 1989
50_| #16 Typhoon 20-30 AUG 1990,sĩ [#19 Typhoon 07-20 SEP 1990.5 m2 Typhoon (08-18 AUG 199153 J#8 Typhoon (04-13 JUL 1993s4_[ #13 Typhoon 21-31 AUG 1995,55_| FRANKIE Typhoon 21-24 JUL 199656__[ Niki Typhoon 18-23 AUG 1996s7_| WILLIE Typhoon 16:23 SEP 199658__| BETH Typhoon 13-21 OCT 199659 | FRITZ Typhoon 20-25 SEP 199760 | WUKONG Typhoon (04-10 SEP 2000.61_| KONI Typhoon 18-22 JUL 200362_ | DAMREY Typhoon 21-27 SEP 2005
63 | KALTAK Typhoon 28 OCT-02 NOV 2005
64 | XANGSANE __ | Super Typhoon 25 SEP-30 SEP 2006
65_ | LEKIMA Typhoon 29 SEP-04 OCT 2007
66 | #19 ‘Super Typhoon 27 SEP-14 OCT 2009
67_| NOCK_TEN Typhoon 24-30 JUL 201168_| WUTIP Typhoon 26-30 SEP 201369 [NARL Typhoon (09-15 OCT 2013
‘Student: Tran Manh Link H3 Class: Niche B
</div><span class="text_page_counter">Trang 29</span><div class="page_container" data-page="29">16 Conclusions
With the tremendous harm to human and material caused by storm surge, forecastingsurges become an important task of the meteorological sector, particularly to areaswhich have ‘greater frequency of storms like North Central Vietnam. The research“Modeling storm surge for the North Central Coast of Vietnam” will be carried out tomake a numerical modeling to calculate the height of storm surge atthe central coast ofVietnam which is often affected negatively by storms. The results will be used to servethe expectance in cases of response to disaster. The question is how to prevent tominimize adverse impacts by storm surge. Moreover, the issue of enhancing theaccuracy of forecast models has always been of interest and research,
In many methods and mathematical models, Mike 21 Flow Model FM model is a model‘of modem, dedicated, result in rising water features stability and accuracy. This isthe
patter of trade and have been used in many research projects in Vietnam and the world
With the help ofthe project "Building up flood map due to storm surge in super 2016" this research have used this software
typhoon-‘Student: Tran Manh Link m Class: Niche B
</div><span class="text_page_counter">Trang 30</span><div class="page_container" data-page="30">CHAPTER2 MODELLING OF NON-TYPHOON CONDITION21 Introduction
2.1.1 Introduction model MIKE 21
Vietnam has about 1,000,000 km? of sea surface, 3260 km of coastline; it is an
‘opportunity for developing economy in coastal zones. According to stategy to 2020,
Vietnam is a sea country, and coastal activities will account for 54 per sent of GDP.
Beside the opportunities, Vietnam has to withstand several typhoons which lead tobreaking sea dykes, floor and economic damage. To prevent and reduce hazard due totyphoon, studying and choosing solution to protect for each area that become moreimportant and essential.
From wind field transferring on the sea, we can know which areas are affected fromstorm surge the most; hence, there will be solution to protect or strengthen the area. So
calculating storm surge in the area by 2D model is a opimun method.
Mike software is software package of DHI Water & Enviroment applyied hydraulic,
sources and enviromental simulation, including river, river mount, sea and coastal zone.
‘The software package has been utilized rather effectively in different countries.
Student: Tran Manh Linh 20 Class: Niche B
</div><span class="text_page_counter">Trang 31</span><div class="page_container" data-page="31">In Mike 21 model package, there are modules, such as Hydrodynamic (HD); Transport(TR); ECO Lab (EL); Mud Transport (MT); Sand Transport (ST , and the masterresearch mainly applies the module: Module Flow Model FM.
In all module of Mike 21, Hydrodynamic HD is basic module. It provides the regime of
hydrodynamic that is foundation for calculation process of other modules.
2.1.2 Module Mike2l FM
Mike 21 FM which is new model system in untilizing flexible gird node, is developedby DHI Water & nviroment. The model system is developed for studying about seaand envirironment of coastal zone. The model consists of continunity equation, momentequation, concentration equation, salt equation.
‘The Mike 21 consists of all modules as
* Hydrodynamic Module« Sediment transport module* Ecological Module
+ Observation point module
Hydrodynamic Module is the basic ingredient of mike 21FM system model, providingbasic hydraulic mode for area calculation,
General description
2D Shallow water equation of Basic hydrodanamie module is a combination of theaverage of Navier- Stoke and Renold coefficient, It consists of continuity, temperature,salll, concentration and momentum equation,
Storm surge can be presented by the 2DH hydrodynamic equations for long waves inshallow water. It includes the continuity equation presenting the mass conservation lawand momentum equations for the x- and y-ditections presenting the momentumconservation law.
“The continuity equation
ên „ Ê(ha) _ a(hv)
at ex Oy
Student: Tran Manh Link 3ï Chass: Niche B
a
</div><span class="text_page_counter">Trang 32</span><div class="page_container" data-page="32">oo 8H & © M ( & d0)
tte (s)
X,y Cartesian co-ordinates in the horizontal directions (mn)
‘water surface elevation above the reference level (datum) (mm)total water depth, h=d +n (m)
‘water depth below the reference level (datum) (m)depth-averaged flow velocity in x direction (m/s)
depth-averaged flow velocity in y direction (m/s)
rate of inflow (môisim)
Coriolis parameter (inertial frequency) (1/5)acceleration due to gravity (avs*)
Tact internal stress components (m/s?)
‘The momentum equations include terms presenting the inertial term (1), convectiveterms (2,3), Coriolis term (4), gravity term (5), pressure term (6), friction term (7), freesurface stress term (8), short wave influence (9), and internal stress term (10).
‘The pressure term (6) a counts for the influence of atmospheric pressure
</div><span class="text_page_counter">Trang 33</span><div class="page_container" data-page="33">Where p, is the atmospheric pressure (Nim). The distribution of atmospheric pressurefield in a typhoon can be presented by the typhoon air pressure models of Bierknes
(1921), Takahashi (1939), Fujita (1952), Mayers (1954) and Jelesnianski (1965).
‘The friction term accounts for the bottom friction (7)
Co wind dag coefficient (dimensionless)
V_ the wind speed at 10 m above the surface, v = Jÿ? +Vy (ws)
VisVj_ wind speed components in x- and y-directions (m/s)
‘The variation of wind field in a typhoon can be presented by the typhoon wind modelssuch as the Modified Rankine vortex model (1947), Holland (1980), DeMaria (1992),Fujita (Tan, 1992), and SLOSH (Jelesnianski et al, 1992; Houston and Powell, 1994).
‘The short wave influence (9)
Where So, Si Syy are radian stresses in x- and y-ditections (ky/s#). These quantitiescan be computed by a wave model likes SWAN.
‘The internal stress term (10)
‘Student: Tran Manh Link 3 Class: Niche B
</div><span class="text_page_counter">Trang 34</span><div class="page_container" data-page="34">where e is the horizontal eddy diffusion (m/s)
‘The system of equations (1) to (3) can be solved numerically by a finite difference
method (FDM), a finite element method (FEM) or @ finite volume method (FVM).Boundary conditions are required for the model. Mode! boundary locations should beselected far enough from the interested area atthe places where there is almost no stormsurge influence. Therefore, only tidal levels can be used as model boundary conditions.The tidal level can be computed based on tidal harmonic constants, Together withparameters of the models presenting typhoon pressure and wind fields, the abovecoefficients of Chézy roughness coefficient (C), wind drag coelfieient (C.), eddydiffusion icient (2) are model parameters and can be changed during modelcalibration process,
‘There are many modeling software available that can be used to solve these above‘equations including sophisticated commercial models like Delft3D, MIKE 21, SMS,
“The advantages of these models are stable, reliable, and easy to use because they are
‘equipped with graphical user interface (GUD) and pre- and post-processing software.‘The disadvantages of the models are that they are not always available, expensive andare not allowed to change the computational code. Beside of these, there are also many‘open source modeling codes such as POM, ECOMSED, HAMSOM. These models arefree and allowed to modify computational code if necessary,
2.2 Model setup and boundary conditions
In regard with rule of application, each model has to follow 3steps:
= Setup model: in this step, the model is set up, simulate real condition withboundary in a specific time to find out the parameters for the model
Verification: assess the realization of the model,
~ Using the model to simulate different scenarios for the system
‘Student: Tran Manh Link BE Class: Niche B
</div><span class="text_page_counter">Trang 35</span><div class="page_container" data-page="35">The basic data for calculation.
2.2.1 Basic impute data
a. Topography.
‘The topography used in the research is surveyed under the project name “Building up
flood map due to storm surge in super typhoon-2016” with map scale 1/10000. It is
displayed in the study area as Figure 2-2.
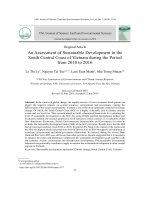
Distant ve
Figure 2-2 Digital elevation model of North central coast of Vietnam in Mike21
In the North central coast of Vietnam, the topography has relatively shallow continental
shelf. The coastline has complex geographic features such as estuaries, lowland and
mountains. In general, the shoreli © is rather flat and the slope is gentle, The depthcontour line of 10 m and 50 m is far from the shore and these characterisics support thedevelopment of high storm surge. The topographic depth increases from north to south.
‘Student: Tran Manh Link 3 Class: Niche B
</div><span class="text_page_counter">Trang 36</span><div class="page_container" data-page="36">b. The oceanographic data.Boundary condition,
= Observation station is the station that is collected in the project “Building up
flood map due to storm surge in super typhoon-2016"+ Analyzing data
Hydrological data consist of water level and discharge; they are observed in stations thathave to follow the national elevation
“The study is based on using the numerical model (Mike 21) to simulate surge of suppertyphoons, so calibration and verification have to define the accurate parameters to applyfor real problem.
2.2.2 The digitalized area.
a, The simulated area.
Based on tophography and other documents as the simulated area of North central coast
of Vienamis s sted as Figure
"7 `
sessl....l|....l|... MÓP v... š
<sub>moi Be</sub>Figure 2.3 Simulated area
‘Student: Tran Manh Link 26 Class: Niche B
</div><span class="text_page_counter">Trang 37</span><div class="page_container" data-page="37">Domain properties, grid computing: Is set for North central coast, in the model‘coordinates are converted on the WGS 1984 UTM Zone 48N. Grid computing in thenear shore was subdivided small to inerease accuracy when calculating and graduallyincrease from shore to offshore to reduce computing time which does not influence
‘muchon the accuracy of the modelb, Boundary conditions
‘The boundary ofthe model include 3 tidal boundaries are tide Northeast, East, Southeast
and I shoreline that is shown on Figure 2-4 Figure 2-4, The water level data of the
boundaries are generated from the module tool box Tidal mike 21- Tide prediction ofHeights.
Table 2.1 Boundary condition of model
Start point End Point ‘
Boundary P Number
Longitude | Latitude | Longitude | Latitude | of points
Bast | 1079999 20) 107.1365] 20863 66Nonh East | 107.968] 17.9683 | 1079999 20 28South East | 107.0979 | 17.0979] 107968) 179683 32
1950000 sm Eam
‘Land boundary
Figure 2-4 Location of simulated area
‘Student: Tran Manh Link 7 Class: Niche B
</div><span class="text_page_counter">Trang 38</span><div class="page_container" data-page="38">¢. Observation station
Due to the real data collection, the study selects 2 stations for the calibration andverification model. The water data of 2 stations are got from the project “Building upflood map due to storm surge in super typhoon-2016”. The coordinate of station shows‘on Table 2.2 and station’s location on the map shows on Figure 2-5.
Table 2.2 The coordinate of observation stations
No Observation station Coordinates (m)
‘Student: Tran Manh Link 28 Class: Niche B
</div><span class="text_page_counter">Trang 39</span><div class="page_container" data-page="39">calibration process that is refered to collecting data, and assessing realization over dataof station by gradual testing method.
ume model <sub>Run model</sub>
measured and model jill
Figure 2-6 Diagram of calibration process
‘The calibration process follows 3 steps as:
‘Step 1: Assmussing parameters, intial condition,
‘Step 2: Running the model with the relevant parameters
step 3: Comparing the result of model with real data, If not come back step 1
Comparing is excuted by visuafation( Comparing mode đau and read
date), simultaneously combine with Nash coefficient to check.
In which: observed data.
Xs: is simulated model data.X, 1 is the average of real data.2.3.1 Boundary condition and initial condition
‘The boundary conditions of the hydrodynamic model are the agent which determines
the motion of the sea. In land boundary, the velocity components obtained zero, The
model allows the use of different boundary conditions atthe liquid boundary including
‘water level fluctuations or velocity and river traffic from flowing into the study area. On
‘Student: Tran Manh Linh. E1 Class: Niche B
</div><span class="text_page_counter">Trang 40</span><div class="page_container" data-page="40">the surface is distributed in space and time of the wind, the atmospheric pressure, Thereare 3 liquid boundaries in model: East, Northeast, and Southeast. Tide oscillations in theTiguid boundary are created with module Mike 21 tool box and put on the model by file‘dfs. Flow speed and water level were equal to 0 at the beginning,
2o 01a. ‘Time S0 „
Figure 2-7 Water level in East condition 3/2007
‘Student: Tran Manh Linh 30 Class: Niche B
</div>