Basics of oil spill cleanup ppt
Bạn đang xem bản rút gọn của tài liệu. Xem và tải ngay bản đầy đủ của tài liệu tại đây (14.23 MB, 236 trang )
©2000 by CRC Press LLC
This book contains information obtained from authentic and highly regarded sources. Reprinted material
is quoted with permission, and sources are indicated. A wide variety of references are listed. Reasonable
efforts have been made to publish reliable data and information, but the author and the publisher cannot
assume responsibility for the validity of all materials or for the consequences of their use.
Neither this book nor any part may be reproduced or transmitted in any form or by any means, electronic
or mechanical, including photocopying, microfilming, and recording, or by any information storage or
retrieval system, without prior permission in writing from the publisher.
The consent of CRC Press LLC does not extend to copying for general distribution, for promotion, for
creating new works, or for resale. Specific permission must be obtained in writing from CRC Press LLC
for such copying.
Direct all inquiries to CRC Press LLC, 2000 N.W. Corporate Blvd., Boca Raton, Florida 33431.
Trademark Notice:
Product or corporate names may be trademarks or registered trademarks, and are
used only for identification and explanation, without intent to infringe.
© 2001 by CRC Press LLC
Lewis Publishers is an imprint of CRC Press LLC
No claim to original U.S. Government works
International Standard Book Number 1-56670-537-1
Library of Congress Card Number 00-056583
Printed in the United States of America 1 2 3 4 5 6 7 8 9 0
Printed on acid-free paper
Cover photo
Tugboats surround the
Sea Empress
— grounded and leaking oil — in an attempt
to refloat the stricken ship at high tide off the coast of England. (Oil Spill
Response Limited)
Library of Congress Cataloging-in-Publication Data
Fingas, Mervin
Basics of oil spill cleanup / written by Merv Fingas; edited by Jennifer Charles;
2nd ed.
p. cm.
Includes bibliographical references and index.
ISBN 1-56670-537-1 (alk. paper)
1. Oil spills. 2. Oil spills Canada. I. Charles, Jennifer.
TD427.P4 F55 2000
628.1
′
6833 dc21 00-056583
CIP
L1537/fm/frame Page 4 Thursday, April 26, 2001 11:16 AM
©2000 by CRC Press LLC
Preface
This book is a revised and expanded edition of
The Basics of Oil Spill Cleanup
,
which was published by Environment Canada in 1978. With the rapid progress in
cleanup technology since that time, this edition is long overdue. This new edition
is designed to provide a broad knowledge of the cleanup and control of oil spills.
It is aimed at both the general public and those who actually deal with the cleanup
of oil spills, although it is not intended to serve as a field manual. The cleanup of
oil spills that occur on water is emphasized
,
since these spills spread most rapidly
and cause the most visible environmental damage.
The book deals primarily with crude oils and petroleum products derived from
crude oils. In addition to cleanup techniques, it covers how oil spills are measured
and detected
,
and the properties of the oil and its long-term fate in the environment.
The effects of an oil spill on the environment and the effectiveness of cleanup and
control vary significantly with the type of oil spilled. The types of oil are reviewed
to help the reader understand the different cleanup and control measures needed for
different types of oil and environmental circumstances. A glossary of technical terms
is provided at the back of the book.
The final chapter of the book, which deals with
the effects of oil spills on the
environment and wildlife, has been added to this edition to provide a brief summary
of this important topic. Because the effects of oil on the environment are serious
and determine how and why we clean up spills, a summary of this topic seems an
appropriate way to end this volume.
L1537/fm/frame Page 6 Thursday, April 26, 2001 11:16 AM
©2000 by CRC Press LLC
Introduction
Chapter 1 explains why oil spills happen and analyzes statistics on how often
and where they occur. This includes a summary of Canadian spills, sources of oil
spills into the seas worldwide, and a list of the largest oil spills that have occurred
in the last 30 years.
Chapter 2 deals with planning the response to an oil spill and the functions of
oil spill response organizations in industry and government. Topics covered include
contingency plans, training, the structure of response organizations, the duties of the
on-scene commander and response team, oil spill cooperatives, and the role of other
organizations and contractors in oil spill cleanup.
The chemical composition and physical properties of the different types of oil
are described in Chapter 3. The oils that are used in this book to illustrate the fate,
behaviour, and cleanup of oil spills are introduced. These represent the primary oil
and petroleum products used and spilled. They are: gasoline, diesel fuel, a light
crude oil, a heavy crude oil, an intermediate fuel oil (IFO) which is made from a
heavy residual oil and diesel fuel, a residual oil, sometimes called Bunker fuel, and
crude oil emulsion.
When oil spills on water, various transformation processes occur that are referred
to as the “behaviour” of the oil. Two types of transformation processes are discussed
in Chapter 4. The first is weathering, with emphasis on evaporation, the formation
of water-in-oil emulsions, and natural dispersion, and the second is a group of
processes related to the movement of oil in the environment. Spill modelling, wherein
the behaviour and movement components of an oil spill are simulated using a
computerized model, is also discussed.
Chapter 5 reviews the technologies used to detect and track oil slicks. This
includes both surface techniques and remote sensing techniques from aircraft and
satellites, which are especially useful when oil is difficult to detect, such as at night,
in ice, or among weeds. The analysis of samples to determine the oil’s properties,
its degree of weathering, its source, or its potential impact on the environment is
also discussed.
The most common way to contain oil on water is to use devices known as booms.
Chapter 6 covers the types of booms, their construction, operation principle, and
uses, as well as how and why they fail. It also covers ancillary equipment used with
booms, sorbent booms, and special-purpose and improvised booms.
Chapter 7 summarizes methods to physically recover oil from the water surface,
usually after it has been contained using booms. Devices known as skimmers are
available to recover oil. The effectiveness and advantages and disadvantages of
various types of skimmers are discussed. The use of sorbents, material that absorbs
the oil, is also reviewed. In some cases, the oil is recovered manually, and often all
of these approaches are used in a spill situation. Each method has limitations,
depending on the amount of oil spilled, sea and weather conditions, and the geo-
graphical location of the spill.
Storage, separation of oil from water and debris, and disposal of the oil are
crucial parts of a cleanup operation. Chapter 8 covers temporary storage, separation,
L1537/fm/frame Page 8 Thursday, April 26, 2001 11:16 AM
©2000 by CRC Press LLC
and disposal, as well as the types of pumps used to move the oil from one process
to another.
Treating the oil with chemical agents is another option for cleaning up oil spills
on water. The use of these agents is discussed in Chapter 9. Dispersants are agents
that promote the formation of small droplets of oil that disperse throughout the water
column. Their effectiveness, toxicity, and application are reviewed. Other agents
discussed are surface-washing agents or beach cleaners, emulsion breakers and
inhibitors, recovery enhancers, solidifiers, sinking agents, and biodegradation agents.
In-situ
burning is an oil spill cleanup technique that involves controlled burning
of the oil at or near the spill site. The advantages and disadvantages of this technique
are discussed in Chapter 10, as well as conditions necessary for igniting and burning
oil, burning efficiency and rates, and how containment is used to assist in burning
the oil, and to ensure that the oil burns safely. The air emissions produced by burning
oil are described and the results of the many analytical studies into these emissions
are summarized.
Oil spills on shorelines are more difficult and time-consuming to clean up than
spills in other locations, and cleanup efforts on shorelines can cause more ecological
and physical damage than if the removal of the oil is left to natural processes. Chapter
11 discusses the important criteria that are evaluated before deciding to clean up
oil-contaminated shorelines. These criteria include the behaviour of oil in shoreline
regions, the types of shorelines and their sensitivity to oil spills, the assessment
process, shoreline protection measures, and recommended cleanup techniques.
While oil spills on land are easier to deal with and receive less media attention
than spills on water, oil spills on land make up the vast majority of oil spills in
Canada. Chapter 12 describes the varying effects and behaviour of oil on different
habitats and ecosystems. Spills that occur primarily on the surface of the land and
those that occur partially or totally in the subsurface, and the different containment
and cleanup methods for each type of spill are outlined.
Chapter 13 reviews the many and varied effects of oil on different elements of
the environment and summarizes the state of the art in assessing the damage caused
by oil spills. The effects of oil on various organisms in the sea are discussed, as
well as effects on freshwater systems, life on land, and the effects of oil spills on
birds.
L1537/fm/frame Page 9 Thursday, April 26, 2001 11:16 AM
©2000 by CRC Press LLC
About the Author
Merv Fingas, M.Sc., Ph.D., has worked for more than 25 years in the field of oil
spill technology at Environment Canada’s Environmental Technology Center in
Ottawa, Ontario. As head of the Emergencies Science Division at the Centre, he
currently conducts and manages research and development projects in the sciences
as they relate to spill measurement, evaluation, and control. His specialties include
spill dynamics and behaviour, studies of spill-treating agents,
in-situ
burning of oil
spills, and the technology of personal protection equipment. He is called upon to
make presentations on these subjects at international conferences around the world.
Dr. Fingas earned his doctorate in environmental sciences from McGill Univer-
sity in Montreal, Quebec. He also holds master’s degrees in science and business
administration from the University of Ottawa in Ontario, as well as a bachelor of
arts degree and technical training in machining and electronics.
Dr. Fingas has authored or co-authored more than 450 technical reports and
papers on various aspects of oil spill research. These include writings on the devel-
opment of new and improved procedures for testing dispersants and extracting
solvents, studies of water-in-oil emulsions and dispersants, monitoring oil spill
concentrations, identifying the source of oil spills, studies of chemical treating agents
and their effectiveness,
in-situ
burning of oil spills and the emissions from such
fires, oil spill remote sensors, and the review and selection of personal protection
equipment.
Dr. Fingas is on the editorial board of the
Journal of Hazardous Materials
, the
Spill Science and Technology Bulletin
, and the
Journal of Micro-Column Separa-
tions,
and has served as guest editor for several special issues of these publications.
In 1999, he was appointed to the United States Academy of Sciences and is a member
of an eight-person committee to review the sources, fate, and effects of oil in the
sea. He is vice-chairman of the American Society for Testing Materials (ASTM)
F-20 Committee on Spill Standards, and chairman of the
In-situ
Oil Spill Burning
Committee.
L1537/fm/frame Page 10 Thursday, April 26, 2001 11:16 AM
©2000 by CRC Press LLC
Acknowledgments
Major funding for the second edition of the Basics of Oil Spill Cleanup was
provided by the Emergencies Science Division, the Environmental Emergencies
Division, and Atlantic Region, Ontario Region, and Pacific & Yukon Region of
Environment Canada. Additional funding was also provided by the United States
Minerals Management Service and the Canadian Coast Guard.
The author gratefully acknowledges the following people for detailed review of
the text: Dagmar Etkin of Environmental Research Consulting for Chapter 1, Ed
Owens of Owens Coastal Consulting for Chapters 11 and 12, Sandra Blenkinsopp
of the Emergencies Science Division and Ken Lee of the Department of Fisheries
and Oceans for Chapter 13, and Ron Goodman of Imperial Oil for a final check on
the entire manuscript.
Among those who provided photographs for this publication are Joe Smith of
FOSS Environmental Services in Seattle, Debra Simcek-Beatty of the National
Oceanic and Atmospheric Administration (NOAA) in Seattle, Ed Owens of Owens
Coastal Consulting in Bainbridge Island, Washington, Al Allen of Spiltec in Wood-
inville, Washington, Hartec Management Consultants in Anchorage, and Oil Spill
Response Limited in Southampton, UK.
The text was edited by Jennifer Charles of Environment Canada’s Emergencies
Science Division. Illustrations were provided by Lauren Forgie of Post-Modern
Designs, Ottawa, Ontario and Paul Perreault, PeRO Design, Arnprior, Ontario.
Many others, too numerous to list here, provided comments, support, advice
,
and encouragement and the author gratefully acknowledges their contributions.
L1537/fm/frame Page 12 Thursday, April 26, 2001 11:16 AM
©2000 by CRC Press LLC
Contents
Chapter 1
Oil Spills: Why Do They Happen and How Often?
Chapter 2
Response to Oil Spills
Chapter 3
Types of Oil and their Properties
Chapter 4
Behaviour of Oil in the Environment
Chapter 5
Detection, Analysis, and Remote Sensing of Oil Spills
Chapter 6
Containment on Water
Chapter 7
Oil Recovery on Water
Chapter 8
Separation and Disposal
Chapter 9
Spill-treating Agents
Chapter 10
In-situ Burning
Chapter 11
Shoreline Cleanup and Restoration
Chapter 12
Oil Spills on Land
Chapter 13
Effects of Oil Spills on the Environment
Glossary
L1537/fm/frame Page 14 Thursday, April 26, 2001 11:16 AM
List of Figures
1. Summary of typical annual Canadian spills
2. Summary of spills into navigable waters
in U.S. (typical annual spills)
3. Statistical summary of sources of oil into the seas worldwide
4. Structure of a typical response organization
5. Chemical compounds in oils
6. Evaporation rates of different types of oil at 15
°
C
7. Appearance, spreading, and evaporation loss of various oils
spilled on an absorbent surface and in a beaker
8. Comparison of spreading of different oils and fuels
9. Effect of different wind and current directions on the
movement of an oil slick
10. Outputs from a typical spill trajectory model
11. Chromatogram of a light crude oil
12. Appearance of oil on a calm water surface
13. Basic boom construction
14. Typical containment booms
15. Using booms for deflection
16. Configurations for boom deployment
17. Boom failure modes
18. Bubble barrier
19. Improvised dam used as a boom with underflow
20. Improvised boom with underflow
21. Oleophilic skimmers
22. Weir skimmer
23. Suction skimmers
24. Elevating skimmers
25. Submersion skimmer
26. Operating principles of pumps
27. Typical relationship between dispersant amount and sea energy
28. Fire-resistant boom designs
29. Shoreline profiles
30. Penetration of oil into soil
31. Subsurface movement
L1537/fm/frame Page 16 Thursday, April 26, 2001 11:16 AM
©2000 by CRC Press LLC
List of Tables
1. Major Spills
2. Contents of Typical Contingency Plans
3. Elements of Sensitivity Maps
4. Typical Composition of Some Oils and Petroleum Products
5. Typical Oil Properties
6. Deflection Angles and Critical Current Velocities
7. Performance of Typical Skimmers
8. Performance of Some Sorbents
9. Typical Dispersant Effectiveness
10. Effectiveness and Toxicity of Some Surface-Washing Agents
11. Effectiveness and Toxicity of Some Emulsion Breaking
or Inhibitor Agents
12. Effectiveness and Toxicity of Some Solidifiers
13. Emissions from Burning and Evaporating Oil Slicks
14. Cleanup Techniques and Shoreline Types
15. Properties of Different Oils and their Effect on the Environment
16. Estimated Recovery Times in Various Habitats
17. Cleanup Methods for Surface Land Spills
18. Cleanup Methods for Subsurface Spills
19. Aquatic Toxicity of Water-Soluble Fractions of Common Oils
L1537/fm/frame Page 18 Thursday, April 26, 2001 11:16 AM
©2000 by CRC Press LLC
CHAPTER
1
Oil Spills: Why Do They
Happen and How Often?
Major oil spills attract the attention of the public and the media. In recent years,
this attention has created a global awareness of the risks of oil spills and the damage
they do to the environment. However, oil is a necessity in our industrial society, and
a major sustainer of our lifestyle. Most of the energy used in Canada and the United
States is for transportation that runs on oil and petroleum products. According to
trends in energy usage, this is not likely to decrease much in the future. Industry
uses oil and petroleum derivatives to manufacture such vital products as plastics,
fertilizers, and chemical feedstocks, which will still be required in the future.
In fact, the production and consumption of oil and petroleum products are
increasing worldwide and the threat of oil pollution is increasing accordingly. The
movement of petroleum from the oil fields to the consumer involves as many as 10
to 15 transfers between many different modes of transportation including tankers,
pipelines, railcars, and tank trucks. Oil is stored at transfer points and at terminals
and refineries along the route. Accidents can happen during any of these transpor-
tation steps or storage times.
Obviously, an important part of protecting the environment is ensuring that there
are as few spills as possible. Both government and industry are working to reduce
the risk of oil spills, with the introduction of strict new legislation and stringent
operating codes. Industry has invoked new operating and maintenance procedures
to reduce accidents that lead to spills. Intensive training programs have been devel-
oped to reduce the potential for human error.
There are also many deterrents to oil spills, including government fines and the
high cost of cleanup. In Canada, it costs an average of $20 to clean up each litre of
oil spilled. In the United States, these costs average about $100 per litre spilled. The
average cost of cleanup worldwide ranges from $20 to $200 per litre, depending on
the type of oil and where it is spilled. Cleaning up oil on shorelines is usually the
most expensive cleanup process.
©2000 by CRC Press LLC
How Often Do Spills Occur?
Oil spills are a frequent occurrence, particularly because of the heavy use of oil
and petroleum products in our daily lives. About 260,000 tons of oil and petroleum
products are used in Canada every day. The United States uses about 10 times this
amount and, worldwide, about 10 million tons are used per day.
Most domestic oil production in Canada is from approximately 50,000 oil wells
in Alberta and Saskatchewan. There are 22 oil refineries in Canada, 5 of which are
classified as large.
Canada imports about 130,000 tons of crude oil or other products per day but
exports about 220,000 tons per day, mostly to the United States.
In the United States, more than half of the approximately 2.6 million tons of oil
and petroleum products used per day is imported, primarily from Saudi Arabia,
Canada, and Venezuela. About 40% of the daily demand in the U.S. is for automotive
gasoline and about 15% is for diesel fuel used in transportation. About 40% of the
energy used in the United States comes from petroleum, 35% from natural gas, and
24% from coal.
Spill statistics are collected by a number of agencies in Canada and the United
States. In Canada, provincial offices collect data and Environment Canada maintains
a database of spills. In the United States, the Coast Guard maintains a database of
spills into navigable waters, while state agencies keep statistics on spills on land
that are sometimes gathered into national statistics. The Minerals Management
Service (MMS) in the United States maintains records of spills from offshore
exploration and production activities.
Photo 1
The
Amoco Cadiz
sinking off the coast of France in 1978. (International Maritime
Organization)
©2000 by CRC Press LLC
It can sometimes be misleading to compare oil spill statistics, however, because
different methods are used to collect the data. In general, statistics on oil spills are
difficult to obtain and any data set should be viewed with caution. The spill volume
or amount is the most difficult to determine or estimate. For example, in the case
of a vessel accident, the exact volume in a given compartment may be known before
the accident, but the remaining oil may have been transferred to other ships imme-
diately after the accident. Some spill accident data banks do not include the amounts
burned, if and when that occurs, whereas others include all the oil lost by whatever
means. Sometimes the exact character or physical properties of the oil lost are not
known and this leads to different estimations of the amount lost.
Reporting procedures vary in different jurisdictions and organizations, such as
government or private companies. Minimum spill amounts that must be reported
according to federal regulations in Canada and the U.S. vary from 400 to 8000 L,
depending on the product spilled. Spill statistics compiled in the past are less reliable
than more recent data because few agencies or individuals collected spill statistics
before about 1975.
The number of spills reported also depends on the minimum size or volume of
the spill. In both Canada and the United States, most oil spills reported are more
than 4000 L (about 1000 gallons). In Canada, there are about 12 such oil spills every
day, of which only about one is spilled into navigable waters. These 12 spills amount
to about 40 tons of oil or petroleum product. In the United States, there are about
25 spills per day into navigable waters and an estimated 75 spills on land.
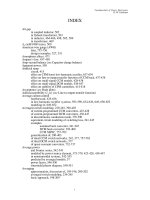
Photo 2
Most oil spillage occurs on land and comes from a variety of facilities, including
refineries such as this one. (Environment Canada)
©2000 by CRC Press LLC
Despite the large number of spills, only a small percentage of oil used in the
world is actually spilled. Oil spills in Canada and the United States are summarized
in Figures 1 and 2 in terms of the volume of oil spilled and the actual number of
spills. In terms of oil spills, it can be seen from these figures that there are certainly
differences between the two countries.
There are more spills into navigable waters in the United States proportionately
than in Canada because more oil is imported by sea and more fuel is transported by
barge. In fact, the largest volume of oil spilled in water in the U.S. comes from
barges, while the largest number of spills comes from vessels other than tankers,
bulk carriers, or freighters.
In Canada, most spills take place on land and this accounts for a high volume
of oil spilled. Pipeline spills account for the highest volume of oil spilled. In terms
of the actual number of spills, most oil spills happen at petroleum production
facilities, wells, production collection facilities, and battery sites. On water, the
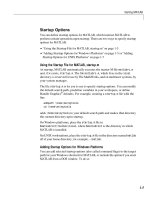
Photo 3
The
Kirki
leaks oil after losing its bow section. (Oil Spill Response Limited)
©2000 by CRC Press LLC
greatest volume of oil spilled comes from marine or refinery terminals, although the
largest number of spills is from the same source as in the U.S. — vessels other than
tankers, bulk carriers, or freighters.
The sources of oil spills, the types of oil spilled into the sea, and the causes of
spills from any type of ship or vessel worldwide are shown in Figure 3. Half of the
oil spilled in the seas is the runoff of oil and fuel from land-based sources, usually
from wastewater. Much lubricating oil finds its way into wastewater, which is often
discharged directly into the sea. About 24% of oil spilled into the sea comes from
the transportation sector, which includes tankers, freighters, barges, and other ves-
sels. Natural sources of oil constitute about 11% of the input. Natural sources include
Figure 1
Summary of typical annual Canadian spills.
©2000 by CRC Press LLC
the many natural “seeps” or discharges from oil-bearing strata on the ocean floor
that reach the surface. Atmospheric sources constitute 13% of oil pollution in the
sea. This pollution is the result of hydrocarbons in the air from a variety of sources
and causes such as inefficient combustion. Much of the material is re-precipitated
onto land and subsequently ends up in the sea.
As shown in Figure 3, most oils spilled into the sea worldwide are fuels (48%)
and then crude oils (29%). Fuels consist primarily of Bunker oils and intermediate
fuel oils (IFO) which consist of Bunker oils mixed with fuels such as diesel. Figure
3 also shows that grounding is the leading cause of oil spills from vessels (26%),
Figure 2
Summary of spills into navigable waters in U.S. (typical annual spills).
©2000 by CRC Press LLC
followed by collision at 22%. Some other accidental causes of oil spills are explo-
sion/fire (9%), ramming (9%), and sinking (7%), with human error (5%) and mechan-
ical failure (2%) causing the least number of spills.
A list of the largest oil spills in the last 30 years is provided in Table 1. Data
are derived from Environment Canada, the
Oil Spill Intelligence Report
, the general
literature on oil spills, the United States Coast Guard, and industry associations such
as the International Tanker Owners Pollution Federation (ITOPF) and the American
Petroleum Institute (API). The spills are listed according to their volume, beginning
with the largest spill to date — the release of oil during the Gulf War in 1991. There
have been several large oil spills from pipelines, storage tanks, and blowouts at
production wells.
People often have the misconception that oil spills from tankers are the primary
source of oil pollution in the marine environment. While it is true that most of the
large spills are from tankers, it must be recognized that these spills still make up
less than about 5% of all oil pollution entering the sea. The sheer volume of oil
spilled from tankers and the high profile given these incidents in the media have
contributed to this misconception. In fact, as stated earlier, half of the oil spilled in
the seas is the runoff of oil and fuel from land-based sources rather than from
accidental spills.
In conclusion, it is important to study spill incidents from the past to learn how
the oil affected the environment, what cleanup techniques worked and what improve-
ments can be made, and to identify the gaps in technology. Photographs of many of
the incidents listed in Table 1 appear throughout this book as examples of oil
behaviour and cleanup techniques.
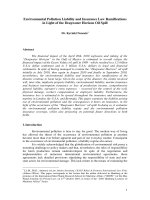
Photo 4
Spills from pipelines constitute a large amount of spillage on land and near shore.
(Oil Spill Response Limited)
©2000 by CRC Press LLC
Figure 3
Statistical summary of sources of oil into the seas worldwide.
©2000 by CRC Press LLC
Photo 5
The IXTOC well blowout in Mexican waters is the second largest spill recorded to
date. (Environment Canada)
Photo 6
Rapid action to remove remaining oil can prevent further loss as was the case
during the
Exxon Valdez
incident. (Foss Environmental)
©2000 by CRC Press LLC
Table 1 Major Spills
No. Year
Month/
Day Ship/Incident Country Location
Tons
(X10
3
)
1 1991 Jan 26 Gulf war Kuwait Sea Island 800
2 1979 Jun 5 IXTOC blowout Mexico Gulf of Mexico 470
3 1979 Jul 19
Atlantic
Empress/Aegean
Captain
Off Tobago Caribean Sea 300
4 1992 Mar 2 Oil well blowout Uzbekistan Fergana Valley 300
5 1993 Feb 4 Oil platform blowout Iran Nowruz field 270
6 1983 Aug 6
Castillo de Bellver
South Africa Saldanha Bay 260
7 1978 Mar 16
Amoco Cadiz
France Brittany 235
8 1988 Nov 10
Odyssey
Off Canada North Atlantic 145
9 1991 Apr 11
Haven
Italy Genoa 140
10 1980 Aug 11 Oil well blowout Libya inland 140
11 1967 Mar 18
Torrey Canyon
England Land’s End 130
12 1972 Dec 19
Sea Star
Oman Gulf of Oman 125
13 1980 Feb 23
Irene’s Serenade
Greece Pylos 120
14 1981 Aug 20 Storage tanks Kuwait Shuaybah 110
15 1971 Dec 7
Texaco Denmark
Belgium North Sea 107
16 1994 Oct 25 Pipeline rupture Russia Usinsk 105
17 1977 Feb 23
Hawaiian Patriot
Off USA West of Hawaii 100
18 1979 Nov 15
Independentza
Turkey Bosporus Strait 100
19 1976 May 12
Urquiola
Spain La Coruna 100
20 1969 Feb 11
Julius Schindler
Portugal Azores 100
21 1978 May 25 Pipeline rupture Iran Ahvazin 100
22 1993 Jan 5
Braer
United Kingdom Shetland
Islands
85
23 1979 Jul 6 Storage tanks Nigeria Forcados 85
24 1975 Jan 29
Jakob Maersk
Portugal Oporto 80
25 1992 Dec 3
Aegean Sea
Spain La Coruna 75
26 1985 Dec 6
Nova
Iran Persian Gulf 75
27 1996 Feb 15
Sea Empress
United Kingdom Milford Haven 72
28 1989 Dec 19
Kark 5
Morocco Atlantic Ocean 70
29 1971 Feb 27
Wafra
South Africa Atlantic Ocean 70
30 1970 Mar 20
Othello
Sweden Vaxholm 70
31 1991 May 28
ABT Summer
Off Angola Atlantic Ocean 70
32 1978 Dec 11 Fuel storage tank Rhodesia Salisbury 65
33 1975 May 13
Epic Colocotronis
United States West of Puerto
Rico
60
34 1960 Dec 6
Sinclair Petrolore
Brazil 60
35 1978 Jun 12 Fuel storage tank Japan Sendai 60
36 1992 Apr 17
Katina P
South Africa Indian Ocean 60
37 1974 Nov 9
Yuyo Maro 10
Japan Tokyo 54
38 1983 Jan 7
Assimi
Oman Ras al Had 53
39 1978 Dec 31
Andros Patria
Spain Bay of Biscay 50
40 1965 May 22
Heimvard
Japan Hokkaido 50
41 1983 Dec 9
Peracles GC
Qatar Persian Gulf 48
42 1968 Jun 13
World Glory
South Africa Indian Ocean 48
43 1974 Aug 9
Metula
Chile Straits of
Magellan
47
44 1975 Jan 13
British Ambassador
Japan Iwo Jima 46
45 1970 Jun 1
Ennerdale
Seychelles Indian Ocean 46
©2000 by CRC Press LLC
Table 1 Major Spills (Continued)
No. Year
Month/
Day Ship/Incident Country Location
Tons
(X10
3
)
46 1994 Oct 21
Thanassis A
Hong Kong South China
Sea
46
47 1978 Dec 7
Tadotsu
Indonesia Straits of
Malacca
44
48 1968 Feb 29
Mandoil
United States Oregon 43
49 1974 Dec 18 Storage tank Japan Mizushima
refinery
39
50 1979 Aug 26
Patianna
United Arab
Emirates
Dubai 38
51 1972 Jun 11
Trader
Greece Mediterranean
Sea
37
52 1989 Mar 24
Exxon Valdez
United States Valdez, AK 37
53 1980 Dec 29
Juan Antonio
Lavalleja
Algeria Arzew 37
54 1988 Apr 22
Athenian Venture
Off Canada Atlantic Ocean 37
55 1973 Jun 10
Napier
Chile Off west coast 36
56 1978 Dec 14 Storage tank United States Puerto Rico 36
57 1976 Feb 6
St. Peter
Colombia Pacific Ocean 36
58 1978 Oct 19 Pipeline rupture Turkey Mardin 35
59 1996 Mar 7 Unknown tanker Mexico Bay of
Campeche
35
60 1979 Nov 1
Burmah Agate
United States Galveston 35
61 1977 Jan 17
Irene's Challenge
Pacific Ocean 35
62 1977 Feb 7
Borag
Taiwan Chilung 34
63 1986 Oct 3 Abkatun Production
well blowout
Mexico Bay of
Campeche
34
64 1972 Jan 28
Golden Drake
North West
Atlantic
34
65 1979 Apr 28
Gino
France Brittany 33
66 1970 Dec 28
Chryssi
North West
Atlantic
33
67 1970 May 5
Polycommander
Spain Vigo 32
68 1968 Feb 8
Pegasus
North Atlantic North Atlantic 32
69 1971 Mar
Texaco Oklahoma
North West
Atlantic
32
70 1969 Nov 25
Panocean
Taiwan North West
Pacific
32
71 1977 May 27
Caribbean Sea
East Pacific32
72 1976 Apr 25
Ellen Conway
Algeria Arzew 31
73 1976 Jul 28
Cretan Star
Indian Ocean 31
74 1986 Apr 27 Storage tank -Texaco Panama Bahia las Minas 30
75 1977 Dec 16
Venpet & Venoil
South Africa 30
76 1979 Aug 16
Ioannis
Angelicoussis
Angola Malongo 30
77 1976 Dec 30
Grand Zenith
North West
Atlantic
30
78 1969 Nov 25
Keo
North West
Atlantic
30
79 1997 Oct 15
Evoikos
Singapore Straits of
Singapore
29
80 1982 Nov 26
Haralabos
Eygpt Ras Gharib 27
©2000 by CRC Press LLC
Table 1 Major Spills (Continued)
No. Year
Month/
Day Ship/Incident Country Location
Tons
(X10
3
)
81 1977 Mar 22 Offshore Platform —
Ekofisk Bravo
Norway North Sea 27
82 1979 Jan 8
Betelgeuse
Ireland Bantry Bay 27
83 1972 Apr 1
Guiseppe Guiljetti
North East Atlantic 27
84 1980 Jan 17 Funiwa #5 well
blowout
Nigeria off Forcados 26
85 1976 Dec 15
Argo Merchant
USA Nantucket, MA 26
86 1977 Oct 28
Al Sabbiyah
Japan Philippine Sea 25
87 1993 Jan 21
Maersk Navigator
Indonesia Strait of
Malacca
24
88 1983 May 15
Bellona
Sweden Gothenburg 24
89 1989 Dec 29
Aragon
Portugal Madeira 24
90 1994 Jan 24
Cosmos A.
Hong Kong South China
Sea
23
91 1967 Oct 1 Offshore pipeline USA Off Louisiana 22
92 1972 Jun 22 Storage tank USA Schuylkill River,
Pa
20
93 1981 Mar 29
Cavo Cambanos
Spain Mediterranean
Sea
20
94 1977 Aug 10
USSR 1
Turkey Bosporus Strait 20
95 1975 Jan 12
Master Stathios
South Africa Indian Ocean 20
96 1967 Sep
R.C. Stoner
North Pacific20
97 1975 Apr 4
Spartan Lady
USA Atlantic Ocean 20
98 1993 Mar 6 Omsk-Irkutsk
pipeline
Russia West Siberia 20
99 1968 Nov 3
Spyros Lemos
Spain Vigo 20
100 1976 Feb 16
Nan Yang
Hong Kong South China
Sea
19
101 1967 Oct
Giorgio Fassio
Angola Atlantic Ocean 19
102 1985 Nov 6 Ray Richley well
blowout
USA Ranger, TX 18
103 1991 Jul 21
Kirki
Australia Cervantes 18
104 1983 Nov 26
PNOC Basilan
Philipines South China
Sea
17
105 1970 Apr 17
Silver Ocean
South Africa Durban 17
106 1980 Jan 16
Salem
Senegal Atlantic Ocean 17
107 1968 May 5
Andron
South Africa Cape Town 16
108 1980 Mar 7
Tanio
France Brittany 16
109 1966 Feb 25
Ann Mildred Brovig
Germany North Sea 16
110 1979 Mar 2
Messiniaki Frontis
Greece Crete 16
111 1970 Jan 31
Gezina Brovig
USA Puerto Rico 15
112 1983 Nov 17 Storage tank - Shell
refinery
Singapore Puleu Bukom 15
113 1976 Jun 30
Al Dammam
Greece Agiol Theodoroi 15
114 1976 Oct 4
LSCO Petrochem
USA Off Louisiana 15
115 1965 Aug 30
Arsinoe
Philipines South China
Sea
15
116 1970 Nov 1
Marlena
Italy Sicily 15
117 1981 Nov 21
Globe Assimi
Lithuania Klaipeda 14
118 1969 Jan 28 Oil well blowout USA Santa Barbara 14
119 1976 May 26 Storage tank USA Hackensack, NJ 13
120 1990 Jun 8
Mega Borg
USA Gulf of Mexico 13
©2000 by CRC Press LLC
Table 1 Major Spills (Continued)
No. Year
Month/
Day Ship/Incident Country Location
Tons
(X10
3
)
121 1971 Dec 2 Laban Island well
blowout
Iran Persian Gulf 13
122 1966 Oct
Malmohus
Tanzania Dar Es Salaam 13
123 1999 Dec 12
Erika
France Bay of Biscay 12
124 1975 Mar 26
Tarik Ibn Ziyad
Brazil Rio de Janeiro 12
125 1980 Oct 2 Offshore platform -
Hasbah 6
Saudia Arabia Persian Gulf 12
126 1984 Oct 31 Puerto Rican USA San Francisco,
CA
12
127 1975 Jan 6 Showa Maru Malaysia Strait of
Malacca
12
128 1983 Jan 7 Storage tank USA Newark Bay, NJ 11
129 1987 Jun 23 Fuyoh Maru France Le Havre 11
130 1971 Jun 1 Santa Augusta USA Virgin Islands 11
131 1987 Jul 29 Blue Ridge USA Off Florida 11
132 1979 Jan 1 Corpoven well
blowout
Venezuela El Tigre 11
133 1978 Feb 8 Storage tank USA Los Angelos 11
134 1978 Jan 9 Brazilian Marina Brazil San Sebastiao 10
135 1988 Oct 10 Century Dawn Singapore Singapore Strait 10
136 1989 Oct 4 Pacificos South Africa Indian Ocean 10
137 1974 Oct 10 Trojan Philipines South China
Sea
10
138 1977 Nov 2 Matsushima Maru
No. 3
Japan Philippine Sea 10
139 1979 Apr 5 Fortune Singapore 10
140 1975 Nov 12 Olympic Alliance United Kingdom English
Channel
10
141 1978 Dec 25 Kosmas M. Turkey Asbas 10
142 1974 Sep 25 Eleftheria Sierra Leone Atlantic Ocean 10
143 1978 Jan 31 Storage tank transfer
loss
USA Arthur Kill, NJ 10
144 1990 Jun 20 Storage tank Russia Nefteyugansk 10
145 1996 Nov 23 Storage tank Czech Republic Litinov 10
146 1972 Aug 21 Oswego Guardian South Africa Indian Ocean 10
147 1990 Aug 6 Sea Spirit Gibralter Straits of
Gibralter
9
148 1984 Jul 30 Alvenus USA Cameron, LA 9
149 1970 Feb 10 Oil well blowout -
Chevron Main Pass
USA Louisiana 9
150 1972 Sep 6 Pipeline rupture -
Nipisi
Canada Nipisi, Alberta 9
151 1978 May 6 Eleni V United Kingdom Norfolk 9
152 1970 Feb 4 Arrow Canada Nova Scotia 8
153 1970 Dec 1 Offshore platform -
Shell #26
USA Louisiana 8
154 1987 Oct 10 Yum II/Zapoteca Mexico Bahia de
Campeche
8
155 1994 Mar 2 Oil well blowout Uzbekistan Fergana Valley 8
156 1972 Jan 1 General MC Meiggs USA Juan de Fuca,
WA
8
©2000 by CRC Press LLC
Some Oil Spill Facts
• About 10 million tons of oil and petroleum products are used worldwide each day.
Despite the large number of oil spills, however, only a small percentage of oil used
is actually spilled.
• While most of the large oil spills in the marine environment are from tankers, these
spills make up less than about 5% of all oil pollution entering the sea. Most oil
pollution in the oceans comes from the run-off of oil and fuel from land-based
sources rather than from accidental spills.
• In Canada, about 12 spills of more than 4000 L are reported each day, of which
only about one spill is into navigable waters. In the U.S., about 25 such spills occur
each day into navigable waters and about 75 occur on land.
• 30 to 50% of oil spills are directly or indirectly caused by human error, with 20
to 40% of these caused by equipment failure or malfunction.
• The average cost of cleaning up oil spills worldwide varies from $20 to $200 per
litre of oil spilled.
Table 1 Major Spills (Continued)
No. Year
Month/
Day Ship/Incident Country Location
Tons
(X10
3
)
157 1992 Jun 1 Komineft Vozey
pipeline
Russia Izhma 8
158 1977 Oct 29 Al-Rawdatain Italy Genoa 8
159 1985 Apr Southern Cross Algeria Skikda 8
160 1990 Jun 28 Chenki Eygpt Suez Canal 8
161 1968 Mar 3 Ocean Eagle USA San Juan,
Puerto Rico
8
162 1983 Sep 27 Sivand United Kingdom Humber Estuary 8
163 1993 Oct 1 Frontier Express Korea Yellow Sea 7
164 1972 Oct 25 Barge Ocean 80 USA Arthur Kill, NJ 7
165 1974 Apr 7 Sea Spirit USA Los Angeles 7
166 1989 Jan 16 UMTB American
Barge 283
USA Off Alaska 7
167 1990 Dec 27 Kuybyshev-Perm
pipeline
Russia Cormova 7
168 1997 Jan 18 Bona Fulmar France Dover Strait 7
169 1976 Oct 14 Boehlen France Atlantic Ocean 7
170 1980 Nov 22 Georgia USA Louisiana 7
171 1979 Mar 15 Kurdistan Canada Nova Scotia 6
172 1997 Jan 2 Nakhodka Japan Japan Sea 6
173 1966 May 15 Fina Norvege Italy Sardinia 6
174 1973 Aug 8 Trinimar 327 well
blowout
Venezuela Guiria 6
175 1974 Feb 13 Sea Spray Vietnam South China
Sea
6
©2000 by CRC Press LLC
Photo 7 Oil and oiled weeds are shown here, a result of the Persian Gulf War spill, the
largest spill recorded to date. (Oil Spill Response Limited)
Photo 8 The Haven burns off the coast of Italy. (Oil Spill Response Limited)