MEDICAL COMPLICATIONS OF TYPE 2 DIABETES potx
Bạn đang xem bản rút gọn của tài liệu. Xem và tải ngay bản đầy đủ của tài liệu tại đây (17.61 MB, 422 trang )
MEDICAL COMPLICATIONS
OF TYPE 2 DIABETES
Edited by Colleen Croniger
Medical Complications of Type 2 Diabetes
Edited by Colleen Croniger
Published by InTech
Janeza Trdine 9, 51000 Rijeka, Croatia
Copyright © 2011 InTech
All chapters are Open Access articles distributed under the Creative Commons
Non Commercial Share Alike Attribution 3.0 license, which permits to copy,
distribute, transmit, and adapt the work in any medium, so long as the original
work is properly cited. After this work has been published by InTech, authors
have the right to republish it, in whole or part, in any publication of which they
are the author, and to make other personal use of the work. Any republication,
referencing or personal use of the work must explicitly identify the original source.
Statements and opinions expressed in the chapters are these of the individual contributors
and not necessarily those of the editors or publisher. No responsibility is accepted
for the accuracy of information contained in the published articles. The publisher
assumes no responsibility for any damage or injury to persons or property arising out
of the use of any materials, instructions, methods or ideas contained in the book.
Publishing Process Manager Mirna Cvijic
Technical Editor Teodora Smiljanic
Cover Designer Jan Hyrat
Image Copyright Robyn Mackenzie, 2010. Used under license from Shutterstock.com
First published August, 2011
Printed in Croatia
A free online edition of this book is available at www.intechopen.com
Additional hard copies can be obtained from
Medical Complications of Type 2 Diabetes, Edited by Colleen Croniger
p. cm.
978-953-307-363-7
free online editions of InTech
Books and Journals can be found at
www.intechopen.com
Contents
Preface IX
Part 1 Insulin Resistance 1
Chapter 1 Insulin Secretion and Actions 3
Sarawut Jitrapakdee and Briony E. Forbes
Chapter 2 The Oral Glucose Tolerance Test:
An Old but Irreplaceable Test to Evaluate
Glucose Metabolism and Cardiovascular Risk 27
Gian Paolo Fra, Ettore Bartoli and
Gian Piero Carnevale Schianca
Chapter 3 The Role of Parathyroid
Hormone-Related Protein (PTHRP)
in the Pathophysiology of Diabetes Mellitus 39
Ioannis Legakis
Chapter 4 Impaired Vascular BK
Channel Function in Type 2 Diabetes Mellitus 53
Tong Lu and Hon-Chi Lee
Part 2 Endothelial Cells and Type 2 Diabetes 71
Chapter 5 Endothelial Progenitor Cell Dysfunction in
Diabetes Mellitus Type-2: Focus on Nitric Oxide System 73
Saher Hamed
Chapter 6 Glycaemic Control and Protection
of the Vasculature from Glucose Toxicity 87
Hong Ding and Chris R. Triggle
Chapter 7 Endothelial Dysfunction and
Therapeutic Intervention in Type 2 Diabetes 111
Fernando Grover Páez
VI Contents
Part 3 Genetics of Type 2 Diabetes 143
Chapter 8 Using Gene Expression Signatures
to Dissect Insulin Resistance Subtypes 145
Brad Hayward, Nicky Konstantopoulos and Ken R. Walder
Chapter 9 The Role of Single Nucleotide Polymorphisms of
Untranslated Regions (Utrs) in Insulin Resistance
Pathogenesis in Patients with Type 2 Diabetes 165
Małgorzata Małodobra
Chapter 10 Genetics of Endothelial Damage
Associated to Diabetes Mellitus Type 2 189
Lorena García, Carlos Wolff, Verónica Araya,
Gloria López, Sergio Lobos, Pilar Durruty and
Daniela Seelenfreund
Chapter 11 Functional Context Network of T2DM 213
Anja Thormann and Axel Rasche
Part 4 Complications of Type 2 Diabetes 231
Chapter 12 Sarcopenia, Sarcopenic Obesity and Insulin Resistance 233
John A. Batsis and Silvio Buscemi
Chapter 13 Type 2 Diabetes and
Pancreatic Cancer – A Possible Reason 257
Parviz M Pour
Chapter 14 Pathophysiology in Type 2 Diabetes –
Type 2 Diabetes and Sleep-Disordered
Breathing/Sleep Apnea – Role of Adipocytokines 267
Ken Kishida
Part 5 Treatments and Therapy 277
Chapter 15 Can Bariatric or Metabolic
Surgery Cure Type 2 Diabetes? 279
Gustavo P. S. Miguel, Perseu Carvalho,
João Luiz Azevedo, Murilo Hosken Júnior,
Évelyn Zambrana, Otávio Azevedo and Isaac Abreu
Chapter 16 Nuclear Imaging of Glucose Transport/Metabolism –
An Interesting Tool to Screen Insulin Resistance,
Refine Diagnosis of Type 2 Diabetes, Understand
Disease Mechanisms, and/or Evaluate New Therapies 291
P. Perret, M. Henri, L. Slimani,
D.Fagret and C. Ghezzi
Contents VII
Chapter 17 Targeting PKA Signaling to
Prevent Metabolic Syndrome and Delay Aging 303
Linda C Enns and Warren C Ladiges
Chapter 18 Targeting AMPK for
Therapeutic Intervention in Type 2 Diabetes 321
Mohamed Kodiha and Ursula Stochaj
Chapter 19 Design and Evaluation of a Complex
Phytoceutical Formulation for Circulatory Diseases 349
J. Olalde, A. Antoshechkin, O. del Castillo,
R. Guzmán and F. Améndola
Chapter 20 Effectiveness of Fenugreek for Lowering
Hemoglobin (HbA1c) in Patients with Self-Management
of Type 2 Diabetes: A Randomized Controlled Trial 393
Rashid Ansari and Saiqaa Ansari
Preface
Obesity and type 2 diabetes are increasing worldwide problems. In this book we
reviewed insulin secretion in both healthy individuals and in patients with type 2
diabetes. Because of the risk associated with progression from insulin resistance to
diabetes and cardiovascular complications increases along a continuum, we included
several chapters on the damage of endothelial cells in type 2 diabetes and genetic
influences on endothelial cell dysfunction. Cardiovascular complications occur at a
much lower glucose levels, thus a review on the oral glucose tolerance test compared
to other methods was included. The medical conditions associated with type 2
diabetes such as pancreatic cancer, sarcopenia and sleep disordered breathing with
diabetes were also discussed. The book concludes with several chapters on the
treatments for this disease offering us hope in prevention and successful alleviation of
the co-morbidities associated with obesity and type 2 diabetes.
Colleen Croniger
Department of Nutrition, Case Western Reserve University,
School of Medicine, Cleveland,Ohio
US
Part 1
Insulin Resistance
1
Insulin Secretion and Actions
Sarawut Jitrapakdee
1
and Briony E. Forbes
2
1
Deparment of Biochemistry, Faculty of Science, Mahidol University, Bangkok,
2
School of Molecular and Biomedical Science, University of Adelaide, Adelaide,
1
Thailand
2
Australia
1. Introduction
1.1 Insulin biosynthesis
The islets of langerhans are the clusters of the endocrine tissue that scatter among the
exocrine cells in the pancreas. The islets occupy approximately 1-2% of the total pancreatic
tissue. Approximately, 1 million islets are scattered in the 25 cm long human pancreas.
The insulin-producing cells make up 80% of each islet, while the remaining includes
glucagon-producing -cells, somatostatin-producing -cells and the pancreatic
polypeptide (PP) F-cells (Unger et al., 1978). Insulin is first synthesized as a 110-amino
acid polypeptide chain known as pre-proinsulin. This precursor form contains a
hydrophobic 24-amino acid at its N-terminus known as the signal peptide. This signal
peptide is removed during translocation from the cytoplasm to the endoplasmic
reticulum, producing the proinsulin which comprises of chains A, B and C with three
disulfide bonds. Further proteolysis of proinsulin in the secretory vesicles by the
prohormone convertases (PC1 and PC2) and the carboxypeptidase E, removes the C-
peptide from the rest of the molecule while still retains three disulfide bonds. This
remaining part or mature insulin contains 21 amino acids on chain A and 30 amino acids
on chain B (Steiner, 1969).
1.2 Biphasic insulin secretion and insulin exocytosis
The mature insulin is stored in the secretory granules which can be divided into two distinct
pools, i.e. the reserve pool (RP) and the readily releasable pool (RRP) (Barg et al., 2002;
Bratanova-Tochkova et al., 2002). The RRP is located close to the plasma membrane and is a
rather small pool of insulin, comprising only 1-10% of total insulin in the cell. In contrast, the
RP is located intracellularly and is a largest insulin pool. Once insulin granules in the RRP
are released, the RP moves close to the plasma membrane to replenish the RRP (Barg et al.,
2002; Bratanova-Tochkova et al., 2002).
Unlike other endocrine cells in the pancreas, -cells secrete insulin. This occurs not only
under low glucose conditions (non-stimulatory conditions) (3-5 mM glucose) but also
when the glucose concentration in plasma is high during the postprandial period (10-25
mM glucose) when -cells secrete much larger amounts of insulin into the circulation.
Although several nutrients including glucose, some amino acids and non-esterified fatty
acids can stimulate insulin secretion, glucose appears to be the most potent insulin
Medical Complications of Type 2 Diabetes
4
secretagogue. The mechanism of glucose-induced insulin secretion (GSIS) is the most
extensively studied. Secretion of insulin in response to the elevated levels of glucose in
plasma is rapid and occurs in a two-step process known as biphasic insulin secretion
(Straub and Sharp, 2002; Straub and Sharp, 2004). The first phase occurs very rapidly
within a first few minutes upon stimulation. At this stage, the insulin granules in the
RRP are fused very rapidly with the plasma membrane, resulting in a sharp release of
insulin in the blood circulation. The first phase lasts only for a few minutes before the
second phase begins and is sustained to the peak at 30-40 min or longer, depending on
whether the concentration of plasma glucose is still high. The amount of insulin released
during the second phase is much higher than the first phase. It is estimated that 99% of
total insulin is secreted in this second phase, with an approximate release rate of 5-40
granules/cell/minute (Barg et al., 2002; Straub and Sharp, 2004). Therefore the second
phase of insulin secretion is more physiologically important. Not unexpectedly, this
biphasic insulin secretion appears to be impaired in the patients with type 2 diabetes.
The translocation of the insulin granules in the RP to become the RRP, as well as the
docking of secretory vesicles to the plasma membrane are dynamic processes, requiring
the rearrangement of cytoskeleton proteins inside the -cell (Wang and Thurmond,
2009). During basal conditions, the F-actin filaments are polymerized as a dense network
below the plasma membrane. This web structure of filamentous F-actin not only blocks
the access of insulin granules in the reserved pool to the plasma membrane but also
prevents the interaction of the v-SNARE protein, VAMP2, in the insulin granule vesicles
with the t-SNARE proteins (syntaxin 1 and 4) on the plasma membrane. This process is a
prerequisite for granule exocytosis. Under glucose stimulation conditions, F-actin
filaments are depolymerized and there is an increased microtubule polymerization rate,
allowing the RP of insulin granules to translocate to the plasma membrane where the
interaction of vSNAREs and tSNAREs are maximized (Farshori and Goode, 1994; Howell
and Tyhurst, 1979; Thurmond et al., 2003).
2. Biochemical basis of glucose-induced insulin secretion
2.1 K
ATP
-dependent GSIS: Roles of glycolysis, mitochondrial metabolism and ATP-
sensitive potassium channels
Unlike other ligands, glucose does not require a cellular receptor to mediate signal
transduction to stimulate insulin secretion in -cells. This signal transduction is initiated
by the rapid uptake of glucose through the glucose transporter 2 (GLUT2) in rodents
(Chen et al., 1990) or glucose transporter 1 (GLUT1) in humans (De Vos et al., 1995)
located on the plasma membrane of -cells. GLUT2 transporters allow the high-capacity
and low affinity transport needed to equilibrate glucose concentrations across the plasma
membrane and to support the -cell’s very high metabolic rate. Glucose then undergoes
phosphorylation by a glucokinase which possesses a high K
m
for glucose, allowing the
elevated levels of plasma glucose present during the postprandial period to enter -cells
for glycolysis (Matschinsky, 1990). As glucokinase has low binding affinity for glucose,
this means that the glycolytic rate is never saturated during the postprandial period.
Because the -cell contains very low activity of lactate dehydrogenase, most glycolysis-
derived pyruvate enters the mitochondria and is oxidized to acetyl-CoA by the pyruvate
dehydrogenease complex. Acetyl-CoA is then oxidized in the TCA cycle, concomitant
with the production of the reducing equivalents, NADH. In contrast to other cell types,
Insulin Secretion and Actions
5
-cells possess very high mitochondrial glycerol-3-phosphate dehydrogenase activity,
which is a key enzyme in the mitochondrial-3-phosphate dehydrogenase shuttle
(MacDonald, 1981). This allows NADH formed during glycolysis to be transported to the
mitochondria for oxidative phosphorylation. The reducing equivalents obtained from
glycolysis and TCA cycle are subsequently oxidized through the electron transport chain
to produce cellular ATP. The key component that links the metabolic signal and the
insulin granule exocytosis is the ATP-sensitive potassium channel (K
ATP
). This channel is
an octamer comprising four pore forming subunits of Kir6.2 and four subunits of the
sulfonylurea receptor (SUR1) (Aguilar-Bryan et al., 1995). Under unstimulated
conditions, K
ATP
channels are opened, allowing the diffusion of K
+
across plasma
membrane of -cells near equilibrium. However, when the ratio of ATP:ADP ratio is high
due to a high rate of glucose oxidation, ATP binds to the Kir6.2 component of the K
ATP
channel, causing the channel to close. The depolarization of the membrane caused by the
closure of the K
ATP
channel opens the voltage-gated Ca
2+
channel, causing Ca
2+
influx
into the cells (Ashcroft et al., 1984). This electrophysiological cascade results in the
exocytosis of the insulin granues in the RRP. The increase of intracellular Ca
2+
also
stimulates the calmodulin-dependent protein kinase II which can phosphorylate several
targets including the myosin light chain kinase that controls the cytoskeletal or secretory
vesicle proteins (Easom, 1999). The insulin release triggered by the K
ATP
-dependent
mechanism corresponds to the first phase of the biphasic insulin secretion (Straub and
Sharp, 2004).
2.2 K
ATP
-independent GSIS: Anaplerosis and coupling factors
Although the K
ATP
channel appears to control the GSIS, several lines of evidence suggest
that GSIS can be operated independently of K
ATP
channel. Treating -cells with a K
ATP
channel opener, diazoxide, does not completely eliminate GSIS (Gembal et al., 1992).
Furthermore, mice lacking Kir6.2 or the SUR1 component of K
ATP
are still capable of
secreting insulin in response to glucose albeit not as robust as the wild type mice
(Seghers et al., 2000; Shiota et al., 2002). It has now become clear that GSIS requires
“coupling factors” or “metabolic factors” that act as the amplifying signal of insulin
secretion. Those coupling factors include NADPH, GTP, long chain acyl-CoA and
glutamate. The biochemical pathways or cycles that lead to production of the coupling
factors are described below.
NADPH: The pentose phosphate pathway is the major pathway that produces NADPH,
however the -cell does not possess glucose-6-phosphate dehydrogenase to produce this
reducing equivalent. Instead, -cells possess a very high activity of pyruvate carboxylase
and pyruvate dehydrogenase (MacDonald, 1993). Although equal proportions of the
glycolysis-derived pyruvate enters mitochondria is carboxylated by PC and
decarboxylated by pyruvate dehydrogenase, only the flux via the carboxylation reaction is
correlated with GSIS (Lu et al., 2002). In -cells, there is a high rate of the export of TCA
cycle intermediates, i.e. citrate and malate from mitochondria to cytoplasm which is
known as cataplerosis (MacDonald, 2003). The exported citrate and malate are then
recycled back to the mitochondria as pyruvate known as pyruvate cycling as shown in
Figure 1. This pyruvate cycling can be shuttled to the pyruvate via pyruvate/malate,
pyruvate/isocitrate or pyruvate citrate cycles (MacDonald et al., 2005). As noted in Figure
1, NADPH is a common reducing equivalent produced by malate dehydrogenase, malic
Medical Complications of Type 2 Diabetes
6
enzyme and isocitrate dehydrogenase in the above three cycles, respectively. Pyruvate
then re-enters the mitochondria and is carboxylated by pyruvate carboxylase, which is as
highly abundant as in the gluconeogenic tissue. Deficiencies in pyruvate carboxylase,
cytosolic malic enzyme and cytosolic isocitrate dehydrogenase result in impaired GSIS,
indicating the importance of pyruvate cycling in -cells (Jitrapakdee et al., 2010). Glucose
sharply increases the NADPH:NADP ratio proportion to the level of insulin secretion. The
mechanism by which NADPH acts on insulin secretion is thought to be mediated through
the glutaredoxin and thioredoxin redox pairs. The maintenance of the extra-mitochondria
redox state via glutaredoxin and thioredoxin is required to support insulin granule
exocytosis. Furthermore, NADPH is also associated with the voltage-dependent
potassium channel (K
v
) which works in an opposite way to the K
ATP
channel. This channel
functions as K
+
efflux, causing the repolarization of the -cell plasma membrane for the
next cycle of GSIS. Binding of NADPH to the Kv causes the conformational change of its
regulatory subunit, reducing the efficacy of this channel for repolarization of the -cell
plasma membrane and enhancing the action of K
ATP
channel [reviewed by Jitrapakdee et
al., 2010].
Long chain acyl-CoA: Long chain acyl-CoA is another coupling factor thought to be
required for GSIS (Brun et al., 1996; Corkey et al., 1989; Prentki et al., 1992). Evidence for this
is derived from the following observations. Acute exposure of -cells to glucose sharply
increases intracellular levels of malonyl-CoA and long chain acyl-CoA. In supporting this
observation, exposure of permeabilized -cells to long chain acyl-CoA or non-esterified fatty
acids also stimulates Ca
2+
-evoked insulin exocytosis. This is accompanied by elevated levels
of acetyl-CoA carboxylase 1 (ACC1), a rate-limiting enzyme of de novo fatty acid synthesis.
ACC condenses two molecules of acetyl-CoA to malonyl CoA and this enzyme is rapidly
induced by high concentrations of glucose in -cells. Because malonyl-CoA is a potent
inhibitor of the carnitine palmitoyl transerase I (CPT-1), the rapid increase of malonyl-CoA
level by ACC1 would inhibit -oxidation of fatty acids, resulting in the elevated levels of
long chain acyl-CoA in -cells (Brun et al., 1996; Corkey et al., 1989; Prentki et al., 1992). This
long chain acyl-CoA can be used as the precursor for synthesizing diacyl glycerol and
phospholipids. Consistent with this idea, acute exposure of -cells to glucose also modifies
the concentrations of phospholipids and cholesteryl esters. These modifications could affect
membrane fluidity and exocytosis of the secretory vesicles. Furthermore diacyl glycerol can
also activate protein kinase C which in turn phosphorylates its downstream targets
including ion channels.
Although inhibition of ACC1 and fatty acid synthetase activities result in a marked
reduction of GSIS, suppression of ATP-citrate lyase expression does not appear to affect
GSIS, suggesting the presence of another pathway that can supply acetyl-groups for de novo
fatty acid synthesis in -cells [reviewed by Jitrapakdee et al., 2010]]. An alternate pathway
that provides acetyl-groups for long chain acyl-CoA synthesis lies within the acetoacetate
production catalyzed by acetoacetyl-CoA synthetase. This was demonstrated by the
knockdown experiment in which suppression of this enzyme expression impairs GSIS in -
cells (MacDonald et al., 2005). Acute exposure of -cells to glucose not only stimulates rapid
lipogenesis but also alters phospholipid and cholesteryl ester contents in the plasma
membrane which in turn affects insulin granule exocytosis and -cell plasma membrane
fluidity (MacDonald et al., 2008).
Insulin Secretion and Actions
7
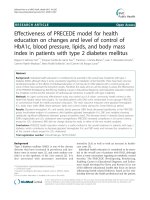
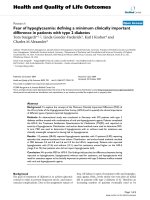
Fig. 1. Biochemical basis of glucose-induced insulin secretion (GSIS). Glucose enters -cells
through GLUT2 transporter and is metabolized to pyruvate by glycolysis. Pyruvate enters
the mitochondria where it is oxidized in the TCA cycle. The NADH produced by both
glycolysis and TCA cycle are oxidized to produce the cellular ATP. The increased level of
ATP:ADP triggers the closure of ATP-sensitive potassium channels resulting in membrane
depolarization. This in turn opens the voltage gate-dependent Ca
2+
channels, causing the
influx of Ca
2+
which triggers the immediate exocytosis of insulin granules in the readily
releasable pool, corresponding to the 1
st
phase of biphasic insulin secretion. Some
components of the TCA cycle, i.e. malate, citrate and isocitrate are also exported from the
mitochondria to cytoplasm (cataplerosis) where these exported products are converted back
to pyruvate (pyruvate cycling) concomitantly with the production of NADPH via pyruvate-
malate, pyruvate-citrate and pyruvate-isocitrate shuttles, respectively. PC replenishes OAA
in the TCA cycle when malate, citrate and isocitrate are removed for the pyruvate cycling.
The exported citrate is converted to oxaloacetate and acetyl-CoA. ACC1 converts acetyl-CoA
to malonyl-CoA which is subsequently converted to long chain acyl-CoA by FAS. The
NADPH malonyl-CoA, long chain acyl-CoA together with the mitochondrial GTP produced
by succinyl-CoA synthetase and glutamate produced by glutamate dehydrogenase serve as
“amplifying signals” that correspond to the 2
nd
phase of biphasic insulin secretion. ACC,
acetyl-CoA carboxylase; ACL, ATP-citrate lyase; cICD, cytolsolic isocitrate dehydrogenase;
CIC, citrate/isocitrate carrier; GTP-SC, GTP-succinate dehydrogenase; FAS, fatty acid
synthase, MDH, malate dehydrogenase; ME, malic enzyme, PC, pyruvate carboxylase; PDH,
pyruvate dehydrogenase complex; RP, reserve pool; RRP, readily releasable pool.
Medical Complications of Type 2 Diabetes
8
Other coupling factors: Acute exposure of -cells to glucose causes a sharp increase in the
level of glutamate, suggesting that glutamate might be a second messenger that promotes
insulin secretion (Maechler and Wollheim, 1999). This intracellular source of glutamate is
derived from the conversion of -ketoglutarate by the glutamate dehydrogenase. Although
there is a strong correlation between the rapid increase of an intracellular level of glutamate
upon an acute stimulation by glucose, there is no direct evidence indicating that the rise of
glutamate level results in the insulin secretion (MacDonald and Fahien, 2000). Incubation of
-cells with glutamine, a precursor of glutamate production does not increase GSIS.
Furthermore the GDH ablated mice showed only 30-40% loss of GSIS indicating that
glutamate may not be the second messenger for insulin secretion (Carobbio et al., 2009).
The level of mitochondrial GTP may be one of the coupling factors that regulate GSIS. The
succinyl-CoA synthetase catalyzes the conversion of succinyl-CoA to succinate, concomitant
with the production of GTP. Suppression of the succinyl-CoA synthetase expression results
in impaired GSIS in -cells, indicating the importance role of mitochondrial GTP in GSIS
(Kibbey et al., 2007).
Incubation of -cells with high concentrations of glucose not only stimulates ATP
production via electron transport system but also triggers the production of the reactive
oxygen species in the mitochondria. There is evidence that the reactive oxygen species may
be an obligatory signal for insulin secretion (Leloup et al., 2009; Pi et al., 2007). Incubation of
-cells with certain reactive oxygen species stimulates insulin secretion. Because these
reactive oxygen species are toxic to the cells and they are removed very quickly by the
antioxidant enzymes in the -cells the question remains whether this transient increase of
reactive oxygen species is a bona fide coupling factor for GSIS.
3. Other insulin secretagogues
Although glucose is the most potent insulin secretagogue, certain amino acids including
leucine and glutamine can also stimulate insulin secretion (Fahien et al., 1988; Malaisse-
Lagae et al., 1982). Leucine stimulates insulin secretion because its acts as an allosteric
activator of the glutamate dehydrogenase, an anaplerotic enzyme that converts glutamate to
-ketoglutarate in the TCA cycle. Glutamine by itself cannot stimulate insulin secretion,
however combination of glutamine and leucine stimulates insulin secretion as robustly as
glucose because glutamine can be converted to glutamate, and leucine acts as allosteric
activator of glutamate dehydrogenase in the presence of excess glutamate substrate. Unlike
leucine, arginine can stimulate only the 1
st
phase but not the amplifying phase of insulin
secretion. The reason for this is because arginine is not metabolized in the mitochondria in
the glycolysis or TCA cycle.
Free fatty acids by themselves cannot stimulate insulin secretion but low concentrations of
them augment glucose-induced insulin secretion (Deeney et al., 2000; Poitout, 2003). Free
fatty acids can be metabolized to long chain fatty acyl-CoA which is one of the coupling
factors as described earlier. However, chronic exposure of -cells to high concentration of
fatty acids promotes -cell apoptosis via the formation of ceramides or other reactive lipids
(Giacca et al., 2011; Poitout and Robertson, 2002).
Apart from the nutrient secretagogues, some hormones can stimulate insulin secretion. The
well known insulinotropic peptide hormones include the glucagon-like-peptide-1 (GLP-1) and
gastic-inhibitory peptide (GIP) (Holst, 2007). GLP-1 is secreted from the enteroglucagon-
Insulin Secretion and Actions
9
producing cells (L-cells) in the lower intestine, while GIP is secreted from K-cells in the upper
gastrointestinal tract. These two peptides are secreted in response to the ingestion of glucose.
GLP-1 acts to increase insulin secretion via the circulation acting directly on pancreatic cells
and also via the sensory afferent neurons acting on the central nervous system (Holst et al.
2007). In the brain GLP-1 acts a neuropeptide to promote neuroendocrine actions on the
autonomic nervous system including regulation of food intake, satiety and pancreatic
secretions. GLP-1 is controlled by the dipeptidyl protease 4 (DPP4). DPP4 cleavage renders
GLP-1 unable to bind to its target receptor, the glucagon-like peptide-1 receptor (GLP-1R) and
thus tightly controls the levels of GLP-1 in the intestine and the circulation. GLP-1 also
promotes metabolic control by inhibiting glucagon secretion.
4. Insulin oscillation
In humans, mouse and rat the majority of insulin (>70%) is released in a pulsatile manner
with a periodicity of 3-5 min (Matveyenko et al., 2008; Porksen et al., 1997; Song et al., 2000).
This pattern is observed both before and after meals, however the amplitude of oscillation is
higher during the postprandial period. The oscillation of insulin secretion is believed to be a
mechanism to prevent down-regulation of insulin receptors in the target tissues. The
pulsatile insulin secretion is most obviously detected in the portal vein and can also be
detected in the isolated islets. Remarkably, the oscillations of insulin secretion are also
synchronized among one million islets. These tightly synchronized oscillations require the
complex factors including the soluble factor, gap junction and intra-pancreatic nerves.
However, this pulsatile pattern becomes less obvious in the peripheral blood (Tengholm
and Gylfe, 2009). These oscillations are intrinsic to the islets, and are regulated by the
concentrations in individual -cells of cytoplasmic Ca
2+
, intracellular cAMP and plasma
membrane phosphoinositide lipids, as well as the activity of phospholipase C (Tengholm
and Gylfe, 2009). The oscillations of insulin secretion from pancreatic islets correlate very
well with the oscillation of intracellular Ca
2+
concentration (Bergsten et al., 1994; Bergsten
and Hellman, 1993). Although it is widely accepted that the insulin oscillation is the result of
intracellular Ca
2+
oscillation, it is unclear whether the oscillation of Ca
2+
levels results from
the oscillations of glycolytic and/or mitochondrial intermediates. The oscillation of
phosphofructokinase (PFK) activity is well known to produce the oscillation of its product,
fructose-1,6-bisphosphate which may in turn regulate oscillation of intracellular Ca
2+
concentrations (Tornheim, 1997). However, suppression of PFK activity in -cells did not
affect the oscillation of intracellular Ca
2+
concentration, suggesting that oscillation of PFK
activity may not control the pulsatile manner of insulin secretion. However, recent reports
reports have shown that there are oscillations of key metabolic products in the mitochondria
including citrate, ATP, NAD(P)H, and O
2
consumption (Bertram et al., 2007; Tengholm and
Gylfe, 2009). Notably, the oscillations of these metabolic products are also in the same range
as that of intracellular Ca
2+
oscillation. Although the oscillations of key products of
mitochondrial metabolism are likely to regulate the oscillations of intracellular Ca
2+
, Ca
2+
by
itself may feedback inhibit or stimulate the mitochondrial metabolism, resulting in the
decrease or increase insulin secretion. The intracellular Ca
2+
raised upon glucose-induced
insulin secretion can enter mitochondria via the uniporter and depolarize the
electrochemical potential in the inner membrane of the mitochondria thereby reducing
mitochondrial ATP production (Bertram et al., 2007; Tengholm and Gylfe, 2009). However,
Medical Complications of Type 2 Diabetes
10
the intra-mitochondrial Ca
2+
can also stimulate the activities of several mitochondrial
enzymes including the pyruvate dehydrogenase complex, isocitrate dehydrogenase and -
ketoglutarate dehydrogenase (Bertram et al., 2007; Tengholm and Gylfe, 2009). These
synchronous oscillations of products of mitochondrial metabolism are believed to
orchestrate the oscillation of insulin secretion.
Normoglycaemia is more efficiently maintained when insulin is delivered in a pulsatile
fashion, most probably because of enhanced expression on the target tissues of insulin
receptors that have a similar recycling periodicity. Significantly, this pulsatile delivery of
insulin is lost or severely diminished in type 2 diabetes. This contributes to insulin resistance
and the requirement for compensatory hypersecretion by the islets, potentially leading to
their exhaustion (Bertram et al., 2007; Tengholm and Gylfe, 2009).
5. Insulin signaling
Insulin signaling controls metabolism as well as growth and survival in many mammalian
tissues. It also plays a vital role in controlling lifespan (Longo et al., 2008). In humans,
perturbation of insulin signaling results in diabetes but is also implicated in neoplasia
(Pollak, 2008). Signaling via the insulin receptor (IR) results in activation of two main
signalling pathways: the phosphoinositide 3-kinase/Akt (PI3K/Akt) and the mitogen
activated protein kinase (MAPK) pathways. Both mitogenic and metabolic signalling
outcomes are activated via the IR and the response arising depends on expression levels of
the receptor and downstream signaling molecules by the cells within the target tissues.
The IR exists in two isoforms arising from alternative splicing (Belfiore et al., 2009; Denley et
al., 2003). The exon 11+ (IR-B) isoform is expressed in insulin sensitive tissues and primarily
in the liver. This receptor is responsible for the metabolic control processes classically
associated with insulin’s action. The exon 11- (IR-A) isoform, which lacks the 12 amino acids
normally encoded by exon 11, is expressed mainly in fetal tissues including liver, kidney
and muscle. Interestingly, both insulin and insulin-like growth factor-II (a structurally
related mitogenic growth factor) can bind to the IR-A with high affinity to promote cell
proliferation and survival. The foetal co-expression of IGF-II and IR-A suggests both may
act together to play an important role in foetal growth. Interestingly, expression of both IGF-
II and the IR-A is often upregulated in cancer and this represents an additional mechanism
by which cancer cells grow and survive (Avnet et al., 2009; Denley et al., 2003).
5.1 Insulin receptor structure
The IR is a transmembrane glycoprotein with tyrosine kinase activity. It is a homodimer
with each subunit consisting of an extracellular subunit and a transmembrane spanning
subunit (see Figure 2) (De Meyts and Whittaker, 2002; Ward and Lawrence, 2009). The
receptor is produced from a single proreceptor protein that is glycosylated, dimerised and
proteolytically processed into separate (~135kDa) and chains (95kDa, mature receptor
~460kDa). The ligand binding region is located in the extracellular subunits and the
tyrosine kinase domain is located in the cytoplasmic region of the subunits. The
stoichiometry of ligand binding is 1:1. A recent crystal structure of the extracellular portion
of the IR revealed a folded over conformation with two potential ligand binding pockets
(McKern et al., 2006; Smith et al., 2010). The residues important for ligand binding have been
identified by a series of detailed site-directed mutagenesis studies, with the use of IR:IGF-1R
Insulin Secretion and Actions
11
chimeras and using antibody competition for ligand binding (De Meyts and Whittaker,
2002). Within a single binding pocket ligand contacts the receptor at two sites. Site 1 is made
up of residues within the L1 domain (large domain 1 leucine rich region) and ID (insert
domain), with each derived from opposite receptor monomers. Site 2 is located within the
Fn-III-1 and Fn-III-2 domains (derived from the same monomer as the ID of site 1).
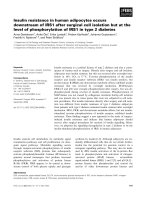
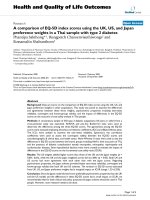
Fig. 2. The IR structure. The IR consists of 2 and intracellular subunits made up of the
following domains (labelled on one receptor monomer, Left): L1 and L2, large domains 1
and 2 (leucine-rich repeats); CR, Cys-rich domain; Fn1, Fn2, Fn3, fibronectin type III
domains 1-3 (also referred in the text as FnIII-1, FnIII-2, FnIII-3); ID, insert domain; Ex11, 12
residues encoded by exon11 (IR-B only); TM, transmembrane; JM, juxtamembrane; TK,
tyrosine kinase; CT, C-terminal domains (adapted from Denley et al., 2003). The ligand
binding regions are found in the L1, Fn1 and Fn2 (also referred in the text as FnIII-1 and -2)
and the ID. (Right) The folded over conformation of the receptor is revealed in the IR
ectodomain crystal structure (McKern et al., 2006), pdb 3LOH). The two binding pockets
evident in the folded over structure include residues from each receptor monomer. One
monomer is depicted in ribbon mode and the other is in surface filled mode.
While there is currently no structure of insulin bound to the intact IR, chemical cross-linking
data and the structure of the IR ectodomain have allowed the development of a structural
model of the interaction (Lou et al., 2006). Ligand binding cross-links the two receptor
monomers leading to a structural change in the ectodomain and precluding binding of a
second ligand molecule in the unoccupied binding pocket (as described in the mathematical
model by Kiselyov et al., (Kiselyov et al., 2009).
The receptor structural change is transduced across the transmembrane region to the
intracellular domain leading to activation of the intracellular tyrosine kinase domain. Crystal
structures of the inactive and activated forms of the IR tyrosine kinase domain reveal that the
first step in the activation process is the movement of an inhibitory arm reaching from the juxta
membrane region that maintains the tyrosine kinase domain in a basal, low activity state.
Removal of juxtamembrane domain Tyr984 from its contacts with the amino terminal kinase
lobe allows coordination of ATP and subsequent trans autophosphorylation of Tyr1146,
Tyr1150 and Tyr1151 within the activation loop of the tyrosine kinase domain (Hubbard, 2004).
Medical Complications of Type 2 Diabetes
12
5.2 Insulin signaling components
Following tyrosine kinase domain activation several other residues are phosphorylated and
these act as docking sites for downstream signaling molecules (Siddle, 2011; Taniguchi et al.,
2006). In fact at least 7 tyrosine residues, 12 serine residues and a single threonine have been
shown to be phosphorylated in response to insulin (Kohanski, 1993; Lewis et al., 1990; Tavare
and Denton, 1988; Tornqvist et al., 1987). Initial autophosphorylation of Tyr960 within a NPXY
motif of the transmembrane domain provides an important docking site for insulin receptor
substrate 1 and 2 (IRS-1 and IRS-2) and Shc (both substrates for the IR tyrosine kinase). The
Grb2-associated binder 1 (Gab 1) and Cas-Br-M (murine) ecotropic retroviral transforming
sequence homologue (Cbl) proteins also are substrates of the IR tyrosine kinase and play a role
in glucose uptake (see section 6.1). IRS-1 and IRS-2 contain a phosphotyrosine-binding domain
and a plekstrin-homology domain which facilitate the interaction with activated IR via
phosphoTyr960. IRS and Shc proteins are phosphorylated on multiple sites by the IR and these
phosphotyrosines then act as docking sites for different SH2 containing signaling molecules
including PI3K and growth receptor binding protein-2 (Grb2). These proteins are the first
molecules of the two main insulin stimulated signaling cascades: the PI3K-AKT/protein
kinase B (PKB) pathway, which leads to protein translation, metabolic control, cell cycling and
cell survival, and the Ras-mitogen-activated protein kinase (MAPK) pathway, which controls
cell growth and differentiation.
There are six IRS proteins with IRS-1 and IRS-2 being the most widely expressed (Taniguchi
et al., 2006). Knockdown studies in vivo and in vitro indicate that IRS-1 and IRS-2 play
different roles of in insulin signaling. For example, in vivo knockdown of hepatic IRS-1
expression is associated with increased gluconeogenesis whereas down-regulation of
hepatic IRS-2 is associated with expression of genes involved in lipogenesis. IRS-1 knockout
mice are small and insulin resistant with normal glucose homeostasis due to compensatory
insulin secretion. IRS-2 knockout mice are normal in size but develop diabetes and are
insulin resistant due to reduced -cell mass (reviewed in (Taguchi and White, 2008)).
Although they do recruit many of the same binding partners the signalling differences of the
two IRS isoforms may be explained by their differing abilities to bind certain downstream
signalling molecules. Subcellular localisation or activation kinetics may also play a role. IRS
signalling is controlled by feedback mechanisms predominantly involving serine
phosphorylation of the IRS proteins by downstream kinases including Akt, S6K1 and GSK3,
and leading to IRS inactivation (Taniguchi et al., 2006).
Several proteins regulate signaling via the IR (Taniguchi et al., 2006). SOCS-3 (suppressor of
cytokine signalling-3), induced by cytokine signaling, regulates IR signaling by competing
for binding with IRS proteins to phosphorylated Tyr960, thereby down-regulating insulin’s
action. SOCS proteins have attracted significant interest as they are up-regulated in cases of
insulin resistance. Growth factor receptor bound proteins (Grb10/Grb14) act as pseudo
substrates for the tyrosine kinase domain of activated IR and thereby inhibit further
phosphorylation of downstream signaling molecules including IRS-1. They also protect the
phosphotyrosines in the tyrosine kinase domain from dephosphorylation by phosphatases,
thus potentially prolonging receptor activation (Holt and Siddle, 2005). One such
phosphatase is PTP1B, which directly interacts with the IR tyrosine kinase domain thereby
reducing IR signalling activity (Yip et al., 2010). Grb10 also promotes receptor
downregulation via its interaction with the ubiquitin ligase NEDD4 (Ramos et al., 2006;
Vecchione et al., 2003). Simultaneous knockout of Grb10 and Grb14 improved glucose
homeostasis due to enhanced IR signalling (Holt et al., 2009; Holt and Siddle, 2005).
Insulin Secretion and Actions
13
MEK
ERK
Rap tor
RAF
AKT
PIP2
PIP3
PTEN
PDK
pY pY
pY pY
IRS-1/2
pY
mTORC2
pS
pT
IRS-1/2
pY pS
AS160
pS
AS160
Rab GTPases
GLUT4
Glucose
uptake
Gluconeogenesis
Glyc o ge n
synthesis
GSK3GSK3
GS
pS
FOXO1
pS
FOXO1
Protein
synthesis
mTORC1
TSC1/2
Rhe b
TSC1/2
pS
INS
PTP1B
RAS
GTP
Gr b2
SOS
Transcription
(mitogenic activity)
pY
pS
pS
pT
PI3K
IR
Elk - 1
pS
c-Fos
pS
p90RSK
pS
S6
K1
pS
SHC
pY
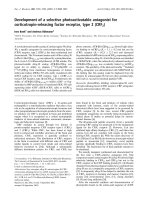
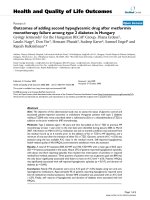
Fig. 3. The canonical insulin receptor signalling pathways (PI3K/AKT and MAPK pathways).
Binding of insulin (INS) to the insulin receptor (IR) leads to activation of the intracellular
receptor tyrosine kinase. Subsequent autophosphorylation leads to recruitment of IRS-1/2 and
Shc. Activated PI3K then converts phosphotidyl inositol (4,5) bisphosphate (PIP2) to
phosphotidyl inositol (3,4,5) trisphosphate which then recruits PDK and AKT to the membrane.
AKT is phosphorylated on Thr308 by PDK and Ser473 by mTORC2. There are many target
substrates of the serine kinase AKT including TSC1/2, which when phosphorylated by AKT
becomes inactive and thereby promotes activation of the mTORC1 complex and subsequent
protein synthesis. Inactivation of the GTPase activating protein AS160 by AKT relieves the
inhibition of RAB GTPase to promote GLUT4 translocation and glucose uptake. Glycogen
synthase promotes glycogen synthesis when AKT inactivates GSK3 and phosphorylation of
FOXO1 prevents its translocation to the nucleus and thus inhibits gluconeogenesis. AKT
signalling is switched off by the phosphatases PTEN (converts PIP3 to PIP2) and PTP1B (direct
action on the IR). Mitogenic signalling involves recruitment of Grb2 by activated IRS-1/2 and
Shc. SOS bound to Grb2 acts as a guanine exchange factor promoting the formation of active
RAS GTP. Activation of RAF and the downstream MAPK signalling cascade follows leading to
activation of p90RSK and protein synthesis as well as the transcription factors Elk-1 and c-FOS.
IRS proteins are negatively regulated upon serine phosphorylation by AKT, mTORC1, pS6K
and activated ERK1/2. Activation is indicated by a solid line and inhibition by a dashed line.
IRS, insulin receptor substrate; PI3K, phosphotidylinositol 3-kinase; PDK, protein dependent
kinase; mTORC, mammalian target of rapamycin complex; PTEN, phosphatase and tensin
homologue; FOXO1, forkhead box O1; GSK3, glycogen synthase kinase 3; GS glycogen
synthase; AS160, AKT substrate of 160kDa; TSC1/2, tuberous sclerosis complex-1 and -2; Rheb,
Ras homologue enriched in brain; Raptor, regulatory associated protein of mTOR; PTP1B,
protein tyrosine phosphatase 1B; Grb2, growth receptor binding protein 2; SOS, son-of-
sevenless; MEK, MAPK kinase; ERK, extracellular signal-regulated kinase 1 and 2; p90RSK, p90
ribosomal protein S6 kinase; pY, phosphotyrosine; pS, phosphoserine; pT, phosphothreonine.
Medical Complications of Type 2 Diabetes
14
Activation of the IR by insulin also leads to internalization of the ligand:receptor
complex and results in endosomal breakdown of insulin. Internalised receptor is either
degraded or recycled back to the membrane for further signaling events (Foti et al.,
2004). Interestingly, rapid receptor recycling is linked to sustained Akt signalling
(Romanelli et al., 2007), whereas there is evidence that receptor internalization plays a
role in prolonged signalling associated with the MAPK pathway and mitogenic activity
(Jensen et al., 2007).
6. Insulin actions
6.1 Mitogenic effects
Insulin receptor signaling via the MAPK pathway leads predominantly to mitogenic
biological effects such as cell growth, survival and differentiation (Belfiore et al., 2009;
Siddle, 2011). Binding and activation of IRS proteins leads to recruitment of Grb2 and the
guanyl nucleotide exchange factor SOS (son-of-sevenless). SOS then activates the small
GTPase Ras which in turn activates Raf and the MAPK, MEK and Erk1/2 signaling
cascade. Activated Erk1/2 phosphorylates a series of targets including p90 ribosomal
protein S6 kinase (p90RSK), which promotes protein synthesis, and the transcription
factors Elk-1 and c-Fos (Figure 3) (Shaul and Seger, 2007). Erk1 and Erk2 have both
overlapping and unique functions. Erk1 knockout mice develop normally and are born a
normal size probably due to compensation by Erk2. However, Erk1 knockouts do have
deficient thymocyte maturation and some neurological defects. In contrast knockout of
Erk2 is embryonic lethal. In relation to metabolism, Erk1 appears to play specific roles in
adipogenesis (Taniguchi et al., 2006).
While insulin stimulates mitogenic effects such as promoting pancreatic cell health
through signalling via the IR (Belfiore et al., 2009), it is also able to activate mitogenic
pathways upon binding to the highly similar type 1 IGF receptor (IGF-1R) (Pollak and
Russell-Jones, 2010). IGFs promote cell proliferation, survival and migration upon
activation of the IGF-1R. IGFs are essential for normal growth and development and also
promote cancer cell proliferation and survival. Elevated circulating IGF-I levels have been
associated with an increased risk of cancer and up-regulation of IGF-I, IGF-II and the IGF-
1R is commonly seen in many types of cancer (Pollak, 2008). The affinity of insulin for the
IGF-1R is at least 100-fold lower than the affinity of IGF-I for its receptor. Therefore
activation of the IGF-1R by insulin only occurs in situations of high insulin concentrations.
For this reason there is growing concern that hyperinsulinemia associated with Type 2
diabetes leads to an elevated risk of cancer, highlighting the need for tight glucose control
in these patients. Furthermore the potential increased cancer risk is being assessed for
patients currently treated with long acting insulin mimetics such as glargine which have
increased IGF-1R binding affinities (Pollak and Russell-Jones, 2010).
6.2 Metabolic effects
Insulin exerts its metabolic effects in three major tissues including liver, skeletal muscle and
adipose tissues. Those effects include the stimulation of glucose transport, glycolysis,
lipogenesis and protein synthesis while inhibiting gluconeogenesis, glycogenolysis, lipolysis
and protein breakdown (see Figure 4).
Insulin Secretion and Actions
15
insulin
Glycolysis
Lipogenesis
Glycogenesis
Glycogenolysis
Gluconeogenesis
-
+
Glucose
LIVER
GLUT4
Protein synthesis
Glycogenesis
Glycogenolysis
Protein breakdown
+
-
MUSCLE
GLUT4
LPL
Lipogenesis
Lipolysis
+
-
ADIPOCYTES
Fig. 4. Metabolic effects of insulin in liver, adipose tissue and skeletal muscle. In liver,
insulin stimulates glycogenesis, glycolysis and lipogenesis (de novo fatty acid synthesis) but
inhibits glycogenolysis and gluconeogenesis. In muscle, insulin stimulates glucose uptake
via GLUT4 transporter, glycogenesis and protein synthesis but inhibits protein breakdown
and glycogenolysis. In adipose tissue, insulin stimulates glucose uptake via GLUT4,
lipogenesis (de novo fatty acid synthesis), and triglyceride synthesis by stimulating LPL
activity. -, inhibition; +, stimulation.
6.2.1 Glucose transport
Glucose transporter 4 (GLUT4) is the most abundant transporter isoform in adipocytes
and myocytes and is the only isoform that is regulated by insulin (Bryant et al., 2002).
GLUT4 acts as the gate that allows extracellular glucose to enter the cells. During nutrient
restriction or unstimulated conditions, 5-10% of GLUT4 is located on the plasma
membrane while 90-95% is sequestered in an intracellular vesicle-bound form. However,
when the concentration of extracellular glucose becomes high and the insulin is released,
GLUT4 is translocated from intracellular sites to the plasma membrane (Holman and
Cushman, 1994). The molecular mechanism by which insulin promotes the translocation
of GLUT4 depends upon phosphorylation of downstream kinases including PI3K and
Akt. The production of phosphoinositol(3,4,5) triphosphate by PI3K facilitates the release
of the vesicle-bound GLUT4 and allows trafficking to the cell surface. The increased
phosphoinositol (3,4,5)-triphosphate also promotes actin polymerization, resulting in the
mobilization of the vesicle-bound GLUT4 near the plasma membrane. The other signal
that promotes translocation of GLUT4 involves phosphorylation of Cbl that is associated